Customer Segmentation Using RFM Model
on
p-ISSN: 2301-5373
e-ISSN: 2654-5101
Jurnal Elektronik Ilmu Komputer Udayana
Volume 8, No 2. November 2019
Customer Segmentation Using RFM Model
Made Chandra Hendrawaa1 , I Putu Gede Hendra Suputraa2
aInformatics Department, Udayana University
Bali, Indonesia
1candrahendrawan31@gmail.com 2hendra.suputra@gmail.com
Abstract
At the time of the ASEAN Economic Community (MEA), Indonesia was selected by several companies from other countries to sell its products, including overseas paint companies. Therefore, the increasingly fierce market competition business is unlikely to focus solely on products sold, but it is also important to pay attention to the process of managing customer relationships with retailers. Segmentation is an early process that knows which customers can be sustained. In segmentation, customers who have certain similarities will be grouped into one.
Customer segmentation is a model built in grouping customers according to certain standards to be used as a variable grouping. Customers will be the same group if they have certain similarities, while different groups or segments are customers who have different characteristics.
Keywords: customer segmentation, clustering, RFM Model
In line with human civilization influences the development of information technology (IT). The development of IT affects several sectors, such as in business, health, education, and government. In business competition, companies are demanded to be able to make the most of existing capabilities to be able to compete with other companies. Changes in customer needs drive changes in marketing. The company's marketing department has an important role in facing increasingly fierce competition with other companies. Market-oriented companies or in other words selling products to customers generally will face problems in the field of marketing. Market surveys are needed to obtain information about customer-specific requests and needs. Companies must consider the characteristics of each customer. That information is used to develop products that contain optimal combinations and attributes desired by the customer. Today, modern companies not only focus on strategies that prioritize products (product/service-oriented), they also carry out strategies that prioritize customers (customer-oriented). This is important to do for the development of the company by creating good relations between the company and customers. The changing economic situation of the people, with increasingly fierce competition in the food industry, is marked by the increasing number of similar products offered to customers. Information technology is very influential for the progress of an industry. Information technology helps provide better services or products to customers.
Customer segmentation is needed to classify customers who have similar characteristics. This is necessary to determine consumer behavior so that it will help in the application of appropriate marketing strategies to increase company revenue. The use of RFM model techniques is one solution to the problem of consumer segmentation. Data is expected to help the process of making the right decisions, allowing companies or industries to manage data stored in a database, data warehouse, or other storage area into a new information and knowledge.
RFM model is a model that distinguishes important customers from big data by three variables, namely recency, frequency and monetary. The software used to conduct this research is Microsoft Excel for data storage. RFM model can help in the process of grouping each customer category and knowing the level of loyalty it has.
-
2. Research Methods
-
2.1 Cross Industry Standard Process
-
Cross-Industry Standard Process is the method used in this study. CRISP is a model of data that is often used by experts to solve problems. The course of research refers to the six stages of CRISP, which includes the process of understanding business, understanding data, data preparation, modeling, evaluation, and the final process is development/dissemination.
Understand the goals and needs within the scope of the business or research unit, translate this knowledge into data problems. Then determine the strategy to achieve these goals. in this study using the parameters of recency (last doing transactions), frequency (often holding transactions), and monetary (how much money for transactions). In addition to facilitate the grouping of data and labeling customers.
In this process, an understanding of data needs will be made related to the achievement of objectives in CRM (Customer Relationship Management) and data . Data is taken from one of Retailer. Then do data understanding, identify data quality, examine data and clean invalid data (data cleansing). This study uses data on the sale of Retailer from June 1, 2018, to December 31, 2018.
At this stage, the stored data will be prepared so as to facilitate the process. There are several processes that can be done to prepare data including choosing variables to be analyzed, cleaning data, preparing initial data so that it is ready for data transformation.
In this stage, the selection and application of various modeling techniques will be carried out and some parameters will be adjusted to get the optimal value. Specifically, there are several different techniques that can be applied to the same problem. On the other hand, there are modeling techniques that require special formats so that at this stage it is still possible to return to the previous stage.
At this stage, the model has been formed and is expected to have good quality from the point of view of data analysis. At this stage, an evaluation will be carried out on whether the model can achieve the objectives set in the initial phase (data understanding). The key to this stage is to determine whether or not the business problem is considered. At the end of this stage, the data process results must be determined.
In the final stage, the knowledge or information that has been obtained will be arranged and presented in a special form so that it can be used by users. The development phase can be
in the form of making simple reports or implementing repetitive processes within the company. In many cases, the deployment stage involves consumers, in addition to data analysts, because it is very important for consumers to understand the actions that must be taken using the models that have been made.
The rationale for cross-selling, defined in the introduction as “the strategy of selling other products to a customer who has already purchased a product from the vendor” is not only to “increase the customer’s reliance on the company and decrease the likelihood of switching to another provider” but also to exert a generally positive influence on the relationship with the customer, strengthening the link between provider and user. Increasing product holding leads to an increased number of connection points with customers, as well as increasing the switching costs they would face if they decided to take their custom elsewhere. Increased product holding also creates a situation in which the company can get to know its customers better through a greater understanding of buying patterns and
Customer segmentation is used in different settings, for instance, using customer segmentation for estimating customer future value as a part of customer lifetime value (CLV) in-retailer and RFM analysis is a widely used method that identifies customer behavior and represents customer behavior characteristics, and it stands for the words: Recency, Frequency, and Monetary. Generally, these parameters are defined as follows:
-
• Recency: The interval between the purchase and the time of analysis.
-
• Frequency: The number of purchases within a certain period.
-
• Monetary: The amount of money spent during a certain period.
These definitions are adaptable and can vary in different cases. In recent years, several researchers tried to extend the concept of RFM analysis, but there is a lack of studies that analyze the customer segments.
|
Beginning Data |
End Data |
|
Last Transaction Date (tipe: date) |
Recency (type: number) |
|
Frequency Transaction |
Frequency |
|
Total nominal transaction |
Monetary |
Moreover, the rapid development of data mining methods enables using a large database of customer data to extract knowledge, supporting the marketing decision process. As the ability to acquire new customers and retain existing is crucial, especially in the finance marketplace, the possibility of customer segmentation by obtaining the information on unknown hidden patterns has a major significance. Until now only a few papers present using data mining techniques in retail. In our work, we consider the application of a new RFM segmentation algorithm in this area (Zakrzewska & Murlewski, 2005).
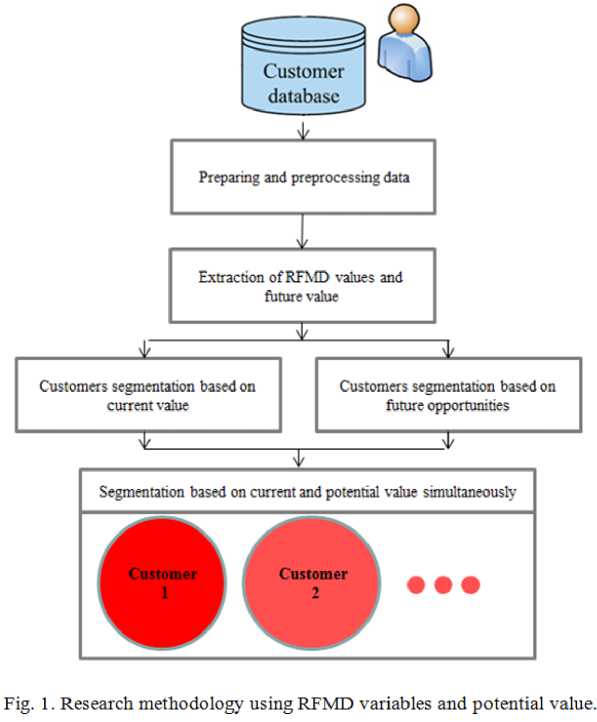
In this study, the numbers of retailer users retail. These user demographics were shown in table I. Additionally, retail customer table was shown in table II. The proposed methodology utilized a new segmentation methodology, as shown in Fig. 1. In this work, the customer priority number (CPN) or RFM as a new model of RFM, was introduced for the first time. It is the product of the recency (R), frequency (F), average transaction amount or monetary (M)
RFM = R x F x M
|
Name |
Last Transac tion |
Frequency |
Total |
|
Adi |
6/5/2018 |
2 |
1,554,000 |
|
Agustinus Prie |
12/23/2018 |
3 |
615,000 |
|
Aisyah Eliani |
6/10/2018 |
3 |
2,205,000 |
|
Anggun Kusuma |
7/15/2018 |
53 |
40,771,000 |
|
Antariksa Laksinta |
10/18/2018 |
2 |
883000 |
|
Anton |
12/12/2018 |
4 |
4498000 |
|
Arindro Nugroho |
8/3/2018 |
1 |
761000 |
|
Astri |
12/19/2018 |
6 |
5135000 |
|
Awaludin Nur Imam |
10/18/2018 |
2 |
883000 |
|
Ayu |
8/21/2018 |
4 |
9710000 |
|
Cahyo Eko Saputro |
7/27/2018 |
1 |
1313000 |
|
Chatarin Dewi |
9/13/2018 |
2 |
1320000 |
|
Danang Prayoga |
7/15/2018 |
1 |
1780500 |
|
Dani Prasetyo |
6/16/2018 |
1 |
1057000 |
|
Darmini |
6/28/2018 |
1 |
388000 |
|
Dayat |
12/25/2018 |
1 |
4338000 |
Table I. Transaction Data
The rationale of the proposed approach is that if customers have had similar purchasing behavior, then they are very likely also to have similar RFM values. RFM values were used to cluster customers into groups with similar RFM values. The scaling of R–F–M attributes as shown in table II.
|
Field Name |
Description |
Value Set |
|
Recency |
Dibawah 15, 16-30, 31 dan keatas (hari) |
{3,2,1} |
|
Transaction Frequency |
Dibawah 5,5-20, 21 dan keatas |
{1,2,3} |
|
Transaction Amount Average |
1.000.000 dan dibawah, 1.000.00110.000.000, 10.000.001 – 30.000.000, diatas 30.000.001 |
{1,2,3,4} |
|
Deposit Average |
1.000.000 dan dibawah, 1.000.00110.000.000, 10.000.001 – 30.000.000, diatas 30.000.001 |
{1,2,3,4} |
Table II. RFM Values
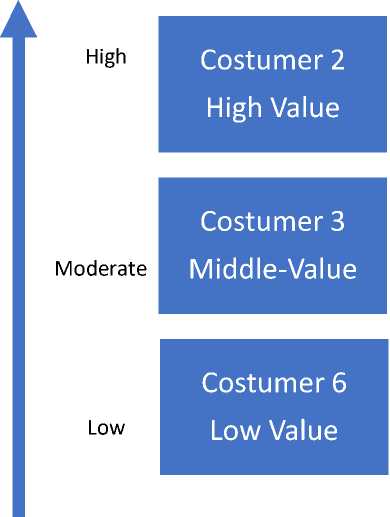
Costumer 1
Extremely Value
Costumer 4
Moderate loyalty
Costumer 5
Potential Value
Picture I. CLV Costumer
|
Segment |
Value |
|
High Value |
81~144 |
|
Moderate |
36~80 |
|
Low |
1~35 |
Table III. Segmentation Scale
RFM refers to the customer current value. It calculated for each stored customer data (Table III). RFM or CPN ranking was illustrated in Table III. The rankings given are normally scored on a scale of 1-4. Therefore, CPN would be between 1 and 144. After the case priority number (CPN) was computed, customer current value could be determined. After RFM computation, the potential value of customer based on future opportunities should be estimated. The CPN and potential value of customers are the main elements for customer segmentation (Picture I).
|
ID |
Acc-No Recency Transaction |
Transaction |
Deposit |
R |
F |
M |
D |
|
Frequency |
Amount |
Average | |||||
|
Average |
|
0017805 |
0027864 |
10 |
30 |
12.000.000 |
410.000.000 3 3 |
3 |
4 |
|
0017760 |
0027866 |
8 |
4 |
4.500.000 |
50.120.000 3 1 |
2 |
2 |
|
Table IV. |
RFM Result | ||||||
|
ID |
RFMD |
Current Value |
Potential Value |
Customer Type or Segment |
Marketing Segment Strategy | ||
|
. |
. |
. |
. |
. |
.. |
|
0017805 |
108 |
High |
High |
Costumer 1 |
Extremely important |
Relationship management Retention |
|
0017760 |
12 |
Low |
High |
Costumer 5 |
Potential value | |
|
0017832 |
24 |
Low |
Low |
Costumer 6 |
Low value |
Growing |
Table V. Costumer Segmentation
Three customers were selected to show methodology effectiveness. The real data of selected customers and related R, F, M were shown in Table IV. RFM were computed and customer potential values were illustrated in Table IV. Meanwhile, customer type and its marketing strategy were derived (Table V).
The main objective of this research is customer segmentation and measuring their loyalty to an product by combining RFM models and CLV method. RFM model which consists of recency, frequency and monetary is used as variable/attribute data used for the clustering process. To find the most optimal number of clusters. The result is that there are 3 clusters with their respective characteristics. Application of RFM models and clustering techniques can help identify customers with high value and potentially provide benefits and can assist in designing appropriate marketing strategies for the three clusters that are formed.
-
[1] H. Zhao and C. He, “Objective cluster analysis in value-based customer segmentation method,” Proc. - 2009 2nd Int. Work. Knowl. Discov. Data Mining, WKKD 2009, pp. 484–487, 2009.
-
[2] W. Bi, M. Cai, M. Liu, and G. Li, “A Big Data Clustering Algorithm for Mitigating the Risk of Customer Churn,” IEEE Trans. Ind. Informatics, vol. 12, no. 3, pp. 1270–1281, 2016.
-
[3] Y. Chen, G. Zhang, D. Hu, and S. Wang, “Customer Segmentation in Customer Relationship Management Based on Data Mining,” vol. 207, pp. 288–293, 2006.
-
[4] I. Soesanti, “Web-Based Monitoring System on the Production
Process of Yogyakarta Batik Industry,” J. Theor. Appl. Inf. Technol., vol. 87, no. 1, pp.
146–152, 2016.
-
[5] Y. Luo, Q. R. Cai, H. X. Xi, Y. J. Liu, and Z. M. Yu, “Telecom customer segmentation with K-means clustering,” ICCSE 2012 - Proc. 2012 7th Int. Conf. Comput. Sci. Educ., no. Iccse, pp. 648– 651, 2012.
-
[6] D. Zheng, “Application of silence customer segmentation in securities industry based
on fuzzy cluster algorithm,” J. Inf. Comput. Sci., vol. 10, no. 13, pp. 4337–4347, 2013.
161
Discussion and feedback