Tempo Tracking on Guru Ding Dong Transcript using Connected Component Labeling (CCL) Method
on
p-ISSN: 2301-5373
e-ISSN: 2654-5101
Jurnal Elektronik Ilmu Komputer Udayana
Volume 8, No 2. November 2019
Tempo Tracking on Guru Ding Dong Transcript using Connected Component Labeling (CCL) Method
Gede Putra Dharmajayaa1, I Dewa Made Bayu Atmaja Darmawana2
aInformatics Department, Udayana University
Bali, Indonesia
Abstract
Music notation is a system of writing musical expressions as outlined in the form of symbols in the form of numbers or blocks. Music notation is used to document the composer's work in the form of songs so that it can be used by the public. In Balinese culture there is also a musical notation called Guru Ding Dong's Notation. This study discusses the segmentation of guru ding dong transcript to determine the tempo of each notation using the Connected Component Labeling method and the rule-based method. CCL algorithm applies Graph theory, where all pixels in an area that have a relationship with obeying the rules of pixel proximity will become a new image. The image that can be processed by the CCL algorithm is a binary image. In addition, this study also uses the image preprocessing method for initial data processing, namely grayscaling and binarization. The system built for research uses the MATLAB 2017b application. The results of the test resulted in an accuracy of the successful identification of characters and the tempo of each notation of 82%, this is influenced by the preprocessing process where there is a lot of noise in the image.
Keywords: Segmentation, Rule Based, Connected Component Labeling, Sheet Music
Every song created by composers through musical instruments has documentation in the form of musical notation. Music notation [1] is a medium for composers so that music that has been created can be played or sung again by others. Each note on the composer's work is symbolized by a certain symbol. To make it easier for others to understand and understand these symbols, it is necessary to standardize writing symbols or slow musical notation. In Indonesia, traditional musical instruments, especially traditional Balinese music, have a song documentation system that uses music notation with the name of a guru ding dong. Guru ding dong notation contains symbols that represent the tone of the musical instrument. In modern music performances, musicians are guided by musical notation. Unlike traditional music, especially in the performance of Balinese musical art, musical notation is only as a tool (scores). Balinese musical composers make music notation as a reminder when playing musical instruments. In the notation there are only the main notes, while the notes that will be played on each instrument have been remembered by composers.
At present, the Balinese people, especially musical artists, do not know and learn the music notes of guru ding dong. When it was introduced and studied Balinese gamelan instruments, percussion trainers would immediately give songs to be tried on the instruments without giving knowledge about music notation. Guru ding dong notation is currently only studied in educational institutions such as at the Vocational High School and Universities that have a Balinese musical curriculum. In addition, guru ding dong notation document is one of Balinese material culture that should be preserved. Efforts have been made to preserve guru ding dong notation by documenting Balinese music notation [2] which contains a collection of musical notations that can be learned by the public. However, the lack of understanding to read guru dingdong notation made artists who learn musical art immediately try to play a musical instrument without first understanding music notation.
With the role of technology that is combined with culture will create an application that is able to facilitate the public to learn guru ding dong notation. This study discusses the processing of music notation to get the tempo value of each note by using the Connected Component Labeling (CCL) segmentation method. CCL segmentation [3] is an algorithm with a graph concept where the set of parts of connected components will be uniquely labeled based on the given heuristic value. The purpose of this CCL segmentation is to cut an image into several single images by separating the background with the object that will be examined. This method works well on binary images, although it can also be applied to RGB and grayscale images. In image segmentation, CCL works by searching for objects between backgrounds by checking each pixel from top to bottom and left to right. Each object will be labeled, where the same label value will be cut into one new image object.
Research related to music notation was conducted by [4] [5] which discussed the segmentation of beam notation. The two studies segmented the beam notation to determine the pitch of each note. The segmentation used is line segmentation where the beam notation will be divided based on scales first horizontally then vertical segmentation is performed to determine the order of the notes. Constraints experienced in the study are managing the rules when reading music notation, designing a system for reading simple notation with 30 rules is still possible but for music notation with a high level of complexity which consists of hundreds of rules resulting in the difficulty of managing syntactic methods for reading music notation correctly. Another obstacle is the difficulty of determining the tone of a note due to the degradation of paper notation and the lack of standard rules in music notation made before the XIX century. Whereas music notation made after XIX century produces segmentation with high accuracy.
Research related to image segmentation using the Connected Component Labeling (CCL) method was conducted by [6] [7] which discussed segmentation of two-dimensional objects and Balinese script documents. The CCL method works well in both studies because the data used are binary images that have values between 0 and 1. CCL will label pixels with a value of 1 (white) instead of 0 (background). By using the principle of neighborhood, CCL will check each pixel that has a relationship. Before segmenting, the data used will be done by the process of image preprocessing which is to arrange the image so that it can be easily segmented. Image Preprocessing consists of grayscaling and binarization processes. In two-dimensional object segmentation, the CCL method can segment with an accuracy of 80% while in the Balinese script, the CCL method can detect all characters of Balinese characters correctly.
This research is divided into several stages, namely: data collection, preprocessing, segmentation, rule based checking, and system testing. The data collection phase is carried out by collecting transcript notations from respondents. Then proceed with the preprocessing process [6] which aims to increase the value of accuracy of the next process. The preprocessing stage is divided into two processes, namely grayscaling and binarization. CCL segmentation will then be performed on the transcript to produce character chunks that will become notes. Each character will be matched with rule based to determine the tempo value of each note. After all characters get the tempo value, it will check the accuracy and display the output in the form of a transcript notation and the tempo value. Here is the system design of the tempo tracking guru ding dong notation:
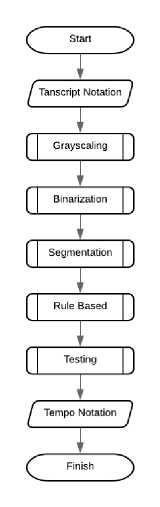
Figure 1. Flowchart System
The data used in this study were guru ding dong transcript taken from five respondents. Each respondent will write one verse with a guru ding dong where each verse consists of 10 characters of notation. Respondents will write a notation on the paper provided that has been given a border line so that the data obtained is controlled. The data will be scanned and will be used at a later stage. The total data used is 50 characters of guru ding dong notation.
Grayscaling is the first stage of the digital image preprocessing process. Grayscaling is the process of converting an RGB image into a grayscale (gray) image. The image that each pixel has different components of red, green, and blue colors will be done color alignment that makes the three components have the same value. The image of the grayscaling process is a gray image with different intensity levels from the black to white range.
The grayscaling method used in this study is the weighted method. Weighted method [8] is a grayscaling method that uses the concept of human eye sensitivity to color. Calculation of the weighted method is in equation (1).
Y = ((0.3 * r) + (0.59 * g) + (0.11 * b)) (1)
Note:
Y = gray scale value
r = red component value
g = green component value
b = component value blue
This method reduces the contribution of the red and blue component values and contributes a greater value to the green component. The contribution value given to each pixel is 30% red, 59% green, and 11% blue.
-
2.3. Binarization
Binarization is the second stage of the process of preprocessing digital images. Binarization is the process of changing a grayscale image into a binary image. Binary images are digital images that have a matrix value of each pixel of only 0 or 1. In other words, a binary image has only two possible values in each pixel of 0 and 1. The image generated from the binarization process is a black and white image.
The method used in the binarization process is the thresholding method. Thresholding [9] is a method for converting grayscale images to binary images by floating operations. Image floating operations are performed by grouping the gray degree values of each pixel into two classes, namely black (0) and white (1). The threshold value used to determine the class of pixels is 127 obtained from the range of pixel colors from 0 - 255. The floating function can be seen in equation (2).
fe^.f) = [
1. f'W <T O, lainnya
(2)
Note:
fB (i, j) = gray scale value on index i, j
T = threshold value
To be segmented, binary images need to go through an invert process. In the segmentation process, the area selected for segmentation is pixels that have values (not 0). In binary images, the object to be segmented has a value of 0 (black) and a background value of white (1). The invert process [10] is used to invert the foreground and background values. The output of the invert process is the opposite of binary image. The invert process uses NOT logic by checking each pixel if a pixel has a value of 0 then it will be changed to 1 and vice versa.
Segmentation is a process used to divide a binary image between the foreground and background sections. The method used to segment is Connected Component Labeling (CCL). CCL algorithm [10] is a technique used to classify regions or objects in a digital image. This technique utilizes the theory of pixel connectivity in images. Every pixel in a region is called connected if there is an adjacency or pixel neighbor rule. Pixels that are connected basically also have adjacency with others because they still have neighborhood or neighborhood relations.
The CCL method is used because the use of research data in the form of characters that only considers the shape and the constraints of each character that cannot be divided into regions because the character size is not the same. With the principle of neighborhood, segmentation will be done on the part of the image that has a relationship.
The CCL method [11] has two types of connectivity used in two-dimensional images, namely 4-Connected Neighborhood and 8-Connected Neighborhood. In this study, the connectivity used is 8-Connected Neighborhood where the pixels that will be checked will be checked on the horizontal, vertical, and diagonal sections. This connectivity is used so that no part is missed from the foreground in segmenting the foreground. Following is the algorithm of 8-Connected Neighborhood:
-
a. Do a search for each pixel starting from the matrix row and then continuing with the column to find a different pixel value that will be called (p).
-
b. In pixel (p), check each neighbor of pixel p by using the 8-Connected Neighborhood in the upper, left, top left diagonal and right top diagonal.
-
c. If all four neighboring pixels are 0, give a new sign to pixel (p).
-
d. If only one of the neighboring pixels has a value of 1 then mark the neighboring pixel at
pixel (p).
-
e. If two or more pixels in a neighbor are worth 1, give one of the marks in the pixel (p), then all the signs in the pixel neighbor (p) that have a value of 1 are equivalent.
The last step of the 8-Connected Neighborhood is to re-examine all pixels that have been labeled in the image then replace each label with a label of an equivalent class.
The application of the CCL algorithm [3] starts from finding the foreground by finding the pixel value with a value of 1. The checking process starts from the top to the bottom then from left to
right. When you have obtained the foreground portion the neighboring pixel will be checked. If there is no label, then give it a new label. If there is a label, give a value according to the smallest label value. Do the checking until all the foreground has a label. Re-check to make sure all the labels of the neighbor have the same label and the smallest value.
Rule base method is a set of rules used to convert data into desired information. The use of rule-based methods in this study to classify the results of segmentation according to tempo value. The rules for reading guru dingdong notation are obtained from experts, namely percussion trainers. The following is a set of rules used to determine the tempo value of each character of the guru's notation:
-
a. A note value with a tempo of 1 beat if it consists of only one character without being equipped with a ticket (line) and ending with a period.
-
b. A note value with a tempo of ½ beats if a character is accompanied by a line and is followed by one other character.
-
c. Note value with tempo ⅓ beats when a character is equipped with two lines and is followed by two other characters.
Each character that has been segmented will be checked into the rule and then the tempo value will be determined.
Testing is the stage to determine the accuracy of the success rate of the system to determine the tempo of the music notation transcript. This stage provides information about how well the system works to solve the problems in this study. The accuracy value is calculated using the equation [12] (3).
P (N) = ^ x 100% (3)
Note:
P (N) = Accuracy value (%)
IN = Amount of data is correct
N = Total data
The first step in this research is data collection. The data used are primary data obtained from respondents. Respondents were chosen randomly and data were taken in the form of one verse song with the guru ding dong. The media used for data retrieval is white paper that has been given a dividing line each line so that the data used can be processed properly. All data obtained from respondents will be scanned into a digital form called a transcript. The amount of data used is 50 characters divided into 5 verse songs. The following is one of the results from the guru ding dong notation transcript.

Figure 2. Guru Dingdong Notation’s Transcript
The next step is image preprocessing by changing the transcript image into a grayscale image. Transcripts in RGB color format will be changed to gray scale using the weighted method. This process is carried out to facilitate changes to binary images. The result of the grayscaling
process is a gray image where the RGB components of each pixel have the same value. Here is the image of the grayscaling process.
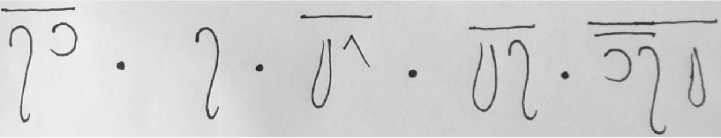
Figure 3. Grayscale Image
The process continues to the second part of image preprocessing, which is binarization. RGB images that have been converted into grayscale images are converted back into binary images. Where each pixel with a range of 0 - 255 in the grayscale image is converted to a value of 0 or 1. The change in value is determined from the value of each pixel. With the thresholding method pixels with values below 127 will be given a value of 0 and the rest will be given a value of 1. The result of the binarization process is a black and white image. Here is the image of the binarization process.
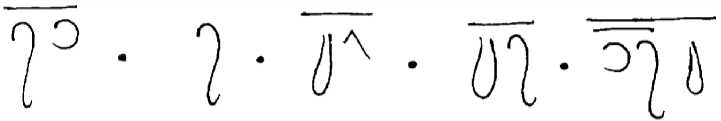
Figure 3.1. Binary Image
To be segmented, the image in the foreground part must have a value. Binary image in the previous process has a value of 0 in the foreground and 1 in the background. There is a need to reverse the value of the foreground and background using the invert method. The invert method will reverse the value of each pixel in the binary image. If a pixel has a value of 0, it will be
changed to 1, and vice versa. Here is a binary image after invertin
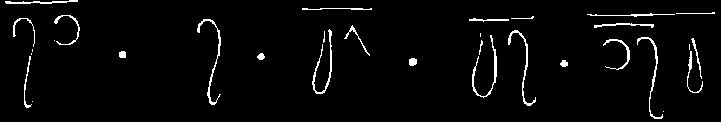
Figure 4. Invert Binary Image
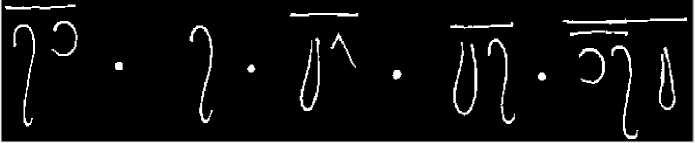
Next is the main part of this research, the segmentation process. This process will cut and separate the inverse binary image in the previous process into several parts of the image. The CCL segmentation method can be used on binary inverse images because the first step of this method is to check the value of each pixel. The area to be segmented is pixels that have a value of 1. Furthermore, each pixel with a value of 1 is labeled according to the 8-Neighborhood Connectivity rule, where each pixel will be checked for neighboring values and will be adjusted to the smallest label value. After all pixels are labeled, the image will be cut where pixels that have the same label value will become a new image. The results of this segmentation process are several new images identified as characters. Here are some images from the CCL segmentation results.

Figure 5. Five Segmented Image
The last step is checking the image of segmentation results with a set of rules that have been collected in the rule-based method. Each character will be identified by class based on size. There are three classes of rules, namely notes, lines and points. Lines have a minimum width of 50 pixels, dots have a maximum width of 20 pixels, and others will be entered into the notes class. If a note is not below the line then the tempo value of the note is one beat, if a note is
below a line and is followed by another note then each note has a tempo value of ½ a beat. If a
note is below two lines and is followed by two other notes, then each note has a tempo ⅓ beat value. After all characters are checked, the system will display the transcript of the notation and tempo value of each note. Next is the system output display.
'1/2' '1∕2, '1' '1/2' ,1∕2, ,1∕2' '1/2' '1/3' '1/3' '1/3'
Figure 6. Output System
The data used in this study were guru dingdong transcript taken from five respondents. Each respondent will write one verse with a guru dingdong where each verse consists of 10 characters of notation. Respondents will write a notation on the paper provided that has been given a border line so that the data obtained is controlled. The data will be scanned and will be used at a later stage. The total data used is 50 characters of guru dingdong notation.
Table 1. Testing System
|
Transcript Notation |
Notation |
Accuracy |
|
Correct tempo |
41 |
82% |
|
Wrong tempo |
9 |
18% |
|
total |
50 |
100% |
From the table, it is found that from the bottom of 50 segmented characters, there are 9 data that have an incorrect tempo value and 41 characters that have a correct tempo value. The accuracy rate of the system is 82%.
This study discusses the tempo identification on the guru dingdong notation transcript. The method used is CCL segmentation and rule-based methods. Previously the preprocessing process was done by grayscaling and binarization to produce a good system output in the
segmentation process. The accuracy obtained by the system in determining the tempo value of each character notation is 82%.
In the segmentation process, many notation characters are not read properly because in the process of notation writing by respondents, some respondents make character notation according to the rules and intermittent writing that causes the segmentation process of one-character notation can be several characters. It is expected that in subsequent studies, a data control is made with the provisions that respondents must write song notation in one write, so that the results of better segmentation.
References
-
[1] Y. Suyanto and T. P. Ari, "Pembangkit notasi musik angka untuk paduan suara dari teks polos," Seminar Nasiobal Riset Dan Teknologi Terapan (RITEKTRA VI), 2016.
-
[2] I. N. Rembang, Hasil Pendokumentasian Notasi Gending-Gending Lelambatan klasik pegongan daerah bali. Departemen Pendidikan dan Kebudayaan Direktorat Jendral Kebudayaan Proyek Pengembangan Kesenian Bali., 1985.
-
[3] O. Salem, "Connected Component Labeling Algorithm," Code Project, no. (Segmentation)., 2014.
-
[4] A. L. J. &. S. G. Fornés, Primitive segmentation in old handwritten music scores, Springer, Berlin, Heidelberg.: In International Workshop on Graphics Recognition (pp. 279-290), 2005.
-
[5] P. B. I. &. N. P. Bellini, An Off-line Optical Music Sheet Recognition, IGI Global: In Visual Perception of Music Notation: On-Line and Off Line Recognition (pp. 40-77), 2004.
-
[6] K. Yudhistiro, "MENGHITUNG OBYEK 2D MENGGUNAKAN CONNECTED COMPONENT LABELING," In Seminar Nasional Sistem Informasi (SENASIF) , pp. (Vol. 1, No. 1), 2017.
-
[7] Utama, Transliterasi Dokumen Aksara Bali menggunakan Segmentasi Connected Component Label (CCL) dan Metode Backpropagation, Badung: Jurnal Ilmu Komputer, 2018.
-
[8] D. Salomon, "The Computer Graphics Manual," Springer-Verlag, vol. 42, 2011.
-
[9] R. Munir, Pengolahan citra digital dengan pendekatan algoritmik, Bandung: Informatika, 2004.
-
[10] D. Putra, Pengolahan Citra Digital, Yogyakarta: ANDI, 2010.
-
[11] R. C. W. R. E. &. E. S. L. Gonzalez, "Digital Image Processing Using Matlab - Gonzalez
Woods & Eddins.pdf. Education.," https://doi.org/10.1117/1.3115362, 2004.
-
[12] R. K. F. Provost, "Glossary of Terms," Journal of Machine Learning, pp. 271-274, 1998.
-
[13] R. &. P. F. Kohavi, "Glossary of Terms Journal of Machine Learning. Machine Learning.,"
1998.
144
Discussion and feedback