Song Recommendations Based on Artists with Cosine Similarity Algorithms and K-Nearest Neighbor
on
p-ISSN: 2301-5373
e-ISSN: 2654-5101
Jurnal Elektronik Ilmu Komputer Udayana
Volume 8, No 4. May 2019
Song Recommendations Based on Artists with Cosine Similarity Algorithms and K-Nearest Neighbor
Muhammad Arief Budiman a1, Gst. Ayu Vida Mastrika Giri a2
aInformatics Department, Udayana University Bali, Indonesia 1mdafbn2000@gmail.com
Abstract
The development of the music industry is currently growing rapidly, millions of music works continue to be issued by various music artists. As for the technologies also follows these developments, examples are mobile phones applications that have music subscription services, namely Spotify, Joox, GrooveShark, and others. Application-based services are increasingly in demand by users for streaming music, free or paid. In this paper, a music recommendation system is proposed, which the system itself can recommend songs based on the similarity of the artist that the user likes or has heard. This research uses Collaborative Filtering method with Cosine Similarity and K-Nearest Neighbor algorithm. From this research, a system that can recommend songs based on artists who are related to one another is generated.
Keywords: Song Recommendation, Cosine Similarity, K-Nearest Neighbor
In today's digital era, technological development is growing very fast. All human work is helped a lot by the developing technology, such as mobile phones. With a mobile phone, users can do a variety of things they want to do, for examples are listening to music both online and offline, ordering food through the application, making documents, and others.
Not only in the field of technology, the development of the music industry is currently growing rapidly, millions of music works continue to be issued by various music artists. As for examples are applications that have music subscription services, namely Spotify, Joox, GrooveShark, and others. Application-based services are increasingly in demand by users for streaming music, free or paid.
DailySocial conducted a survey in February 2018 about the habits of the Indonesian people towards music streaming services. This survey involved around 1955 male and female respondents from various age ranges and regions in Indonesia. The survey results show that: 88% listen to music online regularly from the last six months of the survey with 51.05% of them listening to music 1 to 14 hours per week, 52% are subscribed to paid streaming services, where JOOX streaming service is most widely used ie around 70.37% for paid and 68.16% for free, around 56.12% use streaming services because they get free access, while 87.77% use streaming services because of the complete song catalog, and around 44.89% have subscribe for 6 months.
However, due to the development of this growing music industry, a lot of song data are available in various song libraries. With so much music data available, it will be difficult for users to find the music they like. Some music service applications provide several features that can make it easier for users to find the music they like, one of that is the music search feature, usually using tagging or labels. Even though the music service application already has this feature, it is proven that it is still ineffective, because if someone wants to find a song by entering the word "jazz", it will display song data which is a jazz genre or there is the word jazz as its label. However, the results of the song data do not go through the filter or filtering stage
regarding jazz songs that the user really wants to hear, so there are a lot of song data that sounds unfamiliar to the user's ear.
In the study 'A Music Recommendation System Based on User Behavior' written by Yajie Hun (2011), a system was formed to recommend appropriate songs from existing song collections to users, where this song: liked by users, fresh (new) for the user, and according to the pattern of listening history from the user. The "forgetting curve" is used to assess the freshness of a song and evaluate "favoredness" using the user's history. The author analyzes the user's pattern to estimate the level of interest of the user for the next song and also analyzes the user's behavior towards the song being played as feedback to set the next song recommendation.
In the research 'Collaborative Filtering and Its Application' written by Eka Angga Laksana (2014), there are explanations about collaborative filtering, which is one of the techniques in the recommender system that is most often used because it is classified as good in performance. Recommender systems are often used in the field of E-Commerce to form a website personalization. E-Commerce website users will certainly look for a particular product, so it takes the role of the recommender system in displaying products related to the product preferred by the user. Users can rate products they like on a certain scale.
In the same year, a study was conducted by Trini Saptariani with the title 'Music Recommendation System Using Latent Semantic Analysis', which in this journal discusses the design of a new music recommendation system based on the Latent Semantic Analysis (LSA) method. This method will be used as a search based on the music history accessed by the user. By comparing user behavior with a structured music database, we will get search results and music recommendations that are more relevant and more personal. This research provides more accurate results because this music recommendation service not only looks at similar genres, but also looks at user habits and the similarity of tags from songs/artists.
From the presented problems and studies, a music recommendation system is proposed which can recommend songs based on the similarity of the artist that the user likes. The purpose of this study is to create a recommendation system for songs, so users can listen to the songs they like with different version and other songs they might like.
Collaborative Filtering is one of the methods used to develop a recommender system. Product rating is the most important element of this algorithm, where the rating is obtained from most users who explicitly provide an assessment of the item. In essence, the system provides a return to the user by processing these data, and will make it possible to do a statistical calculation which results show which products are given a high rating by the user. Collaborative filtering uses a database obtained from the user. There are two main components in this data in order to make predictions for the recommender system, namely users and items. There are many algorithms for collaborative filtering, more commonly K-Nearest Neighbor (User-CF, Item-CF, etc.).
The collaborative filtering approach to the recommendation algorithm involves gathering "a large amount of information about the user's behavior, activities, or preferences and predicting what users will like based on their similarities with other users." An important point to be made about this method is that the item itself, or its features, which are recommended are not analyzed, instead, this approach assumes that previous information in the user's history is about how they agree with other users (for example User A likes Film A and User B likes Film A, so they will have the same interests) , will be a prediction in determining whether they will enjoy certain items. Collecting data in this approach involves collecting explicit data, such as asking users to rate an item, and collecting implicit data, such as keeping records of how often and for how long the user viewed an item.
The collaborative filtering approach builds a model of user behavior (items previously purchased or selected and / or numerical ratings given for the item) as well as similar decisions made by
other users. This model is then used to predict items (or rankings for items) that the user might be interested in. The flow of collaborative filtering in general can be seen in Figure 1.
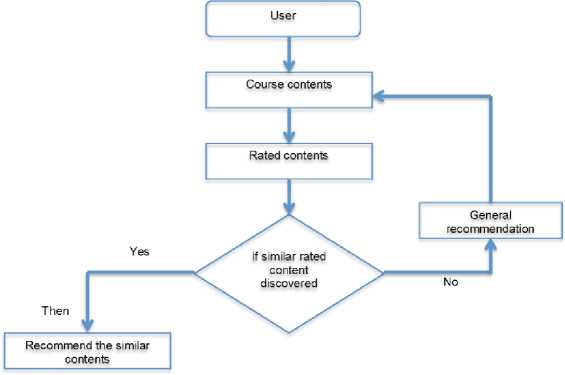
Figure 1. Collaborative Filtering Stages
(Ngo, et al, 2018)
Collaborative filtering uses user actions to recommend other items. In general, this approach can be user-based or item-based. Item-based approaches are usually used more often than user-based approaches. User-based approaches are often more difficult to measure because of the dynamic nature of users, whereas items usually do not change much, and item-based approaches can often be counted offline and presented without being continually retrained.
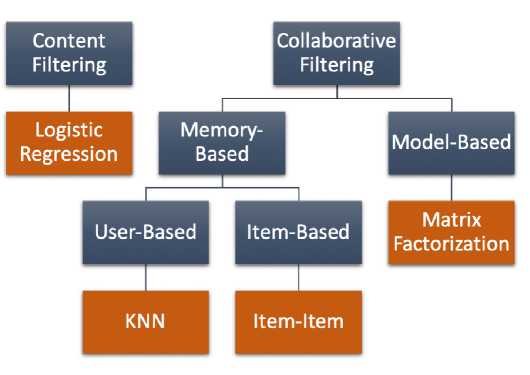
Figure 2. Categories of the System Recommendation Model
(Ngo, et al, 2018)
In Figure 2 there is a recommendation system model category. Where in collaborative filtering there is a memory-based system that relies on previous data to determine recommendations for new users. This model uses relatively simple techniques to measure similarity, such as Pearson coefficient or cosine similarity. Similarities to previous data points are used to make recommendations (for example with KNN).
As for the item-based system itself, the item community is what will be formed. These communities are created based on user preferences, but in the end the community formed becomes independent of user preferences. This system works when user preferences vary very little over time. After an item's community is set, users who like items in a particular community will be recommended other items in that community.
Cosine similarity is a method that can be used to see the similarity of content between data. In this case, cosine similarity functions to test the size that can be used as an interpretation of the proximity of the distance based on the similarity between artists using existing datasets.
The similarity between two items, as usual, is determined by the number of joint events of the
two items in another session. Thus, the similarity between items can then be calculated.
(Ludewig, et al, 2018)
∑
cos( )=
(1)
√∑ ( ) ․√∑ ( )
Equation 1 is a calculation of the distance with cosine similarity from the similarity of Q to D. Q and D are test data in the form of artists, which will be compared between Q and D related to similarity between the two artists. In this equation, n is a slice of the two artist data, namely Q and D, so n will determine the amount of data from the 2 artist columns. In the numerator section, the data in artist Q and D columns will be multiplied with each other, for example Qi is the i column data for artist Q, then it will be multiplied by Di which is the i column data for artist D. Whereas in the numerator section, the data in the artist Q column is squared, then added to the next data in that column which has also been squared, and the root of the results will be searched. The same goes for artist column D. After that, the results of the artist Q and D. columns will be multiplied.
The K-Nearest Neighbor (K-NN) model for recommendations is an item-based algorithm that looks for neighbors between items, unlike user-based algorithms that look for neighbors between users.
To implement item-based collaborative filtering, K-Nearest Neighbor is the perfect choice model and is also an excellent baseline for developing a recommendation system. K-NN is a nonparametric learning method. This method uses a database where data points are separated into groups to make conclusions for new samples.
K-NN does not make any assumptions about the distribution of the underlying data but only depends on the similarity of item features. When K-NN draws conclusions about an item, K-NN will calculate the "distance" between the target item and every other item in the database, then rank the distance and produce the top K closest neighbor of an item as the most similar item recommendation.
The algorithm of the K-Nearest Neighbors method is as follows: (Han, et al, 2012) a. Determine the parameter k (number of nearest neighbors).
-
b. Calculate the distance between the data to be evaluated and all training data.
-
c. Sort the distance formed (in ascending order) and determine the closest distance to the k-order.
-
d. Attach the appropriate class (c).
-
e. Find the number of classes from the nearest neighbor, and specify the class as the data class being evaluated.
The advantage of the K-Nearest Neighbor algorithm is that it does not require a long time for the training process, when compared to the backpropagation algorithm. (Redjeki, 2013)
In this study, a dataset from Last.FM was used in the form of listening history of 1257 Last.FM users along with 285 artists who had been listened to by users. In the existing data, if the user has heard a piece of music from an artist then a value of 1 will be given, while if the user has never heard it will be given a value of 0. Examples of research data (listening history) can be seen in table 1.
|
User |
a perfect circle |
abba |
ac/dc |
adam green |
|
1 |
0 |
0 |
0 |
0 |
|
33 |
0 |
0 |
0 |
1 |
|
42 |
0 |
0 |
0 |
0 |
Table 1. Research Data Samples (User Listening History)
From the results of the analysis of the problems that have been described previously, we need a music recommendation that uses the user's listening history from various artistst. The designed recommendations can later receive input in the form of an artist's name and will show the output in the form of recommendations of other artists related to the artist's input. The general design process implemented in this music recommendation is illustrated through the
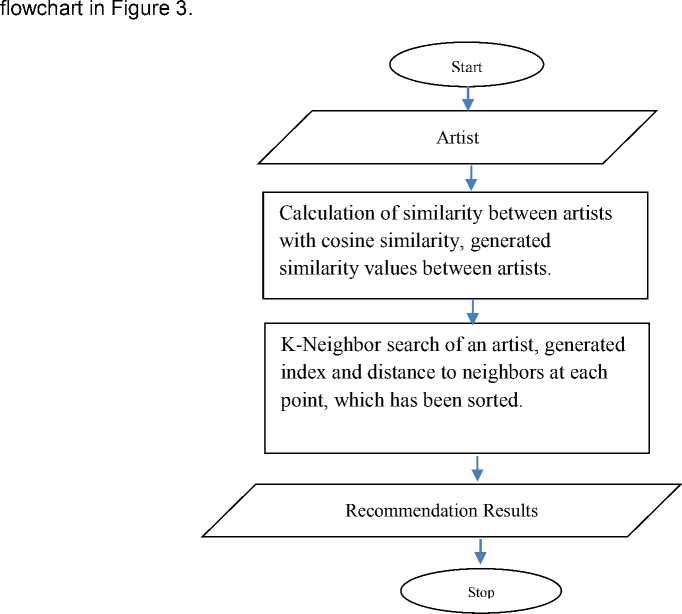
Figure 3. Flow of the Recommendation Process
In the recommendation process that is made, data is entered in the form of an artist. Then the similarity between artists will be calculated, which is derived from the user's listening history, with cosine similarity. For example, if several users have all heard the same 5 artists, it will be stated that the artists have similarities. Then, depending on the results of the comparison between artists, the similarity value is obtained.
After getting the similarity between artists with each other, a similarity value matrix will be obtained. In Figure 4 is an example of a matrix similarity form.
|
[[ |
1' J |
≡- j |
0.01791723, . |
• ■ J |
0.06506 |
|
0.05216405, |
0- b | ||||
|
[ |
o. , |
1. , |
θ.05227877, . |
■ > J |
0. |
|
0.02536731, |
0. h | ||||
|
[ |
0.01791723, |
0.05227877, |
1. j- |
• ∙ J |
0.02039967 |
|
0.13084898, |
0- b |
-
Figure 4. Example of Similarity Matrix
3.2 K-Nearest Neighbor
From the similarity matrix data, K-Nearest Neighbor will be used as a collaborative filtering algorithm to predict recommendations. In this step, the K-NN algorithm measures the distance to determine the “proximity” of the artist instance and find the closest 372eighbour of the instance. After obtaining a similarity value (distance) between the artists, the recommendation for an artist with the closest k-neighbor will be predicted, where the closest value is then sorted from the largest to the smallest, and the top recommendation is chosen from that value. Figures 5 and 6 show the results of the K-Nearest Neighbor algorithm in which indexes and distances to neighbors at each point are generated, which are sorted, based on the closest point index (most similar) in the similarity matrix.
-
Figure 5. Examples of Index
a adam
perfect abba ac/dc aerosmith
. . qreen
circle
a perfect 1 ooθoc,o 0i0000c,0 o.O17917 0.051554 0.062776
circle
abba 0.000000 1.000000 0.052279 0.025071 0.061056
ac/dc 0.017917 0.052279 1.000000 0.113154 0.177153
adam 0.051554 0.025071 0.113154 1.000000 0.056637
green
aerosmith 0.062776 0.061056 0.177153 0.056637 1.000000
-
Figure 6. Examples of Distance
3.3 Final Result
By using the index sorted in Figure 5 in accordance with the similarity value in Figure 6, various other artists' recommendations will be generated in accordance with the artist entered, in Figure 7.
|
0 |
1 |
2 |
3 | |
|
a perf ect circle |
a perfect circlle |
tool |
dredg |
defto∩es |
|
abba |
abba |
robbie williams |
elvis pres ley |
madonna |
|
ac/dc |
ac/dc |
iron maiden |
m eta I Iica |
black sabbath |
|
adam green |
adam green |
the libertines |
the strokes |
babyshambles |
|
aerosmith |
aerosmith |
ιi2 |
led Zeppelin |
Ienny kravitz |
-
Figure 7. Example of Recommendation Results
We distributed questionnaires to a number of students at Udayana University, in order to find out the response given regarding this system, by giving a rating, namely:
-
1. Not Good
-
2. Less Good
-
3. Enough
-
4. Good
-
5. Very Good
-
10 students who filled out the questionnaire, 4 of them chose 4 and 6 chose 5, so that the system resulted in satisfaction rates ranging from good to very good.
In addition, checking is also done of each result obtained, for example is in the first result. A Perfect Circle is an American rock group, then the results that are recommendations for users who hear the artist A Perfect Circle are various rock groups or other alternatives, which by the system have been quite well recommended.
From the results of this study, it is evident that the proposed method works well, where it can recommend songs based on the connection of the artist from other users. In addition, questionnaires have also been filled out that have yielded satisfying results and checks have been performed on the artist, which results that the recommended artists have a connection.
References
-
[1] Abraham, Sirajuddin, dkk. (2017). Sistem Rekomendasi Artikel Berita Menggunakan Metode K-Nearest Neighbor Berbasis Website.
-
[2] Ekstrand, Michael D. (2011). Collaborative Filtering Recommender Systems.
-
[3] Griesmeyer, Robert. (2011). Music Recommendation and Classification Utilizing Machine Learning and Clustering Methods.
-
[4] Hun, Yajie, dkk. (2011). A Music Recommendation System Based On User Behavior.
-
[5] Laksana, Eka Angga. (2014). Collaborative Filtering dan Aplikasinya.
-
[6] Li, Susan. (2017, September 20). How Did We Build Book Recommender Systems in An Hour Part 2 — k Nearest Neighbors and Matrix Factorization.
https://towardsdatascience.com.
-
[7] Liao, Kevin. (2018, November 11). Prototyping a Recommender System Step by Step Part 1: KNN Item-Based Collaborative Filtering. https://towardsdatascience.com.
-
[8] Ludewig, Malte, dkk. (2018). Effective Nearest-Neighbor Music Recommendations.
-
[9] Narayanan, Sivabalan, dkk. (2013). K-nearest Neighborhood Based Music Recommendation System.
-
[10] Ngo, Brendan, dkk. (2018, December 16). Muse: A Music Recommendation System. https://medium.com.
-
[11] Prasetya, Chandra S. D. (2017). Sistem Rekomendasi Pada E-Commerce Menggunakan K-Nearest Neighbor.
-
[12] Rivki, Muhammad, dkk. (2017). Implementasi Algoritma K-Nearest Neighbor dalam Pengklasifikasian Follower Twitter yang Menggunakan Bahasa Indonesia.
-
[13] Saptariani, Trini, dkk. (2014). Sistem Rekomendasi Musik Menggunakan Latent Semantic Analysis.
-
[14] Srebrenik, Brian. (2018, December 5). Introduction to Music Recommendation and Machine Learning. https://medium.com.
-
[15] Sulistyono, Wiwied. (2009). Sistem Rekomendasi Musik Untuk Personalisasi Web Menggunakan Metode User-Based Collaborative Filtering.
-
[16] Wang, Hua-Ming, dkk. (2015). Personalized recommendation system K- neighbor algorithm optimization.
-
[17] Wibowo, Hardianto. (2016). Klasifikasi Musik Berdasarkan Aktif Frequensi Menggunakan Metode K-Nearest Neighbor (KNN), In Proceeding SENTRA (Seminar Teknologi dan Rekayasa) (No. 2).
374
Discussion and feedback