Automatic Essay Answer Rating Using the Text Similarity Method
on
p-ISSN: 2301-5373
e-ISSN: 2654-5101
Jurnal Elektronik Ilmu Komputer Udayana
Volume 8, No 4. May 2020
Automatic Essay Answer Rating Using the Text Similarity Method
Cokorda Gde Abimanyu1, Ngurah Agus Sanjaya ER2
Informatics departement, Faculty of Science and mathematics,Udayana University Badung, Bali Indonesia 1cokdabi@gmail.com
2agus_sanjaya@unud.ac.id(Corresponding author)
Abstract
Assesments are required in order to evaluate the performance of students. A typical method of learning assesments in class is by examination. An essay type exam is a form of assesment where there are no answer choices provided and generally applied to measure the students’ level of understanding of the knowledge. To asses the quality of the essay answers manually is a subjective task as well as time consuming. In this reasearch, we propose an automatic method of assessing essay answers by applying the cosine similarity method.
In this research, the students’ answer document and the correct answer document are used as input. Both documents are then preprocessed and represented in vector form using word2vec. We then measure the similarity between the documents by calculating the cosine similarity of the two vectors. The cosine similarity values are converted back again and used as the final grades. The results of the final grade are then compared to the values given by the instructor to show accuracy of the proposed approach.
Keywords: calculating, essay, vector, documens, Cosine Similarity
word frequencies in a document. The value of the number of occurrences of a word (tf) is calculated in giving weight to a word. The greater the number of occurrences of a word (high tf) in a document, the greater the weight in the document or will provide greater conformity values (Yates, et al., 1999). This method aims to equalize the two sentences in a document that will be compared, then the results of the comparison will be used as similarity values.
There are several studies related to the issue of automatic assessment of essay answers, such as in a journal entitled Pre-Processed Latent Semantic Analysis For Automatic Essay Grading[3]. Where in this journal the author makes automatic essay evaluations using Latent Semantic Analysis. Where before the text was given a score, the text was processed first using synonym checking. The calibration process is carried out to handle various possible correct answers and help simplify the term matrix. In this journal, the implementation of the approach is carried out using Java Programming Language and WordNet as a lexical database to search for synonyms of each given word. The accuracy obtained by applying the model is 54.9289%.
In another journal entitled Application of Automatic Essay Test Assessment Using the Cosine Similarity Method[2]. Cosine similarity method has been implemented where the calculation of similarity or similarity of two documents, namely student exam answers documents and key documents teacher answers. To equalize the frequency of each word contained in a sentence, use the Tf or Term Frequency equation, Term Frequency is a factor that determines the weight of words based on the number of word frequencies in a document. Based on the results of the study that the automatic essay grading system using the cosine similarity method has been running well for essay exams in English. The trial results show the suitability of the system value with the value given by the instructor is an average of 89.48%.
Word2vec Analysis for the Calculation of Semantic Similarities between Words[5]. This journal word representations have been done using Word2vec method where this is done to calculate the semantic similarities between words. In this research, the calculation of semantic similarity between words for English is carried out. The corpus used in this study were Brown Corpus, Corpus News, and Harry Potter Corpus. The document was converted into vector form with Word2vec. Then the semantic similarity value generated from the vector is compared with the SimLex999 Gold Standard dataset to measure the correlation value. The test results show that the measurement of Word2vec produces a correlation of 0.192 with the calculation of Pearson correlation
Research Design The research design to be used in this study is as shown in Figure 1.
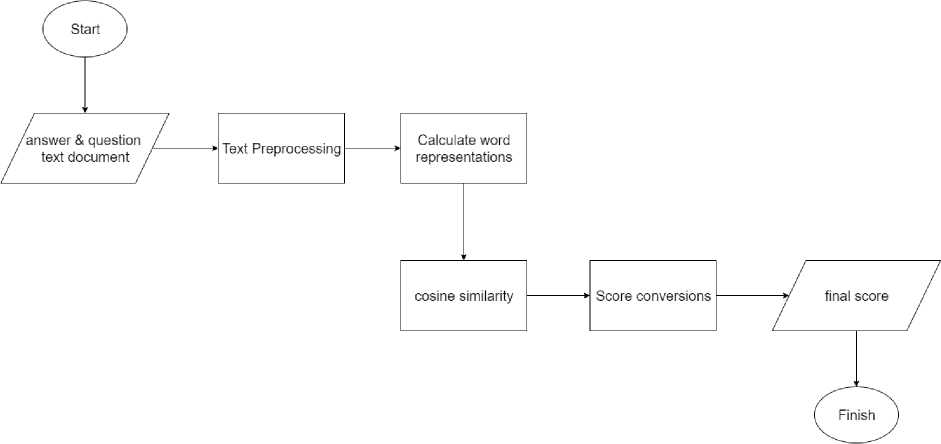
Figure 1. Research Design
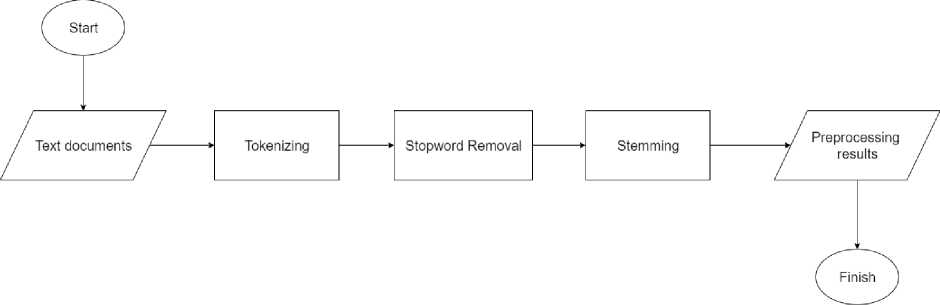
Figure 2. Flowchart Pre-Processing
Based on the system design above, there are several things that must be done in the system, namely A. Pre-Processing
In this stage all documents entered into the system will be preprocessed. At this stage all documents entered must be in the form of *. Txt files, if the documents entered are in * .pdf format, then a library that is needed to extract pdf is needed. The next stage is separating each word in the sentence based on spaces, later, tabulations, periods (.) And commas (,), this technique is often called tokenization. After all the words in the document are successfully separated, the next is to throw words that are included in the stopword list. When separating words in documents often find many words with high frequency but do not have important meaning to be drafted, these words are usually entered into the list of stopword words, for example, the word 'and' this word is a word included in the list stopword. Next is stemming, in this stage the system will search for the basic words of each word found. In this study, at the stemming stage, it is useful to search for the basic words of each word found.
-
B. Word2vec
Word2vec is used to convert words into vector shapes in order to find the value of the proximity of vectors between words. The sequence of Word2vec processes can be seen in Figure 3 below.


Figure 3. Flowchart Word2Vec
-
1. Reading the corpus The system reads the entire contents of the corpus data that has been done the preprocessing process. Where the data read is in the form of words in a sentence that has been converted into an array
-
2. Model Making
-
• Build context of word pairs from corpus data based on the number of window sizes. In the previous study stated that window size 5 has optimal results.
-
• After that, training to convert data into one-hot-vector format. This is done to change the shape of each word in the dataset into a binary vector.
-
• The next step is the system to train the model to predict input word vectors based on the context of the surrounding words with one hidden layer and 300 vector dimensions because in previous studies it was said that the vector dimensions have optimal results.
-
• From the hidden layer the output matrix is generated, then the matrix is changed with the Softmax function to get Word Vector.
-
3. Word Vector
After the modeling process is complete, the system generates vectors of each word from the corpus data. In Word2vec, each word can have more than one vector, because every word in a sentence has a different context.
-
4. Calculation of similarity using cosine similarity
This stage calculates the similarity of students' essay answers with the key answers lecturers have, using the following equation.
s im i I ar i ty (q,d) =
∑tk ξ i wg k × wdk
J∑L1(wgfc)2 √∑U(wdfc)2
at this stage only comparing two documents. At this stage it produces an output in the form of similarity values between the two documents which will then be converted into student grades.
-
5. Converting Similarity Values into Essay Test Scores
Table 1. Range of student answer scores
|
Comparison of score ranges | |
|
Score of similarity |
Score of human rates |
|
0.01 – 0.10 |
10 |
|
0.11 – 0.20 |
20 |
|
0.21 – 0.30 |
30 |
|
0.31 – 0.40 |
40 |
|
0.41 – 0.50 |
50 |
|
0.51 – 0.60 |
60 |
|
0.61 – 0.70 |
70 |
|
0.71 – 0.80 |
80 |
|
0.81 – 0.90 |
90 |
|
0.91 – 1.00 |
100 |
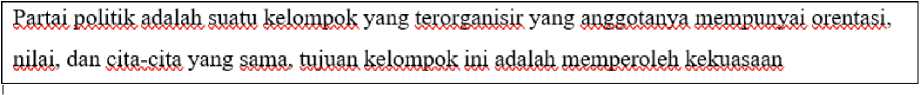
The implementation is carried out with the python programming language, the experiments carried out were only carried out on one problem. answer.txt file is the answer key of the problem and the result.txt file is the answer entered by the user. The following are examples of key answers and answers entered by the user:
Hasiltes.txt
Mai PPilUk di Indonesia ⅛⅛ 9®W,i yang M⅛t RflgjfiBflE dan ⅛∣j⅛ oleh a⅛fc⅛mP⅛ Indonesia Ml S⅛pM .^ dan gj⅛fcgj⅛, MMtk IagaaBguuaRgJsaa dan ^ξ⅛⅛ ta&Uugaa RRkUk aBsgκ⅛. ≡sxarak⅛ fegassa dan negara, ggχ⅛ ιp^⅛⅛akgfl⅛ft Negara K?P#W B-PPMklik Indonesia fegsstafc©. Pancasila dan MSJI&IMW Dasar Negara BmUUk Indonesia ⅛JR 1946. BgflggsJjaEL UU WPftftW Uaktm1Rasal ι mt ι Pfcdaiig-Uftdaftg No. 2 χ⅛⅛ 2008 ⅛a⅛aBS EasJaiEeljJjk
JawabaiLtxt
The data is one example of the data displayed to show the results of preprocessing, then the word is represented by Word2vec and form a wordvector, then the two documents are calculated using the
cosine similarity method. The following is an example of the results of preprocessing data:
Word2vec is used to convert words into vector shapes in order to find the value of the proximity of vectors between words[5]. _
|
Representasi Kata | |
|
Kunci Jawaban ∖AAAAAA√ WZVZVZVZWZVZVZVZV |
Jawaban |
|
vectorl: Counter({,kelompok': 2. 'partai': 1, ’ l VAAAAAAAAAyWV , WZVZWZWA Z 'politik': 1, 'suatu': 1, 'organisir': 1, 'anggota': 1, VAAAAAAy * VAAAAAAy * VAAAAAAAAAAy * VAAyVAAAAAA * 'punya': 1, 'orentasi': 1, 'nilai': 1, 'cita': 1, 'sama': , , z Vaaaaaaaaaa z vaaaaa , vaaaa , vaaaaaa 1, 'tuiu': 1, 'adalah': 1, 'kuasa': 1}) , VAAAAy ' vaaaaaaaa ' vaaaaaaa * * |
vector2: Counter({'indonesia': 4. 'negara': 4. ’l Vaaaaaaaaaaaz r u r 'politik': 3, 'dasar': 3, 'partai': 2, 'republik': 2, VAAAAAAy * VAAAAAAy • VAAAAAA • VAAAAAAAAAA Z 'undang': 2, 'tahun': 2, 'l': 2, 'organisasi': 1, 'sifat': vazw<aaaAa * wzvzwzwa z * wzw/wzwzvzwzw ' wzvzwa 1. 'nasional': 1. 'bentuk': 1, 'kelompok': 1, 'warga': , Vzvzvzwzwzvzvzva , vzwzwzwzwz , Waaaaazwazwa , Wzvzvzvaaa 1, 'cara': 1, 'sukarela1: 1, 'atas': 1, 'sama,: 1, z Vzwzwa , Vzwzwzwzvzwa • vzwzvaa ∙ Vzwzvzwa * 'hendak': 1, 'cita': 1, 'juang': 1, 'bela': 1, 'penting': Wzwzwzwzva * wzwa z VwzvzSzvzv , wzwzva z Wzwzvzwzvw 1, 'anggota': 1, 'masyarakat': 1, 'bangsa': 1, Z VAAZWAAAAZVy Z WAZWZVAZVZVZVZWA * WAZVAAAZVZVy Z 'pelihara': 1. 'utuh': 1. 'satu': 1. 'pancasila': 1. Wzwzwzwzvzva ' vzwzvzwz , vzwzwa ' Wzvzvzwzwzwzva ' l1946': 1, 'erti': 1, 'cantum': 1, 'pasal': 1, 'ayat': 1, z wzwa z Wzwzvzwzwa , ⅞λzvzwzva , WzWZVA ' ,no,: 1, l2,: 1, ,2008,: 1}) |
|
StemmingI | |
|
SefeeJum |
Sesudefe |
|
'EaM ⅛sliJiK ⅛mi⅛' 'KsteiORafe' 'MtRiflaoijtei' '∞ate∞' 'ragroiMm' 'ateoiate'.' W'.' W «M' ⅛m' Misil' 'KslsroiRGK Wan’ 'OTsroResRisti' 'KstemsW |
Γlteltte' 'Rβ∣⅛iK Ww' 'KsteOTRfeK' 'RHJWil, 'RJOfeflRte' 'Punya' 'SteOiate' W W 'sama' W 'KstemRsK 'Wah’ 'KwWJ |
After that, the calculation of text similarity with Cosine similiarity is calculated and the result of the value is converted again to the final value in accordance with the previous range of values.
Each value obtained by the system is compared with the value given manually by the student and a comparison is obtained as shown below.
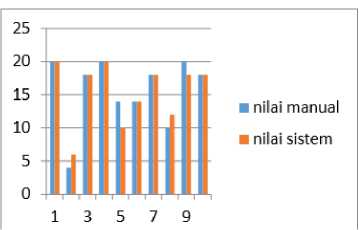
Figure 4. Comparison graph of assessment results
The results obtained correspondence between the results of assessments carried out manually by humans with assessments carried out by the system is an average of 89.48% with the smallest similarity value of 67%.
4. Conclusion
References
-
[1] Aditya, M., & Witanti, N. (2009). Penilaian Esai Jawaban Bahasa Indonesia Menggunakan Metode SVM - LSA. Journal of Information Systems, Volume 5, Issues 1 , p 33-41.
-
[2] M. E. Sulistyo, R. Saptono, and A. Asshidiq, “Penilaian ujian bertipe essay menggunakan metode text similarity,” Telematika, vol. 12, no. 2, 2015.
-
[3] R. E. Febrita and W. F. Mahmudy, “Pre-processed latent semantic analysis for automatic essay grading,” Jurnal Ilmiah Kursor, pp. 175–180, 2017.
-
[4] N. N. Widyastuti, A. A. Bijaksana, and I. L. Sardi, “Analisis word2vec untuk perhitungan kesamaan semantik antar kata,” eProceedings of En-gineering, vol. 5, no. 3, 2
468
Discussion and feedback