Symbolic Adoption Model of Local Government Management Information System
on
Jurnal Ilmiah Akuntansi dan Bisnis
Vol. 17 No. 1, January 2022

AFFILIATION:
1,2,3 Faculty of Economics and Business, Universitas Udayana, Indonesia
*CORRESPONDENCE:
THIS ARTICLE IS AVAILABLE IN:
DOI:
10.24843/JIAB.2022.v17.i01.p06
CITATION:
Suaryana, I G. N. A., Noviari, N., Damayanthi, I G. A. E. (2022).
Symbolic Adoption Model of Local
Government Management Information System. Jurnal Ilmiah
Akuntansi dan Bisnis, 17(1), 84-101
ARTICLE HISTORY
Received:
30 April 2021
Revised:
13 October 2021
Accepted:
22 November 2021
Symbolic Adoption Model of Local Government Management Information System
I Gusti Ngurah Agung Suaryana1*, Naniek Noviari2, I Gusti Ayu Eka Damayanthi3
Abstract
The purpose of this research is to create an acceptance model for the implementation of the Local Government Management Information System (LGMIS) financial application in the Denpasar City Government. In this study, the population consisted of all RAOs in the Denpasar City Government, a total of 36 RAOs and selected using saturated sampling methods and sampling of respondents was done by purposive sampling. SEM-PLS statistical analysis was used in this study. The findings of hypothesis testing show that information quality, system quality, management commitment, personal innovativeness, and computer selfefficacy have no effect on LGMIS's perceived usefulness. Personal innovativeness and computer self-efficacy have a positive effect on the perceived ease of use of the LGMIS. Ease of use has a positive effect on the financial LGMIS perceived usefulness. This study also proves that perceived ease of use and perceived usefulness have a positive effect on financial LGMIS symbolic adoption.
Keywords: regional management information system, technology
acceptance model, symbolic adoption.
Introduction
Information systems become strategic resources in organizations. The use of fast, precise, and accurate information systems aims to increase organizational efficiency and effectiveness. This encourages organizations to build information systems resources. Development of information system resources is not only carried out in private organizations, but also in government organizations. The development of information systems in government organizations aims to support activities carried out to increase the efficiency and effectiveness of activities. Information systems are expected to become strategic resources in government organizations so that it is only natural to place them as important resources on a par with other resources, such as financial resources, human resources, time resources, and other resources (Lusianto et al., 2015). Information systems play an important role in various functions in government organizations in Indonesia, including financial management
functions from the central level to the regional level. The important role of information systems in the financial management of government organizations is indicated by the Government Number 65 of 2010 on the amendment to Government Regulation Number 56 of 2005 concerning regional financial information systems.
The development of a financial information system in the context of financial management in local governments is carried out by developing a Regional Management Information System (LGMIS). LGMIS products that have been developed include the application program for Financial LGMIS, Regional Property of LGMIS (BMD), Salary of LGMIS, and Income of LGMIS. The LGMIS application program developed has been implemented in 425 local governments out of 542 existing local governments or as much as 78.41% as of September 2015.
Research on acceptance of LGMIS implementation has been conducted by several researchers to determine the determining factors for its successful implementation in local governments. Critical factors for the successful implementation of LGMIS, such as the quality of input data and the level of user understanding (Alfian, 2016), performance expectations (Anisa & Ananda, 2019), legal foundations, the availability of facilities and infrastructure (Hertanto et al., 2017), technological characteristics, individual characteristics, and organizational characteristics (Mubarokah et al., 2017), superior commitment, quality of human resources, and system integration (Kewas et al., 2019), performance expectations, business expectations, social factors, conditions which facilitates the use and training (Nugraha & Yadnyana, 2018), superior communication, human resource support, attitudes to accept information systems, and organizational structure (Pilat et al., 2016).
This study re-examines the determinants of the success of the implementation of the financial LGMIS application. This research was conducted because it was reported that there were obstacles in its implementation in the regional government, such as the uneven ability to operate the LGMIS financial application in every government unit so that some users chose to use a manual system in financial management (Alfian, 2016). Complicated data input and poor internet network quality (Andriyanto et al., 2019; Fettry et al., 2017; Kewas et al., 2019), users feel that they have not benefited and feel burdened in implementing the application The financial LGMIS (Mubarokah et al., 2017), users think that their superiors are not very supportive of the implementation of the LGMIS financial application (Kewas et al., 2019), there is no document flow chart document and an inadequate data management system (Dewi & Mariska, 2018). These constraints need to be considered in implementing the financial LGMIS application by local governments.
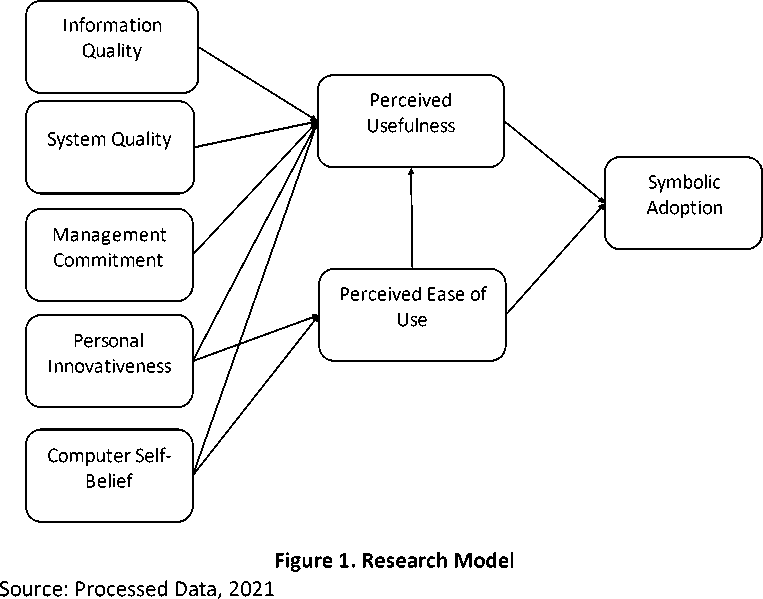
This research model refers to the Technology Acceptance Model (Davis, 1989) which has been adapted to enterprise system acceptance research (Nah et al., 2004), and the acceptance of financial LGMIS applications, such as Andriyanto et al. (2019) and Mubarokah et al. (2017). The consideration of applying the technology acceptance model (TAM) as a theoretical basis for examining the acceptance of the financial LGMIS application is the suitability of TAM as a technology acceptance model to describe the various constraints and factors considered by users of the financial LGMIS application in local governments with adjustments and expansion.
TAM explains that system acceptability is explained by perceived usefulness, and perceived ease of use. This study adds several external factors to explain perceived usefulness and perceived ease of use, namely technological characteristics, institutional
or organizational characteristics, individual characteristics, and social influences according to Andriyanto et al. (2019). The characteristics of technology consist of information quality and system quality. Personal characteristics consist of computer selfefficacy and personal innovativeness. Institutional characteristics are indicated by management commitment. This study replaces the behavioral intention variable with symbolic adoption, which refers to the research of Mubarokah et al. (2017) and Nah et al. (2004) because the implementation of the financial LGMIS is mandatory.
This research is expected to formulate a model of acceptance for the application of financial area management information systems. This research is useful in knowing the level of financial LGMIS adoption in Denpasar City and the factors that are considered by users in the adoption of financial LGMIS. The financial LGMIS is a system that must be implemented by local governments. The success of implementing the financial LGMIS is highly dependent on institutional factors, individual factors, and technological factors.
LGMIS finance is an integrated information system that aims to provide information needs for local governments in regional financial management. Implementation of financial LGMIS by local governments is based on Government Regulation No.56 of 2005 on Regional Financial Information Systems (Indonesian Government Regulations No. 56 Regional Financial Information System, 2005) that local governments are obliged to adopt an information system in managing regional finances and presenting information to the public. The management information system adopted by local governments in Indonesia to manage local finances is LGMIS finance.
The financial LGMIS was built by the Government Financial Supervisory Agency (BPKP). BPKP issued LGMIS 2.7 which has been adjusted to regulations related to financial management, such as Government Accounting Standards (SAP) (Indonesian Government Regulation No. 71 Government Accounting Standards (SAP), 2010) and Application of Accrual-Based Government Accounting Standards in Local Governments (Indonesian Minister of Home Affairs Regulation No. 64 Application of Accrual-Based Government Accounting Standards in Local Governments, 2013). The LGMIS Finance application aims to assist the government in integrated regional financial management, including budgeting, administration, accounting and reporting. The output of budgeting includes Budget Work Plans (RKA), Regional Revenue and Expenditure Budget Plans (RAPBD) and Regional Revenue and Expenditure Budget Elaboration Plans (APBD), APBD and Elaboration of APBD and its amendments, and Administration Output Budget Implementation Documents (DPA), including Funds Provision Letter (SPD), Payment Request Letter (SPP), Payment Order Letter (SPM), SPJ, Fund Disbursement Order (SP2D), Certificate of Deposit (STS), along with registers, and other budget control forms . Accounting and reporting output, including journals, ledgers, auxiliary books, financial reports (budget realization reports, cash flow reports and balance sheets), accountability regulations and their description.
TAM is a model used to analyze the factors considered by users to receive information systems (Davis, 1985). Davis (1985) developed TAM based on the principles of behavioral paradigms in psychology discussed in Fishbein & Ajzen (1975). TAM continues to be revised from earlier models, such as Venkatesh et al. (2003). The final model was proposed by Fred D. Davis & Venkatesh (1996). The three factors that explain system use are perceived usefulness, perceived easy to use, and behavioral intention.
Perceptions of usefulness and perceived ease of use are important determinants of system use based on theoretical perspectives, such as expectancy theory, self-efficacy theory; behavioral decision theory, diffusion of innovations, marketing, and humancomputer interaction (Davis, 1989).
This study examines the factors that users consider in using financial LGMIS. The model referred to is the TAM (Davis & Venkatesh, 1996) which has been adapted to the conditions of implementing LGMIS Finance in local governments. This study replaces the behavioral intention variable of using information systems in TAM with symbolic adoption because the LGMIS application is implemented in a mandatory environment (Karahanna, 1999; Mubarokah et al., 2017; Nah et al., 2004; Rawstorne et al., 1998; Virdyananto et al., 2017). because the implementation of the financial LGMIS is mandatory. Symbolic adoption is a reflection of the peak motivational state of the user's mental evaluation of technology and its use as a valuable concept (Nah et al., 2004). In a mandatory environment, symbolic adoption occurs before actual adoption and it can influence users to accept and use technology (Nah et al., 2004).
External variables are extended into individual characteristics, institutional characteristics, and information technology characteristics. Expansion of external variables based on various constraints identified when implementing LGMIS Finance in local governments. The characteristics of technology consist of information quality and system quality. Personal characteristics consist of computer self-efficacy and personal innovativeness. Institutional characteristics are indicated by management commitment.
Perceptions of information quality describe user perceptions of the output quality of an information system (DeLone & McLean, 1992). The quality of information is an important thing that is considered by users of information systems. The quality of
information produced by information systems will affect the use and satisfaction of users of information systems (DeLone & McLean, 1992). System quality measures the quality of information processing (DeLone & McLean, 1992). The quality of information systems affects the use and satisfaction of users of information systems individually and thus influences the organization (DeLone & McLean, 1992).
The successful model of implementing DeLone & McLean (1992) information systems combined with TAM (Davis, 1985) to examine the effect of system quality and information quality on perceived usefulness was researched by (Andriyanto et al., 2019). The results of the study prove that the quality of information and the quality of the system affects the perceived usefulness of the system. The better the user's perception of information quality and system quality, the better the user's perception of the usefulness of the new information system.
H1: The quality of information has a positive effect on the perceived usefulness of the Financial LGMIS
H2: System quality has a positive effect on the perceived usefulness of the Financial LGMIS
Management commitment is an institutional factor that affects the use of information technology (Lewis et al., 2003). Management commitment as an institutional factor influences individual cognition and behaviour, including processes of significance, legitimacy, and domination. The significance process means that individuals use information to understand and form beliefs about the use of new technologies adopted by the organization (Orlikowski, 1992). The process of legitimacy is indicated by the news provided by top management about organizational legitimacy, beliefs, and actions. The process of domination describes an organizational situation that regulates individual beliefs (Hartono, 2008). The stronger the management commitment, the higher the user's perception of the use of the new system (Andriyanto et al., 2019).
H3: Management commitment has a positive effect on the perceived usefulness of the Financial LGMIS
Personal Innovativeness (KI) is an individual's willingness to try new technologies (Agarwal & Prasad, 1999). Personal interest in the technology domain is called PITT (PI in the domain of information technology). Innovative individuals will seek to apply new technology by seeking information from mass media and personal relationships. Individuals who have a high level of personal innocence will be able to gain confidence in using new technology. High trust will increase the perceived usefulness and perceived ease of using new information technology (Andriyanto et al., 2019; Lu et al., 2005). H4: Personal inexistence has a positive effect on the perceived usefulness of LGMIS H5: Personal identity has a positive effect on the perceived ease of use of the Financial LGMIS
Self-belief is a person's assessment of one's own ability to take the necessary actions to achieve their goals (Bandura, 1977). Confidence itself is a person's opinion about what can be done with the skills he has. Self-belief computers can be defined as someone's assumption of the ability / capability and expertise he has in using computers. Computer self-belief affects the perceived usefulness and perceived ease of use of new information systems. A person's high confidence in their ability to use computers will increase the perception of the usefulness of the system and the perception of the ease of use of the new system (Andriyanto et al., 2019).
H6: Computer self-belief has a positive effect on the perceived usefulness of the Financial LGMIS
-
H7: Computer self-belief has a positive effect on the perceived ease of use of the Financial LGMIS
The relationship between perceived ease and perceived ease refers to TAM. TAM was introduced by Fred D. Davis (1985) which aims to explain the determinants of computer acceptance. TAM explains two variables that explain two beliefs, namely perceived usefulness and perceived ease of use that are relevant to computer acceptance behavior. Perceived ease of use shows the level that users expect on the system with no effort (Davis, 1989). Perceptions of the use of the user expectation probability level that the use of the system will improve its performance in an organizational context (Davis, 1989). TAM explains that perceived ease of use affects perceived usefulness. Users who have confidence that LGMIS is easy to use will increase user confidence in using LGMIS and will be able to improve its performance in an organizational context.
-
H8: Perceived ease of use has a positive effect on the perceived usefulness of LGMIS
This study modifies TAM, namely behavioral interest with symbolic adoption. Behavioral interest is seen as inappropriate to explain the application of information systems in a mandatory environment (Nah et al., 2004). Symbolic adoption is a person's mental acceptance of an innovation, different from actual adoption which refers to the actual use of technology. Symbolic adoption is one's acceptance of a new information system prior to actual adoption, and is a necessary but insufficient condition for actual adoption in a voluntary context (Karahanna, 1999). In mandatory environments, people tend to display differences in symbolic adoption of the new system (Rawstorne et al., 1998). Symbolic adoption analysis will be useful in the application of new information systems in a mandatory environment. Two variables that influence symbolic adoption are perceived ease of use and perceived usefulness (Karahanna, 1999; Nah et al., 2004). Karahanna (1999) and Nah et al. (2004) provide empirical support for the effect of perceived ease of use and perceived usefulness on symbolic additions.
-
H9: Perceived ease of use has a positive effect on symbolic adoption H10: Perceived usefulness has a positive effect on symbolic adoption
Research Method
Research location in regional apparatus organization (RAO) in Denpasar City. Types of research variables, including independent, mediator, and dependent variables. The independent variables of the study were information quality (KI), system quality (KS), management commitment (KM), personal innovativeness (KP), and computer selfconfidence (KSK). The mediator variables of this study were perceived ease of use (PKP) and perceived usefulness (PK). The research dependent variable is symbolic adoption (AS).
Information quality is a measure of the quality of information generated from information systems, especially in the form of reports (DeLone & McLean, 1992). Information quality is measured by completeness, precision, reliability, current, and report format (Iivari, 2005). System quality measures the quality of information system technology (DeLone & McLean, 1992). System quality is measured by system flexibility, system integration, response time, error correction, access convenience, and language (Iivari, 2005). Management commitment shows the level of importance of other people
seeing the use of technology as something useful and has a positive influence on its use, so that colleagues, superiors, or other social actors believe that technology is useful (Andriyanto et al., 2019). Individuals who are innovative are if they adopt an innovativeness earlier (Andriyanto et al., 2019). The characteristics of innovative individuals will have confidence in using new technology based on information from a number of channels and mass media and interpersonal relationships. Individuals who have high innovativeness have more positive beliefs about technology (Mubarokah et al., 2017). Computer self-belief is an assessment of the ability, capability and expertise possessed by individuals to use computers. Computer self-belief is an assumption about what can be done with the skills it has (Andriyanto et al., 2019).
The perception of ease of use is the user's perception that the information systems can minimize an effort in both labor and time. Users believe the system or technology used is easy to understand (Andriyanto et al., 2019). Perceived usability is the level of user confidence that information systems can improve performance. Perceived usefulness is strongly influenced by external variables and perceived ease of use (Davis, 1989). Symbolic adoption is a person's mental acceptance of an innovation (Nah et al., 2004). One tends to show differences in symbolic adoption, especially in understanding the acceptance of technology in a mandatory environment.
The population in this study were all Regional Work Units (RAO) in Denpasar City Government, amounting to 36 RAOs. The unit of research analysis is the civil servants at RAO Denpasar City. The samples selected were only those related to the RAO financial reporting process. Sampling of respondents was done by purposive sampling. The criteria set on respondents include (a) Employees who carry out accounting / financial administration functions at RAO, (b) Respondents are determined by cluster sampling as many as three respondents which include RAO expenditure treasurers, RAO financial administration officials, and assistant financial administration officials. RAO.
The sample in this study were 36 people consisting of financial administration officials in Denpasar City Government. The data collection methods used in this study were survey methods and non-participant observation. Survey method through distributing questionnaires. The form of the questionnaire used is using a Likert scale where the respondent only needs to give a sign or fill in a predetermined scale value.
The statistical analysis used in this study was SEM-PLS. The advantage of this analysis is that the analysis is that the data does not have to be normally distributed multivariate and the sample does not have to be large. The reasons for using PLS are (1) PLS is a general method for estimating the path model using latent variables with multiple indicators; (2) PLS is an analysis method for causal predictive analysis in situations of high complexity and low theory support; (3) PLS handles reflective and formative models, even constructs with a single indicator (Ghozali, 2011).
Result and Discussion
This research was conducted at RAO in Denpasar City Government. Respondents in this study were the Head of Agency / Head of Agency and Head of Sub Division of finance in each RAO. Data were collected by distributing questionnaires sent directly by researchers to all DPOs. The questionnaires distributed to the respondents were 36 questionnaires. After confirmation has been made, it was found that all the
questionnaires returned as many as 36 questionnaires. So, overall the questionnaire can be used well.
The demographic characteristics of respondents in this study are the profiles of the 36 respondents who filled out this questionnaire. The characteristics of these respondents include gender, age, and length of work in government agencies presented in Table 1.
This study applies PLS as an analytical tool. PLS analysis includes measurement model analysis and structural model analysis. Analysis of measurement models, including analysis of the validity and reliability of each research variable. Structural model analysis includes analysis of model validity and path coefficient.
Analysis of the measurement model consists of testing the validity and reliability of the instrument (Hartono, 2011). The validity test assesses the ability of research instruments to measure what should be measured (Cooper & Schindler, 2002). Reliability test measures the consistency of measuring instruments or research instruments (Hartono, 2011).
The validity test includes the construct validity test, which is to assess the suitability of a measurement with the theories used to define the construct (Hartono, 2011). Testing construct validity includes convergent validity and discriminant validity.
Table 1. Demographics of Respondents
|
Criteria |
Number of Respondents |
|
Gender | |
|
Male |
20 |
|
Female |
16 |
|
Age (years) | |
|
30 - 40 |
3 |
|
41 - 45 |
1 |
|
46 – 50 |
13 |
|
>51 |
10 |
|
Tenure (years) | |
|
0 – 5 |
11 |
|
5 – 10 |
19 |
|
10 - 15 |
4 |
|
>15 |
3 |
|
Educational Background | |
|
Economics |
29 |
|
Tourism Science |
1 |
|
Agricultural Science |
1 |
|
Law |
2 |
|
Computer Science |
1 |
|
Social and Political Science |
1 |
|
Others |
1 |
Source: Processed Data, 2021
Table 2. Results of Convergent Validity Testing with Outer Loading
|
Indicator |
Outer Loading |
Average Variance Extracted (AVE) |
Composite Reliability |
Cronbach’s Alpha |
Explanation |
|
AS1 |
0.926 | ||||
|
AS2 |
0.893 |
Valid and | |||
|
0.753 |
0.923 |
0.885 | |||
|
AS3 |
0.756 |
Reliable | |||
|
AS4 |
0.963 | ||||
|
KI1 |
0.723 | ||||
|
KI2 |
0.951 |
Valid and | |||
|
0.819 |
0.947 |
0.922 | |||
|
KI3 |
0.950 |
Reliable | |||
|
KI4 |
0.974 | ||||
|
KM1 |
0.868 | ||||
|
KM2 |
0.866 |
Valid and | |||
|
0.740 |
0.919 |
0.822 | |||
|
KM3 |
0.889 |
Reliable | |||
|
KM4 |
0.816 | ||||
|
KP1 |
0.857 | ||||
|
Valid and | |||||
|
KP2 |
0.846 |
0.777 |
0.913 |
0.856 | |
|
Reliable | |||||
|
KP3 |
0.939 | ||||
|
KS1 |
0.980 | ||||
|
KS2 |
0.754 | ||||
|
KS3 |
0.937 |
Valid and | |||
|
0.742 |
0.945 |
0.928 | |||
|
KS4 |
0.797 |
Reliable | |||
|
KS5 |
0.850 | ||||
|
KS6 |
0.829 | ||||
|
KSK1 |
0.711 | ||||
|
KSK2 |
0.943 | ||||
|
KSK3 |
0.887 | ||||
|
Valid and | |||||
|
KSK4 |
0.944 |
0.776 |
0.960 |
0.950 | |
|
Reliable | |||||
|
KSK5 |
0.972 | ||||
|
KSK6 |
0.778 | ||||
|
KSK7 |
0.901 | ||||
|
PK1 |
0.794 | ||||
|
PK2 |
0.785 |
Valid and | |||
|
0.681 |
0.895 |
0.843 | |||
|
PK3 |
0.865 |
Reliable | |||
|
PK4 |
0.854 | ||||
|
PKP1 |
0.859 | ||||
|
PKP2 |
0.883 |
Valid and | |||
|
0.726 |
0.914 |
0.874 | |||
|
PKP3 |
0.809 |
Reliable | |||
|
PKP4 |
0.855 |
Information: KI: information quality, KS: system quality, KM: management commitment, KP: personal innovativeness, CIC: computer self-belief, PK: perceived usefulness, PKP: perceived ease of use, AS: symbolic adoption.
Source: Processed Data, 2021
Convergent validity measures the inter-gauge correlation of the construct.
Convergent validity is measured by factor loading (correlation between component scores and construct scores). PLS measures convergent validity with outer loading and
average variance extracted (AVE) scores. The measuring item is declared valid if the outer loading score must be greater than 0.7 and the average variance extracted (AVE) is greater than 0.5 (Chin, 1995). The results of the convergent validity test are presented in Table 2.
Table 2. presents outer loading, which is the correlation between the scores for each component and the construct scores. The outer loading value in Table 2. is all greater than 0.7, so it can be concluded that all components are valid. Table 3. presents the results of the validity test with average variance extracted (AVE). Each variable has an AVE value greater than 0.5 (Chin, 1995), so it is declared valid.
PLS tested the validity of discrimination by Cross loading. The rule of thumb used is the cross loading score in one variable is greater than 0.7 (Chin, 1995). The results of the discriminant validity test are presented in Table 2. The reliability test in PLS uses two methods, namely Cronbach's alpha and composite reliability. Cronbach's neglect measures the lower limit of the reliability value of one construct, while composite reliability measures the real value of the reliability of one construct (Chin, 1995). The value of Cronbach's negligence and minimum composite reliability is 0.7 (Hair et al., 2009).
The structural model in PLS is evaluated using the coefficient of determination (R2) for the dependent construct, the value of the path coefficient (path) or the t statistic value for the path setup. The value of R2 measures the level of variation in the change in the variable against the dependent variable. The higher the R2 value, the better the predictive model of the proposed research model. The validity of the model was measured using the total determination coefficient (R2total). The total coefficient of determination (R2total) is the coefficient of determination of all endogenous variables with the following formula: R2total = 1 – (1-R21).(1-R22)
Table 3. presents the coefficient of determination coefficient of each endogenous variable of the study. R21 = 0.611, R22 = 0.444, dan R23 = 0.541 respectively are the value of determination of the endogenous variable symbolic adoption (AS), perceived usefulness (PK), and perceived ease of use (PKP).
R2total = 1 – (1-0.611).(1-0.444).(1-0.332)= 0.857
The total coefficient of determination (R2 total) is 0.762, which means that the information contained in the data is 85.7% can be explained by the analysis model of the relationship between variables, while the remaining 14.3% is by other factors not included in this study. The path coefficient value or inner model shows the level of significance in testing the hypothesis. The results of the path coefficient analysis are presented in and Table 4.
Table 4. shows the results of hypothesis testing. The first research hypothesis (H1), second hypothesis (H2), third hypothesis (H3), fourth hypothesis (H4), sixth
Table 3. Coefficient of Determination
|
Endogenous Variables |
R Square |
Adjusted R Square |
|
AS |
0.611 |
0.599 |
|
PK |
0.444 |
0.332 |
|
PKP |
0.341 |
0.232 |
Description: PK: perceived usefulness, PKP: perceived ease of use, AS: symbolic adoption. Source: Processed Data, 2021
Table 4. Path Coefficient Test Results
|
Path Coefficient |
t statistik |
p values |
Result | |
|
KI -> PK |
0.267 |
1.335 |
0.183 |
H1 not significant |
|
KS -> PK |
0.124 |
0.478 |
0.633 |
H2 not significant |
|
KM -> PK |
0.033 |
0.208 |
0.835 |
H3 not significant |
|
KP -> PK |
0.040 |
0.441 |
0.659 |
H4 not significant |
|
KP -> PKP |
0.355 |
2.192 |
0.029* |
H5 significant |
|
KSK -> PK |
0.248 |
1.446 |
0.149 |
H6 not significant |
|
KSK -> PKP |
0.624 |
3.664 |
0.000* |
H7 significant |
|
PKP -> PK |
0.294 |
2.020 |
0.044* |
H8 significant |
|
PKP -> AS |
0.359 |
2.042 |
0.042* |
H9 significant |
|
PK -> AS |
0.555 |
3.253 |
0.001* |
H10 significant |
Information: KI: information quality, KS: system quality, KM: management commitment, KP: personal innovativeness, KSK: computer self-belief, PK: perceived usefulness, PKP: perceived ease of use, AS: symbolic adoption.
*: significant at 0.05.
Source: Processed Data, 2021
hypothesis (H6) is rejected. The testing results of each hypothesis have p value greater than α of 0.05, which information quality (KI), system quality (KS), management commitment (KM), personal innovativeness (KP) and computer self-belief (KSK) does not have a significant effect on perceived usefulness (PK).
The results of hypothesis testing in Table 4. show the path coefficient of personal innovativeness (KP) on the perceived ease of use (PKP) of the financial LGMIS of 0.355, the t value of 2.192 and the p value of 0.029. The p value of 0.029 is smaller than α of 0.05, which means that personal information (KP) has a positive and significant effect on perceived ease of use (PKP). The same result was also obtained from testing the seventh hypothesis (H7). The path coefficient of the influence of computer selfconfidence (KSK) on the perception of ease of use (PKP) in LGMIS finance is 0.624, the p value is 0.000 which means that computer self-confidence (KSK) has a positive and significant effect on perceived ease of use (PKP). The results of testing the eighth hypothesis (H8) prove that the perceived ease of use (PKP) has a positive effect on the perception of usability (PK) in LGMIS. The results of testing the ninth hypothesis (H9) and tenth hypothesis (H10) shows that perceptions of ease of use (PKP) have a positive effect on symbolic adoption (AS). Perceived usefulness (PK) has a positive effect on symbolic adoption (AS). The results of hypothesis testing in Table 9 show the path coefficient of the effect of perceived usefulness (PK) on symbolic adoption (AS) of 0.555, the t value of 3.253 and the p value of 0.001. The p value of 0.001 is smaller than α of 0.05, which means that perceived usefulness (PK) and perceived usefulness (PK) have a positive effect on symbolic adoption (AS).
The results of testing the first hypothesis (H1) indicate that the quality of information (KI) has no positive effect on perceived benefits (PK) of LGMIS Finance. The results of this study do not support previous research which found that information quality affects perceptions of usefulness (Andriyanto et al., 2019; Kartika et al., 2016; Laksono, 2017; Saeed & Abdinnour-Helm, 2008). The results of this study support Sari et
al. (2016); Suhendro (2016). The quality of information does not affect the perception of benefits, meaning that the quality of information produced by LGMIS Finance is not considered by users in making decisions in the Denpasar City Government. Users do not pay attention to indicators of information quality, such as completeness of information, precision of information, reliability of information, and timeliness of presentation of information. This happens because users have been able to get complete, reliable, precise, timely information and compliance with applicable regulations in a low frequency of use, so users do not need to use it repeatedly (Sari et al., 2016).
The quality of the system (KS) has no positive effect on the perception of the benefits (PK) of LGMIS Finance. The results of this study do not support the research of Istianingsih & Wijanto (2008); Seddon & Kiew (1996) who found that the better the quality of the system, the higher the perceived usefulness of the system. The results of this study support Putrawan et al. (2017); Sari et al. (2016); Zai & Dewi (2014) who found that system quality had no effect on perceptions of the usefulness of information systems. The quality of the system and the quality of information do not affect the perception of the usefulness of the system, presumably because application users in each RAO are required to use the financial LGMIS application regardless of the quality of the system provided by the LGMIS application. The LGMIS application was developed by the State Financial Supervisory Agency (BPKP) which did not involve local financial LGMIS users in developing the LGMIS application. Based on the distribution of respondents' answers about the quality of the LGMIS financial system, most users think that the financial LGMIS has a good system quality, but some users rate the information quality and the quality of the LGMIS financial system. These results corroborate the notion that the development of financial LGMIS does not involve application users in the regions. Another reason is the lack of reliability of financial LGMIS and system errors still often occur so that individuals feel reluctant to use it because of concerns that data may be deleted when a system error occurs and individuals who use SIPKD at that time will be blamed (Sari et al., 2016).
Management commitment (KM) has no positive effect on perceived benefits (PK) of LGMIS Finance. The results of this study are not in line with the research of Andriyanto et al. (2019); Rahayu (2012); Thong et al. (1996). The results of this study support Alfian (2016) who found that management commitment has no effect on perceptions of LGMIS financial benefits. Management support is not required in a mandatory system implementation environment. Lu et al. (2005); Rahayu (2012); Thong et al. (1996) examined the success of implementing information systems in a nonmandatory environment, because users are not required by regulations to use an information system. In contrast, Alfian (2016) examines the application of financial LGMIS that must be applied to all local governments in Indonesia. Financial LGMIS must be implemented based on government regulations. The implementation of mandatory information systems requires less management commitment because regulations as the basis for implementation are more binding on users to implement financial LGMIS.
The results of testing the fourth hypothesis (H4) prove that personal creativity (KP) does not have a positive effect on perceived usefulness (PK) in LGMIS. The results of this study are not in line with the research of Andriyanto et al. (2019); Lu et al. (2005). The results of the study prove that personal innovation (KP) is not an important factor in implementing Financial LGMIS. The implementation of LGMIS does not require a high level of personal information to increase the user's perception of the benefits of the
system. Users of the system that must be implemented will perceive the system to be useful to comply with applicable regulations.
Personal innovativeness (KP) has a positive effect on the perceived ease of use (PKP) of LGMIS Finance. The results of this study support Andriyanto et al. (2019); Lewis et al. (2003); Mao et al. (2005); Srite et al. (2008); Thompson et al. (2006) found that personal innovativeness has a direct effect on perceived usefulness and perceived ease of use. Srite et al. (2008) suggested that an individual who is more innovative will be better able to see alternative ways of using technology and be better able to identify the application uses of technology.
The results of testing the sixth hypothesis (H6) prove that computer selfconfidence (KSK) has no positive effect on perceptions of the benefits of Financial LGMIS. Computer self-confidence is defined as an assessment of a person's capabilities and expertise to perform tasks related to information technology. This study proves that a person's high self-confidence in carrying out tasks related to information technology does not affect a person's perception of the benefits of the system used. The results of this study are not in line with the research of Andriyanto et al. (2019). The different results are due to the fact that in the implementation of the mandatory system, the perception of the benefits of system users is not influenced by the user's assessment of the capabilities and expertise possessed in carrying out tasks related to information technology. Users will find the system useful in complying with applicable regulations, even though users have a low assessment of the ability and ability to use information technology.
Computer self-belief (KSK) has a positive effect on the perceived ease of use (PKP) of LGMIS Finance. Users who have high confidence The results of Darsono (2005) show that self-confidence in computers affects perceived ease of use and on interest in using a new system. This finding is consistent with the findings of Hong et al. (2001), Lewis et al. (2003), and supported by Hasan (2007) who found that self-belief in computers has a positive effect on ease of use. Research by Hasan (2007); Srite et al. (2008); Thompson et al. (2006) also found that self-confidence in computers influenced perceived ease of use. Other findings from Hasan (2007); Srite et al. (2008) stated that self-belief in computers showed a positive influence on perceived usefulness.
Self-confidence in computers influences perceived ease of use. The path coefficient indicates a positive direction. This means that there is a unidirectional relationship between self-belief in computers and perceived ease of use, that is, the higher self-confidence in computing, the higher the perceived ease of use is grown. These results indicate that self-confidence in computers plays a key role in fostering perceptions of ease of use, because having the ability to use computers will make using AIS easier. This finding supports the research results of Darsono (2005); Hasan (2007); Hong et al. (2001); Lewis et al. (2003); Srite et al. (2008); Thompson et al. (2006). The results of descriptive analysis show that the users of the financial LGMIS application have perceived ease of use. This is supported by the fact that most of their education status is at the formal level of education related to the use of SIA, enabling users of the LGMIS financial application to have sufficient knowledge and understanding of LGMIS, so that they feel confident that it will be easy to use LGMIS in carrying out their duties.
The results of testing the eighth hypothesis (H8) prove that the perceived ease of use (PKP) has a positive effect on the perception of usability (PK) in LGMIS. The results of
this study provide empirical support for TAM (Davis, 1985). Users who have confidence that LGMIS is easy to use will increase user confidence in using LGMIS and will be able to improve its performance in an organizational context.
The results of testing the ninth hypothesis (H9) perceived ease of use (PKP) have a positive effect on symbolic adoption (AS). The results of testing the tenth hypothesis (H10). Perceived usefulness (PK) has a positive effect on symbolic adoption (AS). The results of this study provide empirical support for previous studies, such as Karahanna (1999); Nah et al. (2004). Perceived ease of use and perceived usefulness increase user acceptance of financial LGMIS before LGMIS is actually adopted.
Conclusion
The financial LGMIS is a system that must be implemented by local governments as regulated in Government Number 65 of 2010 concerning amendments to Government Regulation Number 56 of 2005 concerning regional financial information systems. However, some problems are still found in its implementation in the local government. This study found several important determinants in the adoption of LGMIS. This study found that computer self-belief has an effect on perceptions of the use of financial LGMIS. The self-belief of the computer is an individual factor for LGMIS users. The higher the user's confidence in their ability to use the computer, the higher the confidence the user can easily use the LGMIS application. This study proves empirically the effect of perceived ease of use on perceptions of the use of financial LGMIS. Users who have confidence that LGMIS is easy to use will increase user confidence in using LGMIS and will be able to improve its performance in an organizational context. Finally, perceived ease of use and perceived usefulness influence symbolic adoption of financial LGMIS. Perceived ease of use and perceived usefulness increase user acceptance of financial LGMIS before LGMIS is actually adopted. Analysis of symbolic adoption is important when an organization implements a mandatory application, so that it can be seen the acceptance of financial LGMIS users in the organization.
This study did not find that users' perceptions of information quality, system quality, management commitment, and personal innovativeness did not influence perceptions of the use of financial LGMIS. This may occur because the financial LGMIS is an application that must be implemented by local governments, so that information quality, system quality, management commitment, and personal inference are less considered by users in implementing LGMIS applications to improve user performance.
Several problems were found in implementing the financial LGMIS application in the regions. This study provides several suggestions in smoothing the implementation of the financial LGMIS application. First, the selection of a financial LGMIS application operator needs to consider the user's interest in computer use. The results of this study found that individual user factors, namely computer self-belief affect the ease of use of financial LGMIS. Second, perceptions of ease of use and perceptions of use influence the adoption of financial LGMIS before it is actually implemented in regional organizations. These results have implications for the efforts that need to be made by management in the regions in order to improve perceptions of ease of use and perceptions of use. Several attempts to improve the perceived ease of use and perception of use applied in this research model, among others, were to improve information quality, system quality, and management commitment, which failed to increase the perceived ease of use and
perception of the use of financial LGMIS. This may be because the financial LGMIS was developed without involving users and government management in the regions.
References
Agarwal, R., & Prasad, J. (1999). Are individual differences germane to the acceptance of new information technologies? Decision Sciences, 30(2), 361–391.
https://doi.org/10.1111/j.1540-5915.1999.tb01614.x
Alfian, M. (2016). Faktor Pendukung Implemetasi SIMDA dan Pengaruhnya Terhadap Kualitas Laporan Keuangan pada SKPD Kabupaten Kulon Progo. Jurnal Ekonomi Dan Bisnis, 18(3), 119. https://doi.org/10.24914/jeb.v18i3.277
Andriyanto, D., Baridwan, Z., & Subekti, I. (2019). Determinan penggunaan sistem akuntansi pemerintah desa: Analisis keperilakuan menggunakan UTAUT. Jurnal Ekonomi Dan Bisnis, 22(2), 313-344. https://doi.org/10.24914/jeb.v22i2.2459
Anisa, F., & Ananda, F. (2019). Pengaruh Performance Expectancy Terhadap Minat Implementasi Sistem Pengelolaan Keuangan Daerah (SIPKD) di Pemkot Padang. Jurnal Benefita, 4(1), 137–145. https://doi.org/10.22216/jbe.v1i1.3858
Bandura, A. (1977). Self-efficacy: Toward a unifying theory of behavioral change.
Psychological Review, 84(2), 191–215. https://doi.org/10.1037/0033-295X.84.2.191
Chin, W. W. (1995). Partial Least Squares is to LISREL as Principal Components Analysis is to Common Factor Analysis. Technology Studies, 2, 315–319.
Cooper, D. R., & Schindler, P. S. (2002). Business research methods 8th Edition. McGraw-Hill.
Darsono, L. I. (2005). Examining Information Technology Acceptance by Individual Professionals. Gadjah Mada International Journal of Business, 7(2), 155–178. https://doi.org/10.22146/gamaijb.5576
Davis, F. D. (1985). A technology acceptance model for empirically testing new end-user information systems: Theory and results. Massachusetts Institute of Technology, Sloan School of Management.
Davis, F. D. (1989). Perceived usefulness, perceived ease of use, and user acceptance of information technology. MIS Quarterly: Management Information Systems, 13(3), 319–339. https://doi.org/10.2307/249008
Davis, F. D., & Venkatesh, V. (1996). A critical assessment of potential measurement biases in the technology acceptance model: Three experiments. International Journal of Human Computer Studies. https://doi.org/10.1006/ijhc.1996.0040
DeLone, W. H., & McLean, E. R. (1992). Information systems success: The quest for the dependent variable. Information Systems Research, 64(42), 823–824.
https://doi.org/10.1287/isre.3.1.60
DEWI, N. C., & MARISKA, S. (2018). Analisis Penerapan Sistem Informasi Manajemen Daerah (SIMDA) Keuangan Pada Pemerintahan Kota Pariaman. Al-Masraf: Jurnal Lembaga Keuangan Dan Perbankan, 3(1), 63–70.
Fettry, S., Lusanjaya, G. R., & Rahayu, P. A. (2017). Implementasi Aplikasi Sistem Informasi Manajemen Desa (Simda Desa): Studi Kasus Pada Desa di Kecamatan Cilengkrang. Profesionalisme Akuntan Menuju Sustainable Business Practice -Universitas Widyatama, 142–147.
Fishbein, M., & Ajzen, I. (1975). Chapter 1. Belief, Attitude, Intention, and Behavior: An
Introduction to Theory and Research. In Reading, MA: Addison-Wesley.
Ghozali, I. (2011). Structural Equation Modeling Metode Alternatif dengan Partial Least Square. Badan Penerbit Universitas Diponegoro.
Hair, J., Black, W., Babin, B., & Anderson, R. (2009). Multivariate Data Analysis. Prentice Hall.
Hartono, J. (2008). Sistem Informasi Keperilakuan Edisi Revisi. Yogyakarta: CV. Andi Offse.
Hartono, J. (2011). Metode Penelitian Bisnis: Salah Kaprah dan Pengalaman-Pengalaman. Yogyakarta: BPFE.
Hasan, B. (2007). Examining the effects of computer self-efficacy and system complexity on technology acceptance. Information Resources Management Journal, 20(3), 76– 88. https://doi.org/10.4018/irmj.2007070106
Hertanto, Y., Domai, T., & Amin, F. (2017). Penerapan Sistem Informasi Manajemen Daerah (Simda) Keuangan Terhadap Efektivitas Pelaporan Keuangan (Studi pada Badan Pengelolaan Keuangan dan Aset Daerah Di Kabupaten Blitar). Publisia: Jurnal Ilmu Administrasi Publik, 1(2), 15–24. https://doi.org/10.26905/pjiap.v2i1.1424
Hong, W., Thong, J. Y. L., Wong, W. M., & Tam, K. Y. (2001). Determinants of user acceptance of digital libraries: An empirical examination of individual differences and system characteristics. Journal of Management Information Systems, 18(3), 97–124. https://doi.org/10.1080/07421222.2002.11045692
Iivari, J. (2005). An Empirical Test of the DeLone-McLean Model of Information System Success. Data Base for Advances in Information Systems, 6(2), 8–27. https://doi.org/10.1145/1066149.1066152
Indonesian Government Regulations No. 56 Regional Financial Information System, (2005).
Indonesian Government Regulation No. 71 Government Accounting Standards (SAP), (2010).
Indonesian Minister of Home Affairs Regulation No. 64 Application of Accrual-Based Government Accounting Standards in Local Governments, (2013).
Istianingsih, & Wijanto, S. (2008). Pengaruh Kualitas Sistem Informasi, Kualitas Informasi, dan Kegunaan terhadap Kepuasan Pengguna Software Akuntansi. Nasional Akuntansi IX.
Karahanna, E. (1999). Symbolic adoption of information technology. International Decision Sciences Institute.
Kartika, N. D., Anton, & Adnanti, W. A. (2016). Analisis Kualitas Sistem Informasi, Perceived Usefulness dan Kualitas Informasi Terhadap Kepuasan End User Software Akuntansi. Simposium Nasional Akuntansi XIX, 1–21.
Kewas, A. M., Karamoy, H., & Lambey, L. (2019). Analisis Kendala Pengimplementasian Pendapatan pada SIMDA Keuangan di Pemerintah Provinsi Sulawesi Utara. Jurnal Riset Akuntansi Dan Auditing “Goodwill,” 10(2), 108–122. https://doi.org/10.35800/jjs.v10i2.25598
Laksono, H. (2017). Kabupaten Grobogan Menggunakan Model. Jurnal Tata Kelola & Akuntabilitas Keuangan Negara, 3(2), 151–167. https://doi.org/10.28986/jtaken.v3i2.101
Lewis, W., Agarwal, R., & Sambamurthy, V. (2003). Sources of influence on beliefs about information technology use: An empirical study of knowledge workers. MIS
Quarterly: Management Information Systems, 27(4), 657–678. https://doi.org/10.2307/30036552
Lu, J., Yao, J. E., & Yu, C. S. (2005). Personal innovativeness, social influences and adoption of wireless Internet services via mobile technology. Journal of Strategic Information Systems, 14, 245–268. https://doi.org/10.1016/j.jsis.2005.07.003
Lusianto, Y. U., Nugroho, E., & Nugroho, H. A. (2015). Model Evaluasi Pemanfaatan Sistem Informasi Manajemen Daerah (SIMDA) Keuangan Terhadap Efektivitas Penyerapan Anggaran. CITEE, 66–71.
Mao, E., Srite, M., Thatcher, J. B., & Yaprak, O. (2005). A research model for mobile phone service behaviors: Empirical validation in the U.S. and Turkey. Journal of Global Information Technology Management, 8(4), 7–28.
https://doi.org/10.1080/1097198X.2005.10856406
Mubarokah, T., I. Santosa, P., & A. Nugroho, H. (2017). Studi Awal Analisis Penerimaan SIMDA versi 2.7 serta Dampaknya Terhadap Pengguna (Studi: Pemerintah Provinsi Kalimantan Tengah). Prosiding Seminar Nasional ReTII Ke-10 2015, 681–687.
Nah, F. F. H., Tan, X., & Teh, S. H. (2004). An empirical investigation on end-users’ acceptance of enterprise systems. Information Resources Management Journal, 17(3), 32–53. https://doi.org/10.4018/irmj.2004070103
Nugraha, G. S., & Yadnyana, K. (2018). Penerapan Model UTAUT dalam Menjelaskan Faktor Minat dan Penggunaan Sistem Informasi Manajemen Daerah. E-Jurnal Akuntansi, 24(2), 959–987. https://doi.org/10.24843/EJA.2018.v24.i02.p06
Orlikowski, W. J. (1992). The Duality of Technology: Rethinking the Concept of Technology in Organizations. Organization Science, 2(3), 398–427. https://doi.org/10.1287/orsc.3.3.398
Pilat, J. J., Sondakh, J. J., & Manossoh, H. (2016). Analisis Penerapan Sistem Informasi Manajemen Daerah (SIMDA) Keuangan Dalam Pengelolaan Keuangan Daerah Pemerintah Kota Manado. Jurnal ACCOUNTABILITY, 5(2), 72–83.
https://doi.org/10.32400/ja.14426.5.2.2016.72-83
Putrawan, N. A., Putri, I. G. A. M. A. D., & Ariyanto, D. (2017). Analisis Efektivitas Sistem Informasi Manajemen Daerah (SIMDA) Pemerintah Kabupaten Gianyar. E-Jurnal Ekonomi Dan Bisnis Universitas Udayana, 6(4), 1639–1672.
Rahayu, S. K. (2012). the Factors That Support the Implementation of Accounting Information System: a Survey in Bandung and Jakarta’S Taxpayer Offices. Journal of Global Management, 4(1).
Rawstorne, P., Jayasuriya, R., & Caputi, P. (1998). An integrative model of information systems use in mandatory environments. Proceedings of the International Conference on Information Systems, ICIS 1998.
Saeed, K. A., & Abdinnour-Helm, S. (2008). Examining the effects of information system characteristics and perceived usefulness on post adoption usage of information systems. Information and Management, 45, 376–386.
https://doi.org/10.1016/j.im.2008.06.002
Sari, D. C., Rosidi, & Roekhudin. (2016). Determinan Penggunaan Sistem Informasi Pengelolaan Keuangan Daerah dan Pengaruhnya terhadap Ketepatan Waktu Pelaporan Keuangan SKPD. Journal of Research and Applications: Accounting and Management, 2(1), 17. https://doi.org/10.18382/jraam.v2i1.69
Seddon, P., & Kiew, M.-Y. (1996). A Partial Test and Development of Delone and
Mclean’s Model of IS Success. Australasian Journal of Information Systems, 4(1), 90–109. https://doi.org/10.3127/ajis.v4i1.379
Srite, M., Bennett, J., & Galy, E. (2008). Does within-culture variation matter? An empirical study of computer usage. Journal of Global Information Management, 16(1), 1-25. https://doi.org/10.4018/jgim.2008010101
Suhendro, D. (2016). Pengaruh Kualitas Sistem, Kualitas Informasi, Kualitas Pelayanan Dan Ekspektasi Kinerja Terhadap Kepuasan Pengguna Dalam Penerapan Sistem Teknologi Informasi Pada Koperasi Di Kota Pematangsiantar. Jurasik (Jurnal Riset Sistem Informasi Dan Teknik Informatika), 1(1), 33–40. https://doi.org/10.30645/jurasik.v1i1.6
Thompson, R., Compeau, D., & Higgins, C. (2006). Intentions to use information technologies: An integrative model. Journal of Organizational and End User Computing, 18(3), 25–46. https://doi.org/10.4018/joeuc.2006070102
Thong, J. Y. L., Yap, C. S., & Raman, K. S. (1996). Top Management Support, External Expertise and Information Systems Implementation in Small Businesses.
Information Systems Research, 7(2), 248–267. https://doi.org/10.1287/isre.7.2.248
Venkatesh, V., Morris, M. G., Davis, G. B., & Davis, F. D. (2003). User acceptance of information technology: Toward a unified view. MIS Quarterly: Management Information Systems, 27(3), 425–478. https://doi.org/10.2307/30036540
Virdyananto, A. L., Dewi, M. A. A., Hidayanto, A. N., & Hanief, S. (2017). User acceptance of human resource information system: An integration model of Unified Theory of Acceptance and Use of Technology (UTAUT), Task Technology Fit (TTF), and Symbolic Adoption. 2016 International Conference on Information Technology Systems and Innovation, ICITSI 2016 - Proceedings. https://doi.org/10.1109/ICITSI.2016.7858227
Zai, S. P., & Dewi, A. F. (2014). Pengaruh Pentingnya Sistem, Kualitas Sistem Dan Kualitas Informasi Terhadap Kegunaan Dan Kepuasan Pengguna Dalam Pengembangan Sistem Informasi AkuntansI (Studi kasus di RSUP Dr. Soeradji Tirtonegoro Klaten). E Jurnal Ekonomi Akuntansi UAJY, 1–13.
Jurnal Ilmiah Akuntansi dan Bisnis, 2022 | 101
Discussion and feedback