Moderation of Financial Constraints in Transfer Pricing Aggressiveness, Income Smoothing, and Managerial Ability to Avoid Taxation
on
Jurnal Ilmiah Akuntansi dan Bisnis
Vol. 16 No. 2, July 2021

AFFILIATION:
1Direktorat Jenderal Pajak
2Politeknik Keuangan Negara STAN
*CORRESPONDENCE:
THIS ARTICLE IS AVAILABLE IN:
DOI:
10.24843/JIAB.2021.v16.i02.p07
CITATION:
Aristyatama, H. A., & Bandiyono, A. (2021). Transfer Pricing Aggressiveness, Income Smoothing, and Managerial Ability to Avoid Taxation. Jurnal Ilmiah Akuntansi dan Bisnis, 16(2), 279-297.
ARTICLE HISTORY Received:
03 December 2020
Revised:
22 February
Accepted:
29 May 2021
Moderation of Financial Constraints in Transfer Pricing Aggressiveness, Income Smoothing, and Managerial Ability to Avoid Taxation
Hanung Adittya Aristyatama1, Agus Bandiyono2*
Abstract
This study examines the effect of transfer pricing aggressiveness, income smoothing, and managerial ability in tax avoidance with financial constraints as a moderating variable. The samples were manufacturing companies listed on the Indonesia Stock Exchange in 2015 to 2018. The study analyzed a form of panel data with a fixed-effect model approach. The result was transfer pricing aggressiveness and income smoothing had positives effects on tax avoidance. Managerial ability reduces tax avoidance, while financial constraints did not. Furthermore, financial constraints did not moderate the effects of transfer pricing aggressiveness on tax avoidance. Financial constraints strengthened the positive effects of income smoothing and the negative effects of managerial ability on tax avoidance. This study provides input to the tax authorities in formulating policies, as well as input for risk analysis on tax potential.
Keywords: transfer pricing aggressiveness, income smoothing, managerial ability, financial constraints, tax avoidance
Introduction
Taxes play an important role in the sustainability of national development which is being promoted massively by the government of the Republic of Indonesia during the presidency of President Joko Widodo. However, in a period of almost a decade, the realization of tax revenue has never reached the target that has been set and even experienced the lowest achievement of only 83% in 2015 and 2016. Likewise, Indonesia's tax ratio is stagnant at 10-12%, more low compared to countries in the ASEAN region that have an economic size that is relatively similar to Indonesia, such as Malaysia (13.8%), Singapore (14.3%), the Philippines (13.7%), Thailand (15.7%), even Cambodia (15.3%) (Media Keuangan, 2019).
Slemrod (2007) states that one of the causes of low tax revenue is the existence of a tax gap which is the difference between the tax that should be paid and the amount paid. Meanwhile, according to Cobham (2005) tax evasion and tax avoidance cause total losses in developing countries to reach the US $ 385 billion. This also occurs in Indonesia
as the OECD Economic Survey Report (2018) states that the tax evasion rate in Indonesia is classified as high, causing low tax revenues and indicating non-compliance by taxpayers manifested in the practice of tax evasion and avoidance. Therefore, tax avoidance is important to object to being an object of research concerning its relationship with tax revenue.
Tax avoidance is the ability to pay a lower amount of tax compared to profit before tax through a series of management actions by reducing income tax through tax planning activities (Dyreng et al., 2008; Chen et al., 2010; Frank et al., 2009; Hanlon & Slemrod, 2009; Richardson et al., 2013). Meanwhile, according to Hanlon & Heitzman (2010), it is revealed that there is an influence of management/corporate governance on corporate tax avoidance decisions.
One of the factors that influence tax avoidance is transfer pricing aggressiveness. Transfer pricing aggressiveness is a form of the main tax avoidance scheme carried out by companies to achieve their goals of maximizing profits and minimizing tax payments globally (Gravelle, 2009; Pendse, 2012; Janský & Prats, 2013). Testing of the effect of transfer pricing on tax avoidance has been carried out several times, but there is still a research gap as in Taylor & Richardson (2012) and Amidu et al. (2019) which states that transfer pricing aggressiveness has a significant positive effect on tax avoidance while different results are disclosed by Panjalusman et al. (2018) and Falbo & Firmansyah (2018) who state that transfer pricing aggressions do not affect tax avoidance.
Another factor that affects tax avoidance is income smoothing. Several studies suggest that the main instrument used in earnings management can be through income smoothing, changes in accounting procedures, taking a bath, income maximization (Healy & Wahlen, 1999). Frank et al. (2009) define earnings management as management's effort to increase or decrease accounting profit in a way that does not violate or violate generally accepted financial accounting principles or rules. Regarding income smoothing, Fonseca & González (2008) state that managers use artificial smoothing and real smoothing to reduce earnings volatility. Meanwhile, research that has been conducted so far has examined the effect of earnings management on tax avoidance (Martani, D., & Kamila, 2014; Wang, S. dan Chen, 2012; Desai & Dharmapala, 2009) and the effect of income smoothing on firm value (Huang et al., 2009).
The test using income smoothing and tax avoidance has been carried out by Akbari et al. (2019) which states that income smoothing is a conscious action taken by managers to change company income so that it will affect the company's taxable income. Likewise with Ciconte et al. (2014) revealed the effect of income smoothing on the relationship between tax avoidance and firm value. In Indonesia, there has not been much testing of the direct effect of income smoothing on tax avoidance.
Next, the factor that affects tax avoidance is managerial ability. Managerial ability is a manager's ability to make efficient to generate income to realize the company's goal of maximizing profits (Demerjian et al., 2012). Research related to managerial ability has been carried out by, among others, Francis et al. (2013) and Park et al. (2016) who stated that managerial ability has a significant negative impact on tax avoidance. However, in contrast to Koester et al. (2017) which states that managerial abilities have a significant positive impact on tax avoidance because managers who have high skills tend to have extensive knowledge so that they take advantage of all available opportunities to take tax avoidance actions. In Indonesia, there are not many studies that directly link it to tax
avoidance. The existence of a research gap and not many tests that examine the effect of managerial ability on tax avoidance in Indonesia has encouraged the author to conduct this research.
Furthermore, the Covid-19 pandemic has had a significant impact not only on public health but also on economic aspects. The impact on the economic sector is shown by statements from various countries experiencing a recession, such as the United States, Germany, France, England, Singapore, Japan, and many others (Jihad Akbar, 2020). In developing countries, this condition can lead to a reversal of capital flows from developing countries so that it has an impact on the liquidity conditions of developing countries (Azka, 2018). Liquidity problems can result in banks tightening their lending policies and raising credit interest rates, which can make it difficult for companies to invest. Poor economic performance can affect the decline in business profits which are a source of financing so that it can cause financial constraints that can hold companies back from investing and doing business expansion (Bank Indonesia, 2009).
Financial constraints is a company condition that experiences problems regarding the limitations of its company's cash. Chen & Lai (2012) reveal that companies experiencing financial constraints tend to save cash by engaging in tax avoidance practices that aim to increase investment in the future. Previous research that discussed the effect of financial constraints on tax avoidance was conducted by Edwards et al. (2012) which shows that financial constraints have a positive effect on tax avoidance by reducing tax payments in cash which in fact can increase the operating cash flow of companies experiencing financial constraints. However, it is different from the research of Bayar et al. (2018) which states that financial constraints do not have a significant effect on tax avoidance actions by companies with good governance.
In Indonesia, there are not many studies conducted to examine the effect of financial constraints on tax avoidance. One of the results of research conducted by Firmansyah & Bayuaji (2019) states that companies experiencing financial constraints tend to practice tax aggressiveness because companies will use tax management as a way to increase internal funding when the company has limited funding.
The previous research that examined the effect of financial constraints on managerial ability was carried out by Mahdavi & Saberi (2016) which stated that there was a significant influence between financial constraints on managerial ability. Meanwhile, research on the relationship of financial constraints to transfer pricing aggressiveness and income smoothing has not been widely carried out, but on the basis that in previous studies each of these variables is known to have a relationship with tax avoidance and with the current issue regarding the threat of a global recession. can result in financial constraints so that the authors are interested in making financial constraints as a moderating variable in the relationship of transfer pricing aggressiveness, income smoothing, and managerial ability to tax avoidance.
Based on agency theory, there is a conflict of interest from the manager as an agent which makes the basis for managers to make decisions that are often different from the interests of the principal. When a company decides whether to invest at home or abroad, it will consider profits, tariff rates, tax laws, and regulations to achieve the goal of minimizing taxes globally and maximizing profits by taking advantage of the benefits of low tax rates and tax-free policies from the host country (Bartelsman & Beetsma, 2003; Olibe & Rezaee, 2008; Borkowski, 2010). To achieve maximum global profit and the goal
of minimizing these taxes, multinational companies can use several mechanisms for tax avoidance by shifting taxable income from high to low tax jurisdictions. Mechanisms that can be done are through transfer pricing, thin capitalization, the use of the tax haven country, and affiliate financing structures (Grubert & Mutti, 1991; Dharmapala, 2008; Gravelle, 2009; Janský, P., Prats & Aid, 2013; Plesner Rossing & Rohde, 2014). Transactions between related parties located in different tax jurisdictions provide ample opportunities for tax evasion. Therefore, it can be concluded that activities that transfer pricing aggressively can influence tax avoidance actions taken by companies in a positive direction. Based on the explanation above, the first hypothesis in this study is: H1: Transfer pricing aggressiveness has a positive effect on tax avoidance
Based on agency theory, managers as agents often have interests that are different from those of the principal so that the background for differences in taking one of the decisions related to accounting policies or financial reporting. Then, with not many studies examining the direct effect of income smoothing and tax avoidance, the research approach is associated with the effect of earnings management on tax avoidance because income smoothing is one of the main instruments of earnings management (Healy & Wahlen, 1999; Fonseca & González, 2008). Erickson et al. (2005) stated that some companies with higher accounting earnings reports are also willing to pay more taxes. This shows that there is still a trade-off between tax and financial reporting. The size of the book-tax difference indicates that tax avoidance and earnings management practices are carried out simultaneously (Graham et al. 2005) Therefore, it can be concluded that the level of income smoothing of a company can influence tax avoidance actions taken by the company in a positive direction. Based on the explanation above, the second hypothesis in this study is:
H2: Income smoothing has a positive effect on tax avoidance
According to theory agency, managers as agents often have interests that are different from those of the principal so that the background for differences in decision making is one of which is related to the company's resource management policy. One of the recent studies by Akbari et al. (2019) is a study of 130 companies from 2004 to 2015 that are listed on the Tehran Exchange, with the conclusion that managerial ability harms tax avoidance so that it can be interpreted that the higher the ability of managers to carry out efficiency in company resources, the level of tax avoidance being carried out becomes Getting lower. This is supported by the research of Park et al. (2016) and Francis et al. (2013) which revealed that managerial ability has a significant negative effect on tax avoidance. Therefore, it can be concluded that the level of ability of company managers can influence tax avoidance actions taken by the company in a negative direction. Based on the explanation above, the third hypothesis in this study is: H3: Managerial ability has a negative effect on tax avoidance
Following theory agency, there is a conflict of interest from managers as agents that make the basis for managers to make decisions that are often different in the interest of the principal. Chen & Lai (2012) reveal that when a company is experiencing financial constraints, the availability of operating cash flow is crucial so that the company has more incentives to produce higher operating cash flow by avoiding taxes. Edwards et al. (2016) support this by revealing that companies experiencing financial constraints will try their best to use internal funding sources by trying to reduce costs, one of which is tax costs because tax costs are considered not to affect company performance in the long term.
Therefore, it can be concluded that the financial constraints of a company can influence tax avoidance actions by the company in a positive direction. Based on the explanation above, the fourth hypothesis in this study is:
H4: Financial constraints have a positive effect on tax avoidance.
Based on positive accounting theory, one of the hypotheses that cause opportunistic actions of management to deviate (agency problem) is the political cost hypothesis. In the political cost hypothesis, the government is the principal while the manager is the agent. As stated by Edwards et al. (2016) the company will make cash savings on tax payments when there are financial constraints. This is what motivates managers to take action tax avoidance through transfer pricing aggressiveness. Therefore, it can be concluded that the financial constraints of a company will moderate the positive effect of aggressiveness transfer pricing on corporate tax avoidance in a strengthening direction. Based on the explanation above, the fifth hypothesis in this study is:
H5: Financial constraints will strengthen the positive effect of transfer pricing aggressiveness on tax avoidance.
Based on positive accounting theory, one of the hypotheses that cause deviant opportunistic management behavior (agency problem) is the political cost hypothesis. In the political cost hypothesis, the government is the principal while the manager is the agent. Managers as agents have the motivation to deviate by minimizing political costs paid to the government as the principal, such as minimizing taxes through tax avoidance. As stated by Chen & Lai (2012), by engaging in aggressive tax avoidance practices, companies that experience limited funding will save more cash efficiently. This is what motivates managers to take tax avoidance through income smoothing because when companies experience financial constraints, managers will have more motivation to minimize tax costs (political cost) utilizing one of them through income smoothing. Therefore, it can be concluded that the financial constraints of a company will moderate the positive effect of the level of income smoothing on corporate tax avoidance in a strengthening direction. Based on the explanation above, the sixth hypothesis in this study is:
H6: Financial constraints will strengthen the positive effect of income smoothing on tax avoidance
Based on positive accounting theory, one of the hypotheses that cause opportunistic management behavior is deviating (agency problem) is the political cost hypothesis. In the political cost hypothesis, the government is the principal while the manager is the agent. Managers as agents have the motivation to deviate by minimizing political costs paid to the government as the principal, such as minimizing taxes through tax avoidance. As stated by Edwards et al. (2012) that companies experiencing funding limitations will try to increase internal sources of funding through tax planning. Initially, the managerial ability which has a negative effect on tax avoidance is weakened due to financial constraints that force managers to take actions opportunistic to avoid tax. Therefore, it can be concluded that the financial constraints of a company will moderate the negative influence of level managerial ability on corporate tax avoidance in a weakening direction. Based on the explanation above, the seventh hypothesis in this study is:
H7: Financial constraints will weaken the negative influence of managerial ability on tax avoidance
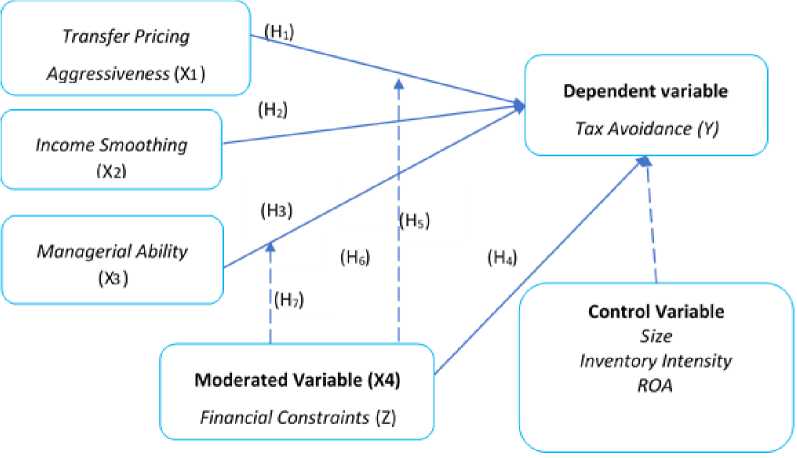
Figure 1. Research Model
Source: Processed Data, 2020
With these considerations, this research is expected to provide input to the tax authorities in formulating policies as well as materials for risk analysis in exploring tax potential.
Research Method
This study uses quantitative methods to process and analyze data. The analysis is carried out using statistical procedures and analysis so that it can be seen whether or not there is a significant influence between the independent variable on the dependent variable and how the effect of the moderating variable on the relationship between the independent variable and the dependent variable. The type of data used in this study is secondary data and is panel data (time series and cross-section).
The data was obtained from the IDX, of period 2015 to 2018. The selection of the manufacturing sector as a population is due to the sector having the most dominant number compared to the total number of listed companies. The number of manufacturing companies listed on the IDX as of 31 December 2018 was 162 companies. The sample selection was carried out by purposive sampling by eliminating companies that had the following criteria: Companies that conducted an initial public offering (IPO) after January 1, 2016; Companies that did not have complete data during the 2015-2018 period; Companies that use foreign currency in their financial reporting; Companies that always experience losses during the 2015 to 2018 period.
Tax Avoidance measured by D_D BTD (Book Tax Different) suggested by Desai & Dharmapala (2006). The reason for using this proxy is because it is considered conceptually more reasonable by removing the unrelated part of tax avoidance from BTD and can identify BTD resulting from tax avoidance. Besides, this proxy is considered to be able to relatively present objectivity because it measures tax avoidance using disclosed accounting information. In the BTD calculation, the estimated taxable income is proxied
Table 1. Research Sample
Criteria Number
of manufacturing companies listed on the IDX as of 31/12 2018162
Elimination:
Manufacturing companies listed on the IDX starting or after 2015(28)
Manufacturing companies that use currency foreigners in their financial (26) reporting
Companies that have negative pretax book income/ losses consecutively(9)
during the observation period 2015 - 2018
Manufacturing companies that do not have complete data(5)
Number of companies used in the study94
Number of years (2015 - 2018)4
Source: Processed data from www.idx.go.id, 2020
by non-actual fiscal year income as developed by Park et al. (2016) and Kang & Ko (2014). With the following equation:
BTD / ASSETt-1 = α0 + α1 TA / ASSETt-1 + ɛ (1)
Description:
BTD : pre-tax income - estimated taxable income (estimated taxable income
tax burden / corporate tax rate)
TA : total accruals (net income - operating cash flow)
ASSETS : total assets
ɛ : tax avoidance, which will then use the TAXAVOID proxy.
Measurement of transfer pricing aggressiveness is carried out using an index as research conducted by Richardson et al. (2013b). The approach is a sum-score used to determine the index by adding up the seven indicators taken from the company's financial reports and annual reports. Each item is given a score of 1 if any and 0 otherwise, then the result is divided by seven. The indicators include: The existence of debt/receivables from related parties without interest; The existence of debt/receivables from related parties that have been released; The existence of debt/receivables from related parties that have been imported; The existence of non-monetary liabilities between the related parties; Absence formal documents regarding the method transfer pricing used; The existence of long-term assets released from related parties without commercial justification; There is no justification for fair transactions between related parties.
Income smoothing is measured using an index developed by Eckel (1981). Coefficient Variation (CV) variable income and variable net sales are used as research conducted by Akbari et al. (2019) with the following formula:
CV ∆I
Eckel Index= .......................................................... (2)
CV ∆S
Information:
CV ΔI: profit growth rate; the standard deviation of net income for the current period and the previous period divided by the average net income for the current period and the previous period.
CV ΔS: the rate of sales growth; the standard deviation of net sales for the current and previous periods divided by the average net income for the current and prior periods.
If the result is <1 then the company does income smoothing and vice versa if it is> 1 then the company does not do income smoothing.
Managerial ability is measured using the model of Demerjian et al. (2012). The measurement is carried out in two stages, the first stage using DEA as a proxy for the efficiency limit of the company by considering the number of each company and the combination of resources that are calculated in the same industry category. The efficiency limit is one, if the farther from the efficient limit, the lower the efficiency level. Efficiency is measured in the same year and industry with the following DEA model:
maxθ=
SALES
(3)
v1COGS+v2SGNA+v3PPE+v4INTAN
Description:
SALES : sales
COGS : cost of goods sold
SGNA : selling, administrative, and general expenses
PPE : fixed assets
INTAN : intangible asset
The second stage is to find the residual (managerial) value ability) from the Tobit regression to the DEA score and the company's characteristic factors using the model:
FE = β + β SIZEit+ β MSit + β3FCit +β4AGEit + ∑φYEARit+ε .................... (6)
Description:
FE : The company's efficiency score is based on measurement DEA
SIZE : Natural logarithm of total assets
MS : Company revenue I divided by total industry revenue per year
FCF : variable Dummy, given a value of 1 if free cash flow > 0, and a value of 0 if
otherwise
AGE : Natural logarithm of length (year) of listing company on the Indonesia Stock
Exchange at the end of year t
Ε : value managerial ability, then marked with the code ABILITYSCORE
Financial Constraints measured using the index approach Whited & Wu (2006) which also used by Chen & Lai (2012), and Edwards et al. (2012). The WW index can be calculated as follows:
FC i,t = - 0.091 x (Cash Flows / TA) - 0.062 x (1 if dv> 0, 0 if dv = 0) + 0.021 x (LTD / TA) -
0.044 x ln TA - 0.035 x SG ................................................................................... (7)
Description:
FC i, t : Financial Constraints
TA : Total Assetst
Dv : Dividend paidt
LTD : Total Long Term Debtt
SG : (Salest - Salest-1) / Salest-1
With interpretation, if the FC I, t score is greater, the higher the level of financial constraints experienced by the company.
Next, to ensure that other factors do not affect the influence of the independent variable on the dependent variable, the control variable included size, inventory intensity, and return on assets is. Size is measured in the manner stated in Taylor & Richardson (2012), namely the natural logarithm (ln) of total assets with full rupiah value. Inventory Intensity is measured in the manner stated in Taylor & Richardson (2012) namely the total inventory for a year divided by the total asset value in the previous year. Return on assets is measured in the manner stated in Richardson & Lanis (2007), namely pre-tax profit divided by total assets of the previous year.
This study uses the dependent variable tax avoidance (TAXAVOID) which is measured using the D_D BTD proxy. The independent variable in this study is transfer pricing aggressiveness (TPA) as measured by the approach sum score, income smoothing (IN SMOOTH) with Eckel index, and managerial ability (ABILITYSCORE) with a Tobit regression of the DEA score. The moderating variable financial constraints (FC) is measured by Whited & Wu (2006) indices and the control variables are size (SIZE), inventory intensity (INVENT), and return on assets (ROA). To analyze hypotheses one through hypothesis four, model 1 is used as follows:
TAXAVOIDit= β +β TPAit+β INSMOOTHit+β ABILITYSCOREit+β FCit+β SIZEit+
β INVINTit+ β ROAit+ε ...................................................................... (8)
Furthermore, to analyze hypothesis five to hypothesis seven, model 2 is used as follows: TAXAVOIDit=β +β TPAit+β INSMOOTHit+β ABILITYSCOREit+β FCit+β TPA*FCit+ β INSMOOTHit*FCit+ β ABILITYSCOREit*FCit+β SIZEit+β INVINT+ β10ROA + ε ......................................................................................... (9)
|
Description: | |
|
TAXAVOIDit |
: Tax avoidance |
|
TPAit |
: Transfer pricing aggressiveness |
|
INSMOOTHit |
: Income smoothing |
|
ABILITYSCOREit |
: Managerial ability |
|
FCit |
: Financial Constraints |
|
SIZEit |
: Size |
|
INVINTit |
: Inventory intensity |
|
ROAit |
: Return on assets |
|
β0it |
: Constants |
|
ɛ |
: Error |
Result and Discussion
The results of the sample selection are 94 manufacturing companies that meet the predetermined selection criteria. The test period used is 2015-2018 so that 376 companyyear data are obtained. Furthermore, the data were tested to determine the panel data regression model used as well as the classical assumption test and continued with hypothesis testing. Based on the results of the model selection test as shown in Table 2., the selected model is the model Fixed Effect (FE). Likewise, with the results of the classical assumption test, the data is considered feasible for further analysis.
|
Testing |
Common Effect |
Random Effect |
Fixed Effect | |
|
1 |
Lagrange Multiplier Test |
✓ | ||
|
2 |
Chow Test |
✓ | ||
|
3 |
Hausman Test |
✓ | ||
|
Selected Model |
✓ |
Source: Processed Data, 2020
The statistical analysis aims to present a description of the data so that it can be processed more easily understood and analyzed as this study can provide an overview of the size of the distribution and concentration of data.
The maximum value Tax Avoidance (TAXAVOID) obtained by the company is 0.191372, while the minimum value is -0, 324876 with a standard deviation of 0.042262 with a mean (TAXAVOID) of -1.72E-18 with a median of 0.003194. TAXAVOID value indicates the level of company aggressiveness in tax avoidance.
The average Transfer Pricing Aggressiveness (TPA) was 0.409195 with a median of 0.428571. The amount of TPA value can illustrate the aggressiveness in setting transfer prices between related parties. The maximum value of TPA obtained by the company is 0.71428571 while the minimum value is 0.1428571 with a standard deviation of 0.117127.
Variable Income Smoothing (IN SMOOTH) is measured using the index developed by Eckel (1981) with the interpretation that if the result is less than 1 (one) then the company performs income smoothing, whereas if the result is more than 1 (one) then the company is considered not doing income smoothing. Furthermore, a score of dummy 1 is given to companies that do income smoothing and 0 to companies that do not do income smoothing. Income Smoothing (IN SMOOTH) in this study has an average of 0.497340 with a median of 0. The maximum value of IN SMOOTH is 1, the minimum value is 0 and the standard deviation is 0.500659.
The variable managerial ability (ABILITY SCORE) has an average value that shows positive results (2.24E-16). This illustrates that the average manager has a good ability to make efficiency on input in the form of company resources to produce output in the form of sales. Then related to the maximum score during the study period was 0.2410167 in 2015 and the minimum value was -0.5762933
The average value of the variable financial constraints (FC)was -0.642946 with a median value of -0.636434. The value of FC shows the financial constraints experienced by the company. Meanwhile, the maximum value of FC is -0.433101 and the minimum value is -0.895342 and the variation of the FC variable is indicated by the standard deviation value of 0.089994.
Table 3. Descriptive Statistics Research
|
Variable |
N |
Mean |
Median |
Maximum |
Minimum |
Std. Dev |
|
TAXAVOID |
376 |
<-0.001 |
0.003 |
0.191 |
-0.325 |
0.042 |
|
TPA |
376 |
0.409 |
0.429 |
0.714 |
0.143 |
0.117 |
|
INSMOOTH |
376 |
0.497 |
0.000 |
1.000 |
0.000 |
0.501 |
|
ABILITYSCORE |
376 |
<0.001 |
-0.003 |
0.241 |
-0.576 |
0.118 |
|
FC |
376 |
-0.642 |
-0.636 |
-0.433 |
-0.895 |
0.090 |
|
SIZE |
376 |
28.369 |
28.125 |
33.474 |
25.216 |
1.580 |
|
ROA |
376 |
0.088 |
0.068 |
0.782 |
-0.374 |
0.126 |
|
INVINT |
376 |
1.234 |
0.172 |
44.987 |
0.000 |
4.506 |
Source: Processed data, 2020
Table 4. F-Test Results
|
No |
Dependent |
Variable Independent Variable |
value Prob> α |
Conclusion |
|
1 |
TAXAVOID |
TPA + INSMOOTH + ABILITYSCORE + FC |
0.000 |
Simultaneous |
|
TPA + INSMOOTH + | ||||
|
2 |
TAXAVOID |
ABILITYSCORE + FC + TPA * FC + INSMOOTH * FC + ABILITYSCORE * FC |
0.000 |
Simultaneous |
Source: Data processed, 2020
While the descriptive statistics for the control variable are as follows: SIZE has an average value of 28.36901 and a median of 28.12462, with a maximum value of 33.47372 and a minimum value of 25.21557 with a standard deviation of 1.58031; INVINT has an average value of 1.23463 and a median of 0.17248, with a maximum value of 44.98694 and a minimum value of 0 with a standard deviation of 4.50641; ROA has an average value of 0.08898 and a median of 0.06779, with a maximum value of 0.78241 and a minimum value of -0.37404 with a standard deviation of 0.12647.
The F statistical test aims to test the effect of independent variables simultaneously on the dependent variable. A good regression model is a regression model in which the independent variables are jointly or simultaneously to the dependent variable.
The test results based on Table 3. show that the F-statistical probability value is significant (<0.05) which is equal to 0.00000 in both model 1 and model 2. These results indicate that Ho is rejected which means that all the independent variables in the study jointly (simultaneously) affect the dependent variable.
The partial significance test (t-test) aims to test the effect of each independent variable (partial) on the dependent variable. The test is done by observing the probability value (p-value) for each variable so that it can then be compared with the level of significance specified in this study.
Based on the results of t-test Model 1, it can be concluded that H1, H2, and H3 are accepted while H4 is rejected. H1, H2, and H3 are accepted because the probability value is smaller than 0.05 and has the appropriate coefficient value, while H4 is rejected because the probability value is greater than 0.05.
Conclusions based on the results of the t-test Model 2, it is concluded, H5 and H7 are rejected, while H6 is accepted. H5 is rejected because the probability is more than 0.05; H6is accepted because the probability is less than 0.05 and the FC * INSMOOTH coefficient
Table 5. T-Test Results Model 1
|
Variable |
Estimates |
Coefficient |
Two-tailed Prob. |
One-tailed Prob. |
Information |
|
TPA |
+ |
0.18414 |
0.01100 |
0.00550 |
accepted |
|
SMOOTH |
+ |
0.002592 |
0.00250 |
0.00125 |
accepted |
|
ABILITYSCORE |
- |
-0.024496 |
0.09510 |
0.04755 |
accepted |
|
FC |
+ |
-0.052170 |
0, 12090 |
0.06045 |
rejected |
Source: Processed data, 2020
Table 6. T-Test Results Model 2
|
Variable |
Estimated |
Coefficient |
One-tailed Prob. |
Description |
|
FC |
- |
-0.124 |
0.083 |
- |
|
FC *landfill |
Strengthen |
0.124 |
0.288 |
Rejected |
|
FC *INSMOOTH |
Strengthen |
0.035 |
- |
Accepted |
|
FC * ABILITYSCORE |
Weakening |
-0.541 |
- |
Rejected |
Source: Data processed, 2020
value is greater than IN SMOOTH; H7 is rejected because the FC * ABILITYSCORE coefficient value is smaller than ABILITYSCORE even though the probability value is less than 0.05.
The results of the tests conducted show that transfer pricing aggressiveness has a positive effect on tax avoidance. This is in line with the results of research by Taylor & Richardson (2012), Rego (2005), and Amidu et al. (2019) which state that transfer pricing aggressiveness has a significant positive effect on tax avoidance. These results indicate that the higher the aggressiveness transfer pricing of a company, the higher the level of tax avoidance.
However, it is different from previous research conducted in Indonesia by Falbo & Firmansyah (2018) and Panjalusman et al. (2018) which state that transfer pricing aggressiveness does not affect tax avoidance. Falbo & Firmansyah (2018) used a sample of 90 manufacturing companies listed on the IDX from 2013 to 2015. This difference is caused by differences in the tax avoidance proxies used in this study, abnormal book-tax difference namely the(ABTD) and the number of years of observation. used. Furthermore, the research of Panjalusman et al. (2018) on measuring the value of transfer pricing aggressiveness 9 MNC companies that use the share value of trade receivables that have a special relationship with total receivables and tax avoidance proxies using ETR.
As for this study, the proxy used to measure the variable tax avoidance is D_D BTD (Book Tax Different) suggested by Desai & Dharmapala (2006) which is considered conceptually reasonable because it removes the part that is not related to tax avoidance from BTD and identifies BTD resulting from tax avoidance. This proxy is considered to be able to relatively present objectivity because it measures tax avoidance using disclosed accounting information which was later developed by Park et al. (2016) and Kang & Ko (2014). Recent research has also used this proxy to measure the variable tax avoidance as in Akbari et al. (2019).
The test results in this study indicate that transfer pricing aggressiveness has an effect on tax avoidance, allegedly due to transfer pricing not only due to transactions that are affiliated with foreign entities but also with domestic entities considering several reasons, namely one party has more tax facilities. and other tax facilities, one of the affiliated parties has compensation for losses, and the affiliate transaction is a transaction subject to final Income Tax.
Another factor that is thought to be a differentiator is the emergence of a higher awareness of the company in disclosing data and information related to disclosure of transactions with related parties in the financial statements related to more attention from tax authorities with the issuance of the Minister of Finance Regulation Number 213 / PMK.03 / 2016 Types of Documents and/or Additional Information Obligatory to Keep Taxpayers Conducting Transactions with Related Parties, and Management Procedures for them.
As in theory agency, the agent in this case the manager will make decisions following their interests. Thus, based on this research, manufacturing companies in Indonesia carry out transfer pricing aggressiveness which aims for tax avoidance purposes to maximize the amount of revenue received by the company.
Test results do indicate that income smoothing positive effect on tax avoidance which means that the higher the level of income smoothing a company, the higher the level of tax evasion. This is in line with Akbari et al. (2019) that income smoothing has a specific objective, namely to produce consistency in increasing company revenue.
Considering that direct tests between income smoothing and tax avoidance there have not been many, this study uses an approach to the effect of earnings management on tax avoidance. Income smoothing is one of the main instruments of earnings management (Healy & Wahlen, 1999; Fonseca & González, 2008). In other words, this study is assessed in line with the research of Wang & Chen (2012) and Graham et al. (2005) which states that tax avoidance is carried out simultaneously with earnings management. Likewise, the latest test results by Amidu et al. (2019) were conducted on companies listed on the Ghana Stock Exchange and Martani & Kamila (2014) for manufacturing industrial companies in Indonesia during a 4-year trial period.
However, this is different from the research conducted by Erickson et al. (2005) who analyzed the book-tax trade-off to examine the relationship between financial reporting and taxes. This study has the conclusion that several companies are willing to pay higher taxes but report higher accounting profits. The difference in the results of this study can be caused by differences in the proxies used as well as the conditions of the company with companies in Indonesia. Thus, income smoothing as a process of manipulating the timing of recognition of reported income or income becomes reasonable if the manipulation is closely related to efforts tax avoidance by companies as in theory agency that agents, in this case, managers, will make decisions following their interests.
The results of the tests conducted show that managerial ability has a negative effect on tax avoidance. These results indicate that managerial ability is inversely proportional to tax avoidance, which means that the higher the manager's ability to manage resource efficiency, the lower the tax avoidance activity. Managers with a higher level of ability have a higher understanding of their industry.
The results of this study are in line with previous studies conducted by Park et al. (2016) and Francis et al. (2013) which states that managerial ability has a negative effect on tax avoidance. According to Park et al. (2016) that managers with higher managerial abilities tend to focus on efforts to improve corporate performance through strategic tax planning /tax planning rather than having tax avoidance in light of the greater risks that will arise for the company.
However, it is different from research conducted by Koester et al. (2017) and Handayani et al. (2013) which state that managerial ability has a positive effect on tax avoidance. In this study, the proxy tax avoidance used was ETR while in this study it was D_D BTD. Furthermore, in Handayani et al. (2013) to determine the efficiency at the manager level, it does not carry out Tobit regression on the results of the DEA score, which is different from this study which conducted Tobit regression as stated in Demerjian et al. (2012).
According to agency theory, doing activities tax avoidance will cause uncertainty to the company's shareholders with the possibility of legal problems, fines, and other related costs that are greater than the profitability obtained by the company. Thus, the higher managerial ability of a manager /managerial ability encourages a manager to make the right efforts in making efficient use of company resources that will come out, one of which is by acting carefully to avoid the possibility of a greater risk to the company through avoiding activities. tax avoidance and better planning tax obligations through tax planning that is legal and compliant.
The results of the tests conducted show that financial constraints do not affect tax avoidance. This shows that the financial constraints experienced by a company do not affect changes in efforts tax avoidance made by a company.
The results of this study are in line with other studies by Bayar et al. (2018) which states that financial constraints do not have a significant effect on tax avoidance actions by companies with good governance. Meanwhile, on the other hand, financial constraints can have a significant effect only on companies that have bad governance.
However, in contrast to several previous studies such as Edwards et al. (2016), Chen & Lai (2012) and Taylor & Richardson (2014) which states that financial constraints have a significant positive effect on tax avoidance. This difference can be caused by differences in the proxies used, such as proxies tax avoidance and Cash ETR in Edwards et al. (2016) and PERM_BTD in Chen & Lai (2012) then proxies financial constraints with RankΔZ, RankΔKZ and macroeconomic measurements in Edwards et al. (2016) and KZ, WW Index, and Payout Ratio in Taylor & Richardson (2014).
Other distinguishing factors are geographic location, number of samples, economic conditions, and company characteristics. Differences in geographic location and sample size as in the research of Edwards et al. (2016) on 32,938 US companies during the period 1987 to 2011 and Chen & Lai (2012) research on US companies during the period 1986 to 2011. Therefore, with these differences and the results of previous research that concluding that other variables determine whether financial constraints affect or not, it can be stated that financial constraints do not affect tax avoidance.
The results of the tests conducted show that financial constraints do not moderate the effect of transfer pricing aggressiveness on tax avoidance. This shows that the financial constraints experienced by a company do not affect the positive effect of transfer pricing aggressiveness on tax avoidance efforts by a company.
The results of this study are in line with Bayar et al. (2018) which states that financial constraints do not have a significant effect on tax avoidance in companies that have good governance. In contrast to the test results of Alm et al. (2019) which states that financial constraints in a company prevent the company from gaining full access to external funding so that the company then decides to take tax avoidance efforts.
The results of the tests conducted show that financial constraints do not moderate the effect of transfer pricing aggressiveness on tax avoidance so that they are not following the proposed hypothesis. although the direction shown is both positive, it has not been able to moderate it. This is presumably due to other determining variables that determine how the influence of the condition of the financial constraints on measures tax avoidance that the governance of each company where the condition of the financial constraints affects only the companies that have low governance.
Test results show that financial constraints moderate the effect of income smoothing on tax avoidance. This suggests that the higher the level of financial constraints experienced by a company will moderate (strengthen) the positive effect of income smoothing on efforts tax avoidance made by a company.
The results of this study are in line with a recent study by Amidu et al. (2019) which states that earnings management has a positive effect on tax avoidance, which means that the increasing activity earnings management (income smoothing), the more efforts tax avoidance are carried out. Likewise, research conducted by Alm et al. (2019) states that financial constraints have a positive effect on tax avoidance efforts.
Following this explanation, it can be stated that the condition of the company experiencing financial constraints will cause the company to become more aggressive in performing income smoothing. Income smoothing aims to avoid taxes to increase the company's internal funds to cover a variety of activities.
Test results show that financial constraints moderate the influence of managerial ability to tax avoidance. This suggests that the higher the level of financial constraints experienced by a company will moderate (strengthen) the negative effect of managerial ability on efforts tax avoidance made by a company.
The results of this study are in line with research by Bayar et al. (2018) which states that companies can mitigate tax avoidance as a result of the financial constraints company's by way of increasing good governance practices. However, this is different from the test results of Alm et al. (2019) which reveals that the financial constraints company prevent companies from gaining full access to external funding so that the company then decides to make tax avoidance efforts.
Based on the results of this test, financial constraints will moderate the effect of income smoothing on tax avoidance, but the direction of the moderation does not weaken, instead, it strengthens the negative effect of managerial ability on tax avoidance or is not following the proposed hypothesis. This is thought to be caused by the actions of managers when the company experiences financial constraints. When the condition of financial constraints increases, managers use good managerial skills to strive for efficient use of resources through tax planning that is better legally and obediently compared to directly engaging in activities tax avoidance, considering the risks arising from activities tax avoidance are considered to be greater. Another reason that supports these results is the results of previous studies which state that financial constraints are not influential or significant in companies that have good governance.
Conclusion
This study provides several conclusions, namely transfer pricing aggressiveness and income smoothing have a positive effect on tax avoidance. On the other hand, the managerial ability has a negative effect on tax avoidance. Likewise, financial constraints do not affect tax avoidance. The moderating effect, namely: financial constraints do not moderate the effect of transfer pricing aggressiveness on tax avoidance, financial constraints strengthen the positive effect of income smoothing on tax avoidance, financial constraints strengthen the negative effect of managerial ability on tax avoidance.
This study has several limitations, namely research using data from manufacturing companies listed on the IDX in 2015 to 2018 so that the results of the study
can be different if you use research data with different periods and company sectors and cannot be implicated in companies in all sectors. Next, the variable is a managerial ability only measured based on the identification of the company's management strategic decisions that are sourced from the financial information contained in the financial statements so that it is considered incapable of observing the daily decisions carried out by the management.
Suggestions for further research are to use samples other than manufacturing companies so that it can expand the characteristics of research variables on tax avoidance and can be implicated in other sectors while extending the research period. Next, it is hoped that you can use other proxies in measuring the variables in this study. Besides, further research is suggested to issue data outlier with various techniques such as doing winsorizing and trimming.
References
Akbari, F., Salehi, M., & Bagherpour Vlashani, M. A. (2019). The relationship between tax avoidance and firm value with income smoothing: A comparison between classical and Bayesian econometric in multilevel models. International Journal of Organizational Analysis, 27(1), 125–148. https://doi.org/10.1108/IJOA-09-2017-1235
Alm, J., Liu, Y., & Zhang, K. (2019). Financial constraints and firm tax evasion. International Tax and Public Finance, 26(1), 71–102.
https://doi.org/10.1007/s10797-018-9502-7
Amidu, M., Coffie, W., & Acquah, P. (2019). Transfer Pricing, Earnings Management, and Tax Avoidance of firms in Ghana. Journal of Financial Crime, 26(1), 235-259.
https://doi.org/10.1108/JFC-10-2017-0091
Azka, R. M. (2018). IMF: Risiko Arus Modal Keluar di Negara Berkembang Menjadi Lebih Besar. ekonomi.bisnis.com.
Bank Indonesia. (2009). Tujuan Kebijakan Moneter. www.bi.go.id.
Bartelsman, E. J., & Beetsma, R. M. W. J. (2003). Why pay more? Corporate tax avoidance through transfer pricing in OECD countries. Journal of Public Economics, 87(9–10), 2225–2252. https://doi.org/10.1016/S0047-2727(02)00018-X
Bayar, O., Huseynov, F., & Sardarli, S. (2018). Corporate Governance, Tax Avoidance, and Financial Constraints. Financial Management, 47(3), 651–677.
https://doi.org/10.1111/fima.12208
Borkowski, S. C. (2010). Transfer pricing practices of transnational corporations in PATA countries. Journal of International Accounting, Auditing and Taxation, 19(1), 35–54. https://doi.org/10.1016/j.intaccaudtax.2009.12.003
Chen, C., & Lai, S. (2012). Financial Constraint and Tax Aggressiveness. Working Paper, University of Auckland, 1–41.
Chen, S., Chen, X., Cheng, Q., & Shevlin, T. (2010). Are family firms more tax aggressive than non-family firms? Journal of Financial Economics, 95(1), 41-61.
https://doi.org/10.1016/j.jfineco.2009.02.003
Ciconte, W., Donohoe, M. P., Lisowsky, P., & Mayberry, M. A. (2014). Predictable Uncertainty: The Relation between Unrecognized Tax Benefits and Future Income Tax Cash Outflows. SSRN Electronic Journal. https://doi.org/10.2139/ssrn.2390150
Cobham, A. (2005). Tax evasion, tax avoidance and development finance. QEH Working Paper Series, 129(129), 1–20.
Demerjian, P. R., Lewis, M. F., Lev, B. I., & McVay, S. E. (2012). Managerial Ability and Earnings Quality. SSRN Electronic Journal. https://doi.org/10.2139/ssrn.1650309
Desai, M. A., & Dharmapala, D. (2009). Earnings management, corporate tax shelters, and book-tax alignment. National Tax Journal, 62(1), 169-186.
Desai, M. A., & Dharmapala, D. (2006). Corporate tax avoidance and high-powered incentives. Journal of Financial Economics, 79(1), 145–179.
https://doi.org/10.1016/j.jfineco.2005.02.002
Dharmapala, D. (2008). What problems and opportunities are created by tax havens.
Oxford Review of Economic Policy, 24(4), 661–679.
https://doi.org/10.1093/oxrep/grn031
Dyreng, S. D., Hanlon, M., & Maydew, E. L. (2008). Long-Run Corporate Tax Avoidance. The Accounting Review, 83(1), 61–82.
Eckel, N. (1981). Smoothing Hypothesis Revisited. Abacus, 17(1), 28–40.
https://doi.org/10.1111/j.1467-6281.1981.tb00099.x
Edwards, A. S., Schwab, C., & Shevlin, T. J. (2012). Financial Constraints and the Incentive for Tax Planning. SSRN Electronic Journal. https://doi.org/10.2139/ssrn.2163766
Edwards, A., Schwab, C., & Shevlin, T. (2016). Financial constraints and cash tax savings.
Accounting Review, 91(3), 859–881. https://doi.org/10.2308/accr-51282
Erickson, M., Hanlon, M., & Maydew, E. L. (2005). How Much Will Firms Pay for Earnings That Do Not Exist? Evidence of Taxes Paid on Allegedly Fraudulent Earnings. SSRN Electronic Journal. https://doi.org/10.2139/ssrn.347420
Falbo, T. D., & Firmansyah, A. (2018). Thin Capitalization, Transfer Pricing Aggresiveness, Penghindaran Pajak. Indonesian Journal of Accounting and Governance, 2(1), 1–28. https://doi.org/10.36766/ijag.v2i1.6
Firmansyah, A., & Bayuaji, R. (2019). Financial constraints, investment opportunity set, financial reporting aggressiveness, tax aggressiveness: Evidence from indonesia manufacturing companies. Academy of Accounting and Financial Studies Journal, 23(5), 1–18.
Fonseca, A. R., & González, F. (2008). Cross-country determinants of bank income smoothing by managing loan-loss provisions. Journal of Banking and Finance, 32(2), 217–228. https://doi.org/10.1016/j.jbankfin.2007.02.012
Francis, B., Sun, X., & Wu, Q. (2013). Managerial Ability and Tax Avoidance. SSRN Electronic Journal. https://doi.org/10.2139/ssrn.2348695
Frank, M. margaret, Lynch, L. J., & Rego, S. O. (2009). Tax Reporting Aggressiveness and Its Relation Financial Reporting University of Virginia. Accounting Review, 84(2), 467–496. https://doi.org/10.2308/accr.2009.84.2.467
Graham, J. R., Harvey, C. R., & Shiva Rajgopal. (2005). The economic implications of corporate financial reporting. Journal of Accounting and Economics, 40(1–3), 3–73. https://doi.org/10.1016/j.jacceco.2005.01.002
Gravelle, J. G. (2009). Tax havens: International tax avoidance and evasion. National Tax Journal, 62(4), 727-753.
Grubert, H., & Mutti, J. (1991). Taxes, Tariffs and Transfer Pricing in Multinational Corporate Decision Making. The Review of Economics and Statistics, 73(2), 285. https://doi.org/10.2307/2109519
Handayani, D., Andreas, & Fitrios, R. (2013). Pengaruh Kecakapan Manajerial , Set Kesempatan Investasi dan Kepemilikan Pemerintah Terhadap Tarif Pajak Efektif. Simposium Nasional Akuntansi XVI Manado, 6(September 2013), 2532–2562.
Hanlon, M., & Heitzman, S. (2010). A review of tax research. Journal of accounting and
Economics, 50(2-3), 127-178. https://doi.org/10.1016/j.jacceco.2010.09.002
Hanlon, M., & Slemrod, J. (2009). What does tax aggressiveness signal? Evidence from stock price reactions to news about tax shelter involvement. Journal of Public economics, 93(1-2), 126-141. https://doi.org/10.1016/j.jpubeco.2008.09.004
Healy, P. M., & Wahlen, J. M. (1999). A review of the earnings management literature and its implications for standard setting. Accounting Horizons, 13 (4)(November), 365–383. https://doi.org/10.2308/acch.1999.13.4.365
Huang, P., Zhang, Y., Deis, D. R., & Moffitt, J. S. (2009). Do artificial income smoothing and real income smoothing contribute to firm value equivalently? Journal of Banking and Finance, 33(2), 224–233.
https://doi.org/10.1016/j.jbankfin.2008.07.012
Janský, P., Prats, A., & Aid, C. (2013). Multinational corporations and the profit-shifting lure of tax havens. Christian Aid Occasional Paper, 9(9), 15.
Jihad Akbar. (2020). Tentang Resesi Ekonomi dan yang Harus Dipersiapkan. Kompas, 5 Agustus 2020.
Kang, J. Y., & Ko, J. K. (2014). Tax avoidance, firm value and corporate governance. Korean Accounting Review, 39(1), 147–189.
Koester, A., Shevlin, T., & Wangerin, D. (2017). The role of managerial ability in corporate tax avoidance. Management Science, 63(10), 3285–3310.
https://doi.org/10.1287/mnsc.2016.2510
Mahdavi, G. H., & Saberi, M. (2016). Managerial ability and financial constraints (using data envelopment analysis). Quarterly Financial Accounting, 8(31), 51-73.
Martani, D., & Kamila, P. A. (2014). Analisis Hubungan Agresivitas Pelaporan Keuangan dan Agresivitas Pajak. Simposium Nasional Akuntansi XVII. Lombok, 24–27.
Media Keuangan. (2019). Meningkatkan Rasio Pajak. Jakarta: Kementerian Keuangan.
Olibe, K. O., & Rezaee, Z. (2008). Income shifting and corporate taxation: the role of cross‐border intrafirm transfers. Review of Accounting and Finance, 7(1), 83–101. https://doi.org/10.1108/14757700810853860
Panjalusman, P. A., Nugraha, E., & Setiawan, A. (2018). Pengaruh Transfer Pricing Terhadap Penghindaran Pajak. Jurnal Pendidikan Akuntansi & Keuangan, 6(2), 105. https://doi.org/10.17509/jpak.v6i2.15916
Park, J., Ko, C. Y., Jung, H., & Lee, Y. S. (2016). Managerial ability and tax avoidance: evidence from Korea. Asia-Pacific Journal of Accounting and Economics, 23(4), 449–477. https://doi.org/10.1080/16081625.2015.1017590
Pendse, S. J. (2012). International Transfer Pricing: A Review of Non-Tax Outlook.
Procedia - Social and Behavioral Sciences, 37, 337–343.
https://doi.org/10.1016/j.sbspro.2012.03.299
Plesner Rossing, C., & Rohde, C. (2014). Transfer pricing: aligning the research agenda to organizational reality. Journal of Accounting & Organizational Change, 10(3), 266– 287. https://doi.org/10.1108/JAOC-03-2012-0017
Rego, S. O. (2005). Tax Avoidance Activities of U.S. Multinational Corporations. SSRN Electronic Journal. https://doi.org/10.2139/ssrn.320343
Richardson, G., & Lanis, R. (2007). Determinants of the variability in corporate effective tax rates and tax reform: Evidence from Australia. Journal of Accounting and Public Policy, 26(6), 689–704. https://doi.org/10.1016/j.jaccpubpol.2007.10.003
Richardson, G., Taylor, G., & Lanis, R. (2013). Determinants of transfer pricing aggressiveness: Empirical evidence from Australian firms. Journal of Contemporary Accounting & Economics, 9(2), 136–150.
https://doi.org/10.1016/j.jcae.2013.06.002
Slemrod, J. (2007). Cheating Ourselves : The Economics of Slemrod, J. (2007). Cheating
Ourselves : The Economics of Tax Evasion. Tax Evasion. Journal of Economic Perspectives, 21(1), 25–48. https://doi.org/10.1257/jep.21.1.25
Taylor, G., & Richardson, G. (2012). International Corporate Tax Avoidance Practices: Evidence from Australian Firms. International Journal of Accounting, 47(4), 469– 496. https://doi.org/10.1016/j.intacc.2012.10.004
Taylor, G., & Richardson, G. (2014). Incentives for corporate tax planning and reporting: Empirical evidence from Australia. Journal of Contemporary Accounting and Economics, 10(1), 1–15. https://doi.org/10.1016/j.jcae.2013.11.003
Wang, S. dan Chen, S. (2012). The Motivation for Tax Avoidance in Earnings Management. International Conference on Engineering and Business Management, 447–450.
Whited, T. M., & Wu, G. (2006). Financial constraints risk. Review of Financial Studies, 19(2), 531–559. https://doi.org/10.1093/rfs/hhj012
Jurnal Ilmiah Akuntansi dan Bisnis, 2021 | 297
Discussion and feedback