The Effects of Executive and Company Characteristics on Tax Aggressiveness
on
Jurnal Ilmiah Akuntansi dan Bisnis
Vol. 15 No. 2, July 2020

AFFILIATION:
1,2,3 Faculty of Economics and Business, Universitas Udayana, Indonesia
*CORRESPONDENCE: geri_wirasa@unud.ac.id
THIS ARTICLE IS AVAILABLE IN: https://ojs.unud.ac.id/index.php/jiab
DOI:
10.24843/JIAB.2020.v15.i02.p10
CITATION:
Dewi, K. K. S., & Yasa, G. W. (2020) The Effects of Executive and Company Characteristics on Tax Aggressiveness. Jurnal Ilmiah Akuntansi dan Bisnis, 15(2), 280292.
ARTICLE HISTORY Received:
13 March 2020
Revised:
23 June 2020
Accepted:
16 July 2020
The Effects of Executive and Company Characteristics on Tax Aggressiveness
Kadek Kristina Surya Dewi 1*, Gerianta Wirawan Yasa 2
Abstract
Tax aggressiveness is the act of manipulating profits carried out through tax planning that can be both legal and illegal. Based on the agency theory, the different interests of agents and principals may become a source of conflict. The aim of this study is to determine and obtain empirical evidence on the effect of executive characteristics, profitability, leverage, capital intensity, and company size on tax aggressiveness. This research was conducted on manufacturing companies listed on Indonesia Stock Exchange in 2016-2018, because the Indonesian economy has started to recover since 2016 and continued until 2018, so it will have an impact on tax revenues. The sample was selected using purposive sampling technique and obtained 70 manufacturing companies. Data analysis technique used is multiple linear regression analysis. The results show that executive characteristics, profitability, and company size had a positive effect. While leverage and capital intensity had negative effect on tax aggressiveness.
Keywords: Tax aggressiveness, executive characteristics, profitability, leverage, capital intensity, company size.
Introduction
Tax is the main source of state revenue, so it is a challenge for the Directorate General of Taxes to explore tax revenue to increase along the economic growth (Tiaras & Wijaya, 2015). The realization of the maximum tax revenue is not only by Directorate General of Taxes, there must be support from Indonesian citizens in a manner that is obedient in fulfilling their taxation obligations. This is the target and realization of the state tax revenues over the past three years, namely 2016-2018 that can be seen in Figure 1.
The percentage of state tax revenue in 2016-2018 has increased every year, but still not optimal. One of the reasons can be seen from compliance of taxpayer in Indonesian, which is classified as low. It can be indicated by Indonesia’s tax ratio which reached 11.5 percent in 2018, where the value is the lowest compared to other pacific countries (Kementrian Keuangan Republik Indonesia, 2019). One of the things that causes low tax compliance level is the presence of tax aggressiveness carried out by the company (Putri & Suryarini, 2017).
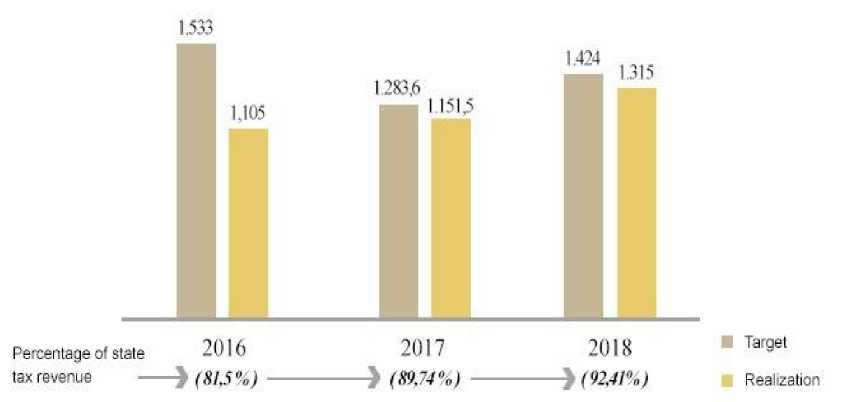
Figure 1. Target and Realization of State Tax Revenue in 2016-2018
Source: Kementrian Keuangan Republik Indonesia (2019)
Tax aggressiveness is an action undertaken by the company by manipulating profits carried out through tax planning both legally and illegally, to increase tax savings (Frank et al., 2009). Tax aggressiveness includes a fairly phenomenal issue and occurs almost in companies around the world in the form of tax avoidance (Surya & Noerlela, 2016). Tax avoidance is done by utilizing the weakness of the regulations without defying them (Yuniarwati et al., 2017). Tax avoidance is an action that is quite complicated but has uniqueness, in addition is still allowed but on the other side is not desirable, because when a company has a high level of tax aggressiveness it will cause harm to the country (Kurniawati & Arifin, 2017). There are conflict interests between companies and the governments related to taxes. The company wants a minimum tax payment to the country while the government’s interest is to collect as much tax as possible from the community (Dewi & Noviari, 2017). The differences in interest based on agency theory will lead to non-compliance of taxpayers where the company will perform tax planning so that tax payments becomes optimal. This action can be categorized as tax aggressiveness.
Based on a survey re-analyzed by United Nations University using the database of International Center of Policy and Research (ICPR), and International Center for Taxation and Development (ICTD) obtained tax avoidance data companies as many as 30 countries, Indonesia turned out to be the 11th largest with a value of 6.48 billion US dollars (Susilo, 2017). The data indicates that the level of tax aggressiveness in Indonesia is still relatively high. The manufacturing industry is the sector that provides the highest contribution to tax revenue when compared to another sector. In 2018, the contribution of the manufacturing sector reached 31.8 percent followed by the trade sector 19.3 percent, financial services 14 percent, and agriculture 13.8 percent (Julianto, 2018). The phenomenon of tax aggressiveness can be seen also from Notice of Addition Tax Underpayment Assessment (SKPKB) received by the company. The number of manufacturing companies receiving SKPKB issued in 2016-2018 can be seen in Table 1.
Table 1. Manufacturing Companies Listed on the Indonesia Stock Exchange that received the SKPKB in 2016 - 2018
|
Year |
Number of Companies |
Total Amount (IDR) |
|
2016 |
15 |
318,842,492,365 |
|
2017 |
12 |
82,338,507,889 |
|
2018 |
17 |
278,018,949,200 |
Source: Compiled Annual Report of IDX Manufacturing Companies (2018)
Based on Table 1. Show that the last three years, a manufacturing company that received SKPKB as much as 44 companies. The number of companies that received SKPKB fluctuated over the past three years, this indicate that there are still companies doing tax aggressiveness. The presence of aggressive tax behavior on the manufacturing industry will have a significant impact on state revenue from the tax sector considering that manufacturing sector is the largest contributor on state tax revenue. This research used the Cash Effective Tax Rate (CETR) to measure the level of corporate tax avoidance because this proxy can measure directly the outgoing cash flow that the company uses for tax payment divided by the profit before tax. This measurement is also capable to describe the short-term tax management paid with cash (Park, 2018).
There are several factors that can affect tax aggressiveness namely profitability, leverage, company size, inventory intensity, executive characteristic, sales growth, corporate social responsibility, corporate governance, profit management, family ownership, and political connections. This research is a development of previous research that provides inconsistencies by looking at the characteristic of executive and companies that can encourage tax aggressiveness. Characteristics of companies can be seen from the level of profitability (Dewi & Noviari, 2017), leverage (Kimsen et.,al, 2018), capital intensity (Putri & Lautania, 2016), and company size (Dewinta & Setiawan, 2016).
Tax aggressiveness by the company must be through the decision taken by the head of the company, so that executive characteristics can be a determine factor in describe the action of tax aggressiveness. The company’s leader as decision makers and policies certainly have a different character. The executive of company has two character namely risk taker and risk averse (Maharani & Suardana, 2014). The character of executive shows how the action taken is faced with a risk. A high level of risk show that executives tend to be risk taker, otherwise a small level of risk indicates that executives tend to be risk averse (Dewi & Jati, 2014).
Profitability is an important factor because it can describe a company’s ability to generate profits over a certain period (Adisamartha & Noviari, 2015). The higher ROA show that the company’s performance is more effective in using company assets to generate profits (Nengzih, 2018). The company’s operational activities are generally funded by two main sources, namely shareholders and debts. The level of tax aggressiveness performed by the company can be seen from how much the capital structure is financed by debt, the higher the leverage then the tax aggressiveness is getting lower because the use of debt will incur the cost of interest that will directly reduce the profit amount of the company (Adisamartha & Noviari, 2015). One of the management’s policies is to invest in fixed assets that are needed in the company’s operations. Capital intensity is a ratio comparison between fix assets on total asset. Fixed assets owned by the company may reduce taxes due to its depreciation (Delgado, et al., 2014). The higher the company’s investment on fixed assets, the cost of depreciation will arise which can be a deduction from the company’s tax burden.
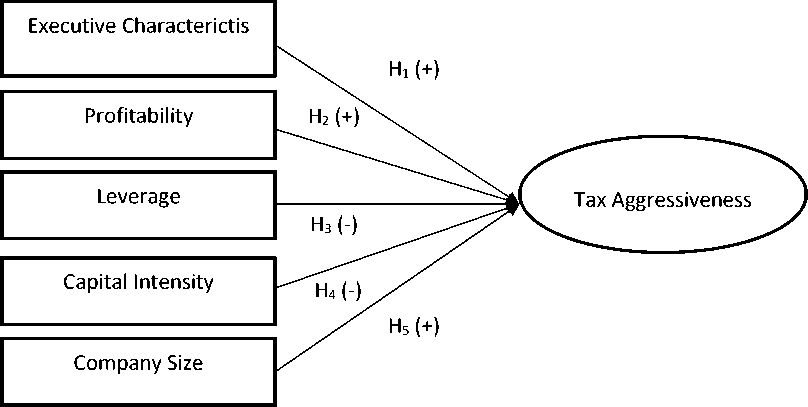
Figure 2. Conceptual Model
Source: Processed Data, 2019
Company size are able to influence the way a company fulfill its tax obligations because tax imposition base derived from company’s profit (Dewinta & Setiawan, 2016). The bigger the size of company, the transactions will be more complex so that it allows companies to take advantage of existing gaps to carry out tax aggressiveness (Kimsen, et al., 2018).
This study refers to the agency theory proposed by Jensen dan Meckling in 1976. Agency theory explains the relationship that occurs between agents and principals. The different interests of agents and principals may become a source of conflict, as some agents may not perfectly act on principal’s best interest. This condition can lead to a conflict of interest between agents and principals. In this study, conflicts occurred between the fiscus (government) and company. These differences of interest may affect matters relating to the performance of the company, one of which is the company’s policy regarding taxes. Agency conflict according to Chyz & White (2014) relates to the tax aggressiveness in the form of tax avoidance. Agency theory explain the contract between agent and the principal but in reality an efficient contract never happened. Company managers tend to have more company-related information than the government so they can do tax planning. Tax avoidance can be a choice of company to maximize its interest.
The government as principal governs company to pay taxes in accordance with the prevailing tax laws and regulations but the company as an agent more concerned with its importance in optimizing of profit so as to minimize the tax burden by carrying out tax aggressiveness. Executive as a leader of the company have authorize in decisionmaking and policy to maximize of corporate profits. The executive character certainly affects the policy issued as well as the decisions taken, including the decision to conduct tax aggressiveness. The risk faced when the company conducts tax aggressiveness is getting a punishment that can impact on declining company value (Liu & Wang, 2017). The research conducted by Swingly & Sukartha, (2015) found that executive who have a risk taker character have a positive influence on tax aggressiveness in the form of tax avoidance. The more executives are risk taker then the tax aggressiveness tends to be
high. This statement was supported by Dyreng et al., (2008), Dewi & Jati, (2014) Based on the description, the hypothesis proposed in this study is.
-
H1: Executive characteristic has positive effect on tax aggressiveness
Conceptually, the company’s tax imposition is the amount of profit gained. Companies with a high level of profitability show that the company has the ability to manage goods assets to generate high return. When the company gains high profit during the current period, the amount of income tax will increase. These conditions can increase the tendency of companies to carry out tax aggressiveness. Research on profitability conducted by Darmawan & Sukartha (2014), Dewi & Noviari (2017), Kim & Im (2017), Susanto et al, (2018) , Rani et al., (2018), Kimsen et al., (2018) shows that profitability has a positive effect on tax aggressiveness. Based on the descriptions, the hypothesis proposed in this study is.
-
H2: Profitability has a positive effect on tax aggressiveness
It is possible for a company to use debt in financing its operational activities. When the company uses debt in the composition of financing, there will be interest expense payable. These cost can be used to reduce the amount of taxable income (Irianto et al., 2017). The debt will give a negative relationship to the tax aggressiveness (Dewi & Noviari, 2017). Previous research conducted by Swingly & Sukartha (2015), Kimsen et al., (2018), Andhari & Sukartha (2019) earned the result that leverage has a negative effect on tax aggressiveness. Based on the description, the hypothesis proposed in this study is.
-
H3: Leverage has a negative effect on tax aggressiveness
The manager has the authority to invest in fixed assets to support its operation. The cost of depreciation attached to the fixed asset can reduce the company’s tax burden. The higher the capital intensity of company, then the tax aggressiveness is getting lower. Research on capital intensity conducted by Putri & Lautania (2016), Budianti & Curry (2018), Sinaga (2019) provide the same conclusions that capital intensity has a negative effect on tax aggressiveness. Based on the description, the hypothesis proposed in this study is.
-
H4: Capital intensity has a negative effect on tax aggressiveness
Company size is a scale that can classify companies into large and small companies that can be measured by using total assets. Large-scale companies will certainly have a high total asset so it tends to be able and stable in generation profits. Large companies tend to be able to manage their tax burden optimally because they have resources that are experts in the field of taxation and have a law firm that can find gaps in tax law to minimize corporate tax payments. Research on company size conducted by Dewinta & Setiawan (2016), Alfina et al., (2018), Ann (2019) shows that the company size has a positive effect on tax aggressiveness. Based on the description, the hypothesis proposed in this study is.
-
H5: Company size has a positive effect on tax aggressiveness
Research Method
This research uses quantitative approach. The object of this research is tax aggressiveness of manufacturing companies listed on Indonesia Stock Exchange in 20162018. To find out the executive character, the company’s risk proxy is used. Company risk reflects the standard deviation of earnings.
Table 2. Sample Selection Result
|
No |
Description |
Amount |
|
1 |
Manufacturing companies listed on the Indonesia Stock Exchange successively in 2016-2018 |
137 |
|
2 |
The manufacturing company suffered a loss in 20162018 |
(54) |
|
3 |
Manufacturing companies that have a CETR value more than one |
(13) |
|
Total sample based on criteria |
70 | |
|
Year of observation |
3 | |
|
Total observation |
210 | |
Source: Processed Data, 2019
Profitability measured using Return on Assets (ROA) because it can provide a good measurement of the company’s overall operations. Leverage is calculated using Debt to Assets Ratio (DAR) which illustrates the proportion of total liabilities to total company assets. Capital intensity is calculated using the ratio of fixed assets intensity while company size can be calculated by natural logarithm (Ln) of total assets to obtain an absolute value.
Populations in this research was 137 companies selected with the following criteria: (1) Sample is manufacturing company listed on Indonesia Stock Exchange successively in year 2016-2018; (2) Manufacturing companies that did not suffer losses during the research period of 2016-2018 to avoid negative CETR value; (3) Manufacturing companies that have a CETR value < 1, so there is no extreme value that will affect the estimation of the model. The research sample was selected using purposive sampling technique and obtained 70 manufacturing companies. Data analysis technique used is multiple linear regressions analysis. There are two tests conducted before a regression test that is a descriptive statistical test and classic assumption test.
Based on sample research criteria through purposive sampling technique, so the number of observations in this research was 210 observations. Sample selection results can be seen in Table 2.
Result and Discussion
Descriptive statistic aims to provide information regarding the characteristic of research variables related to the minimum value, maximum value, mean value, and standard deviation. Descriptive characteristic result can be seen in Table 3.
Table 3. Descriptive Statistical Result
|
N |
Minimum |
Maximum |
Mean |
St. Deviation | |
|
CETR |
210 |
0.006 |
0.968 |
0.286 |
0.172 |
|
RISK |
210 |
0.000 |
0.566 |
0.010 |
0.082 |
|
ROA |
210 |
0.002 |
0.709 |
0.112 |
0.108 |
|
DAR |
210 |
0.077 |
0.807 |
0.400 |
0.174 |
|
CAPINT |
210 |
0.059 |
0.797 |
0.388 |
0.162 |
|
SIZE |
210 |
11.980 |
19.658 |
15.054 |
1.628 |
|
Valid N (List wise) |
210 |
Source: Processed Data, 2019
Unstandardized Residual
Source: Processed Data, 2019
Based on Table 3. the average value of CETR is 0.286, which is close to the minimum value. It indicate that the level of corporate tax aggressiveness tends to be high. The average value of RISK is 0.0100, where the value is approaching the minimum value. It indicates that the executive characteristic of the company being sampled tend to be risk averse or dislike the risk. The average value of ROA is 0.112, it means that ROA at the sample company tend to be low because the average value was approach the minimum value. The average value of DAR is 0.400, where the value is close to the minimum value. It indicates that DAR company samples tend to be low. The average value of CAPINT is 0.388, where the value approach the minimum value. It indicates that the number of fixed assets in the samples companies tend to be low. While the average value of SIZE is 15.054, which is close to its maximum value. It indicates that the company’s total assets tend to be high, so the company size being samples tends to be large. The standard deviation value for each measurement is below the average value.
The classic assumption test aims to ensure that models made have fulfilled basic assumptions in regression analysis. The classic assumption test on this study included the test of normality, multicollinearity test, autocorrelation test, and heteroscedasticity test. The result of his research can be seen in Table 4.
Based on the result of normality test as presented in Table 4. Shows that the significance value is 0.098 so that it is greater than the level of significant of 0.05, so that it can be concluded that the regression equation model in this study is distributed normally. Based on Table 5, it can be seen that the tolerance value for each variable is greater than 10 percent and the inflation factor value for each variable ≤ 10. Which indicates that there is no correlation between variables so that the regression equation model is free from multicollinearity. Based on the result of autocorrelation test as presented in Table 6. Show that the magnitude of Durbin Watson Value is 2.099. The value of D-W according to the table with n = 210 and k = 5, obtained the value of dl=1.735 and du =1.813. On this research the value of du<DW<4-du (1.813 < 2.099 < 2.187), it can be concluded that there is no autocorrelation between the residual. Based on Table 7. The significance value of each variable is more than 0.05, which means there is no influence between the independent variable against the absolute residual. Thus, this model of this study does not contain any symptoms of heteroscedasticity.
|
Variable |
Tolerance |
VIF |
Description |
|
RISK |
0.857 |
1.166 |
Free multicollinearity |
|
ROA |
0.744 |
1.345 |
Free multicollinearity |
|
DAR |
0.795 |
1.258 |
Free multicollinearity |
|
CAPINT |
0.694 |
1.441 |
Free multicollinearity |
|
SIZE |
0.960 |
1.042 |
Free multicollinearity |
Source: Processed Data, 2019
|
Table 6. Autocorrelation Test Result | ||||
|
Model R |
R Square |
Adjusted |
RStd. Error of |
the Durbin-Watson |
|
Square |
Estimate | |||
|
1 0.602a |
0.362 |
0.347 |
0.781 |
2.099 |
|
Source: Processed Data, 2019 | ||||
Multiple linear regression analysis was used to determine the effect of independent variable own its dependent variable. The result shown in Table 8.
Based on Table 8. the magnitude of the influence of independent variables on the dependent variable shown by the total determination value (Adjusted R Square) of 0.347 means that 34.7 percent of the tax aggressiveness is influenced by characteristic of executive, profitability, leverage, capital intensity, and company size while the remaining 65.3 percent is explained by other factors not included in the model.
Based on the result of the multiple linear regression analysis as presented in Table 8. the regression equation can be made as follows:
CETR = 0.056 + 0.137 RISK + 0.314 ROA – 0.158 DAR – 0.302 CAPINT + 0.171SIZE + ε
The significant value of t tests less than 0.05 for each independent variable. This show that all independent variable has a significant effect on the dependent variable. Based on the regression model, it can be interpreted that the constant value of 0.056 indicates if the variable executive characteristic, profitability, leverage, capital intensity, and company size have a value or 0 (constant), then the tax aggressiveness increased by 0.056. RISK has a coefficient value of 0.137 which indicates that there is a positive effect on tax aggressiveness. Which means that if RISK rise by one unit assuming while the other variables are considered constant, then the variable tax aggressiveness increased by 0.137. ROA has a coefficient value of 0.314 which indicates that there is a positive effect on tax aggressiveness. Which means that if ROA rise by one unit assuming and the other variables are considered constant, then the tax aggressiveness increased by 0.314. DAR has a coefficient value of -0.158 which indicates that there is a negative effect on tax aggressiveness. Which means that if DAR rise by one unit assuming and the other variables are considered constant, the tax aggressiveness decreased by 0.158. CAPINT has a coefficient value of -0.302 which indicates that there is a negative effect on tax aggressiveness. Which means that if CAPINT rise by one unit assuming and the other variables are considered constant, the tax aggressiveness decreased by 0.302. SIZE has a coefficient value of 0.171 which indicates that there is a positive effect on tax aggressiveness, which means that if SIZE rise by one unit assuming and the other variables are considered constant, then the tax aggressiveness increased by 0.171. Based on the result of the hypothesis test stated that executive characteristics had a positive effect on tax aggressiveness.
Table 7. Heteroscedasticity Test Result
|
No |
Independent Variable |
Sig. |
Description |
|
1 |
RISK |
0.081 |
Free heteroscedasticity |
|
2 |
ROA |
0.578 |
Free heteroscedasticity |
|
3 |
DAR |
0.487 |
Free heteroscedasticity |
|
4 |
CAPINT |
0.490 |
Free heteroscedasticity |
|
5 |
SIZE |
0.572 |
Free heteroscedasticity |
Source: Processed Data, 2019
Table 8. The Result of Multiple Linear Regression Analysis
|
Model |
Unstandardized Beta |
Standardized Coefficients |
T |
Sig. | |
|
B |
Std. Error |
Beta | |||
|
(Constant) |
0.056 |
0.057 |
0.975 |
0.331 | |
|
RISK |
0.137 |
0.067 |
0.123 |
2.038 |
0.043 |
|
ROA |
0.314 |
0.105 |
0.193 |
2.975 |
0.003 |
|
DAR |
-0.158 |
0.067 |
-0.148 |
-2.362 |
0.019 |
|
CAPINT |
-0.302 |
0.072 |
-0.282 |
-4.198 |
0.000 |
|
SIZE |
0.171 |
0.055 |
0.176 |
3.092 |
0.002 |
|
R Square |
0.362 | ||||
|
Adjusted R Square |
0.347 | ||||
|
F |
23.196 | ||||
|
P-value F |
0.000 | ||||
Source: Processed Data, 2019
The result of this study are consistent with research conducted by Dyreng et al., (2008), Dewi & Jati, (2014), Swingly & Sukartha (2015) which stated that when executive are risk takers, the opportunity for tax aggressiveness by the company is higher. Executive who are risk taker will tend to dare to high risks such as carrying out tax aggressiveness. Based on the result of the hypothesis test stated that profitability had a positive effect on tax aggressiveness. The result of this study a consistent with research conducted by Darmawan & Sukartha (2014), Dewi & Noviari (2017), Kim & Im (2017), Susanto et al., (2018), Rani et al., (2018), Kimsen et al., (2018). The result of this study supports the agency theory which explains that there are different in interests between company and the government in relation to taxes. Profit is the most important thing because tax imposition base of company comes from profit. When the company gets a high profit in the current period, the amount of tax paid will increase. These conditions can increase the tendency of company to carry out tax aggressiveness.
Based on the result of hypothesis test stated that profitability had a negative effect on tax aggressiveness. The result of this study a consistent with research conducted by Noor et al., (2010), Swingly & Sukartha (2015), Kimsen et al., (2018), Andhari & Sukartha (2019) which stated that interest cost can reduce the tax burden, so the higher the level of leverage then the tax aggressiveness is getting lower. The result of this study supports the agency theory, where the company has an interest in maximizing profits by low tax payment while government interests maximize corporate tax collection. It is possible for a company to use debt in financing its operational activities so that the level of leverage will affect the amount of company’s profit as a result of the interest expense.
Based on the result of hypothesis test stated that capital intensity had a negative effect on tax aggressiveness. The result of this study a consistent with research conducted by Putri & Lautania (2016), Budianti & Curry (2018), and Sinaga (2019). The result of this study supports the agency theory which stated that there is a relationship between company and the government. It is possible for company to use fixed assets to support its operations, especially in manufacturing companies that have more complex operational activities.
Based on the result of hypothesis test stated that company size had a positive effect on tax aggressiveness. The result of this study a consistent with research
conducted by Dewinta & Setiawan (2016), Alfina et al., (2018), and Ann (2019). Large firm tend to be more capable and stable in generating profits, when corporate profits are high the tax burden is high so companies tend to do tax aggressiveness. Large firm can manage their tax burden optimally because they have expert resources in the field of taxation and have a law firm that can find loopholes in the tax law so as to minimize company tax payments. The bigger the companies, the opportunity to carry out tax aggressiveness is appreciable because it has resources with superior quality.
Conclusion
This research obtained empirical evidence that executive characteristic, profitability, and company size has a positive effect on tax aggressiveness, while leverage and capital intensity has a negative effect on tax aggressiveness. Based on the conclusions from this research, the suggestions that the author can give to the tax officer is more thorough in conducting tax distribution in manufacturing companies especially in companies that have executive character, namely risk taker. Furthermore, government are expected to reevaluate punishment given to companies when conducting tax aggressiveness. If the punishment is not able to give a deterrent effect, then tax aggressiveness will continue to exits especially in companies that have risktaking executive. Then for the investors we recommend to choose companies that do not carry out tax aggressiveness by considering the value of profitability and company size. In addition, investors should choose a company that has a risk averse executive because they are less likely to take as such big risk as tax aggressiveness.
Executive character is a major factor in making a decision, including the decision to make tax aggressiveness. Profitability can be a trigger factor for the emergence of tax aggressiveness because the basis for the imposition of corporate taxes comes from the profits derived. The large firm, the transaction will be more complex and tend to have a quality resources in the financial management including tax management. While leverage and capital intensity describe company policies that incur cost and can be used as a reduction in the amount of corporate profits. When company profits decrease it can reduce tax aggressiveness.
Based on the research result, this study can be used as a reference by all parties, especially companies, investors, and the government in terms of decision making and policy. For the company, the result of this study can provide additional references related to tax aggressiveness where companies are expected to be more obedient in carrying out their tax obligations going forward. For investors, the result of this study can be taken into consideration in assessing the company’s financial statement and making investment decisions. For the Directorate General of Taxes, the research of this study can be made as research material to take tax policies more effectively in the future to improve tax actions taken by companies.
References
Adisamartha, I. B. P. F., & Noviari, N. (2015). Pengaruh Likuiditas, Leverage, Intensitas Persediaan Dan Intensitas Aset Tetap Pada Tingkat Agresivitas Wajib Pajak Badan. E-Jurnal Akuntansi Universitas Udayana, 13(3), 973–1000.
Alfina, I. T., Nurlaela, S., & Wijayanti, A. (2018). The Influence of Profitability , Leverage , Independent Commissioner , and Company Size to Tax Avoidance. The 2nd
International Conference on Technology, Education, and Social Science, 2(10), 102– 106.
Andhari, P. A. S., & Sukartha, I. M. (2019). Pengaruh Pengungkapan Corporate Sosial Responsibility, Profitabilitas, Inventory Intensity, Capital Intensity, dan Leverage Pada Agresivitas Pajak. E-Jurnal Akuntansi Universitas Udayana, 18(2017), 2115– 2142.
Ann, S. (2019). The Influence of Liquidity , Profitability , Intensity Inventory , Related Party Debt , And Company Size To Aggressive Tax Rate. Archivers of Business Research, 7(3), 105–115.
Budianti, S., & Curry, K. (2018). Pengaruh Profitabilitas , Likuiditas , dan Capital Intensity Terhadap Penghindaran Pajak (Tax Avoidance). Seminar Nasional Cendekiawan Ke 4, 1205–1209.
Chyz, J. A., & White, S. D. (2014). The Association Between Agency Conflict and Tax Avoidance: A Direct Approach. Advances in Taxation, 21, 107–138.
https://doi.org/doi:10.1108/S1058-749720140000021007
Compiled Annual Report of IDX Manufacturing Companies. (2018). Annual Report of IDX Manufacturing Companies.
Darmawan, I. G. H., & Sukartha, I. M. (2014). Pengaruh Penerapan Corporate Governance, Leverage, Return On Assets, dan Ukuran Perusahaan Pada Penghindaran Pajak. E-Jurnal Akuntansi Universitas Udayana, 1(09), 143–161.
Delgado, F. J., Fernandez-rodriguez, E., & Martinez-arias, A. (2014). Effective Tax Rates in Corporate Taxation : a Quantile Regression for the EU. Inzinerine Ekonomika-Engineering Economics, 25(5), 487–496. https://doi.org/10.5755/j01.ee.25.5.4531
Dewi, N. L. P. P., & Noviari, N. (2017). Pengaruh Ukuran Perusahaan, Leverage, Profitabilitas dan Corporate Social Responsibility Terhadap Penghindaran Pajak (Tax Avoidance). E-Journal Akuntansi Universitas Udayana, 21(1), 830–859.
Dewi, N. N. K., & Jati, I. K. (2014). Pengaruh karakter eksekutif, karakteristik perusahaan, dan dimensi tata kelola perusahaan yang baik pada tax avoidance di bursa efek indonesia, 2, 249–260.
Dewinta, I. A. R., & Setiawan, P. E. (2016). Pengaruh Ukuran Perusahaan, Umur Perusahaan, Profitabilitas, Leverage, Dan Pertumbuhan Penjualan Terhadap Tax Avoidance. E-Jurnal Akuntansi Universitas Udayana, 14(3), 1584–1613.
Dyreng, S. D., Hanlon, M., & Maydew, E. L. (2008). Long-Run Corporate Tax Avoidance. The Accounting Review, 83(1), 61–82.
Frank, M. M., Lynch, L. J., & Rego, S. O. (2009). Tax Reporting Aggressiveness and Its Relation to Aggressive Financial Reporting. The Accounting Review: American Accounting Association, 84(2), 467–496.
Irianto, B. S., Sudibyo, Y. A., & Ak, A. W. S. (2017). The Influence of Profitability , Leverage , Firm Size and Capital Intensity Towards Tax Avoidance. International Journal of Accounting and Taxation, 5(2), 33–41.
https://doi.org/10.15640/ijat.v5n2a3
Jensen, M. C., & Meckling, W. H. (1976). Theory of The Firm : Managerial Behavior , Agency Costs and Ownership Structure. Journal of Financial Economics, 3(4), 305– 360.
Julianto, P. A. (2018). Kemenperin: Industri Manufaktur Penyumbang Pajak Terbesar. Retrieved from https://www.kompas.com/read/2018/01/09/211727326/kemenperin-
industrimanufaktur- penyumbang-pajak-terbesar
Kementrian Keuangan Republik Indonesia. (2019). Mengenal Tax Ratio Indonesia. Jakarta: Direktorat Jenderal Pajak.
Kim, J. H., & Im, C. C. (2017). The Study On The Effect And Determinants Of Small - And Medium-Sized Entities Conducting Tax Avoidance. The Journal of Applied Business Research, 33(2), 375–390.
Kimsen, Kismanah, I., & Masitoh, S. (2018). Profitability, Leverage, Size of Company Towards Tax Avoidance. Jurnal Ilmiah Akuntansi Fakultas Ekonomi, 4(1), 29–36.
Kurniawati, L., & Arifin, H. (2017). Agresivitas Pajak dan Maturitas Utang. Jurnal Pajak Indonesia, 1(1), 92–106.
Liu, Z., & Wang, Y. (2017). Effect of Earnings Management on Economic Value Added : G20 and African Countries Study. South African Journal of Economic and Management Sciences, 20(1), 1–9.
Maharani, I. G. A. C., & Suardana, K. A. (2014). Pengaruh Corporate Governance, Profitabilitas, dan Karakteristik Eksekutif Pada Tax Avoidance Perusahaan Manufaktur. E-Jurnal Akuntansi Universitas Udayana, 2(09), 525–539.
Nengzih. (2018). Determinants of Corporate Tax Avoidance: Survey On Indonesia’s Public Listed Company. International Journal of Economic, Business and Management Research, 2(02), 133–145.
Noor, R., Fadzillah, N. S. M., & Mastuki, N. A. (2010). Corporate Tax Planning : A Study On Corporate Effective Tax Rates of Malaysian Listed Companies. International Journal of Trade, Economics and Finance, 1(2), 189–193.
Park, S. (2018). Related Party Transactions and Tax Avoidance of Business Groups. Sustainability, 10(10), 1–14. https://doi.org/10.3390/su10103571
Putri, C. L., & Lautania, M. F. (2016). Pengaruh Capital Intensity Ratio, Inventory Intensity Ratio, Ownership Strucutre dan Profitabilityterhadap Effective Tax Rate (ETR). Jurnal Ilmiah Mahasiswa Ekonomi Akuntansi, 1(1), 101–119.
Putri, T. R. F., & Suryarini, T. (2017). Factors Affecting Tax Avoidance on Manufacturing Companies Listed on IDX. Accounting Analysis Journal, 6(3), 407–419.
Rani, S., Susetyo, D., & Fuadah, L. L. (2018). The Effects of The Corporate’s Characteristics on Tax Avoidance Moderated by Earnings Management (Indonesian Evidence). Journal of Accounting, Finance, and Auditing Studies, 4(3), 149–169.
Sinaga, C. H. (2019). Pengaruh Leverage dan Capital Intensity pada Tax Avoidance dengan Proporsi Komisaris Independen sebagai Variabel Pemoderasi. E-Journal Akuntansi Universitas Udayana, 27(1), 1–32. https://doi.org/ 10.24843/EJA.2019.v27.i01.p01
Surya, S., & Noerlela, S. (2016). Pengaruh Profitabilitas Dan Leverage Terhadap Agresivitas Pajak (Studi Pada Perusahaan Telekomunikasi Yang Terdaftar Di Bursa Efek Indonesia Tahun 2009-2013). Jurnal Sains Manajemen & Akuntansi, VIII(1), 52–77.
Susanto, L., Yanti, & Viriany. (2018). Faktor-Faktor Yang Mempengaruhi Agresivitas Pajak. Jurnal Ekonomi, XXIII(01), 10–19.
Susilo, R. (2017). Indonesia Masuk Peringkat ke-11 Penghindaran Pajak Perusahaan,
Jepang No.3. Retrieved from
Swingly, C., & Sukartha, I. M. (2015). Pengaruh Karakter Eksekutif, Komite Audit, Ukuran
Perusahaan, Leverage, dan Sales Growth Pada Tax Avoidance. E-Jurnal Akuntansi Universitas Udayana, 1(10), 47–62.
Tiaras, I., & Wijaya, H. (2015). Pengaruh Likuiditas, Leverage, Manajemen Laba, Komisaris Independen Dan Ukuran Perusahaan Terhadap Agresivitas Pajak. Jurnal Akuntansi, XIX(03), 380–397.
Yuniarwati, Ardana, I. C., Dewi, S. P., & Lin, C. (2017). Factors That Influence Tax Avoidance in Indonesia Stock Exchange. Chinese Bussiness Review, 16(10), 510– 517. https://doi.org/10.17265/1537-1506/2017.10.005
Jurnal Ilmiah Akuntansi dan Bisnis, 2020 | 292
Discussion and feedback