Earnings Management in Companies that Missed and Beat Analyst Consensus
on
Jurnal Ilmiah Akuntansi dan Bisnis
Vol. 16 No. 1, January 2021

AFFILIATION:
1,2 Faculty of Economics and Business, Universitas Udayana, Indonesia
*CORRESPONDENCE: cesyapratiwi17@gmail.com
THIS ARTICLE IS AVAILABLE IN: https://ojs.unud.ac.id/index.php/jiab
DOI:
10.24843/JIAB.2021.v16.i01.p04
CITATION:
Pratiwi, N. M. C. & Wirama, D. G.
(2021). Earnings Management in Companies that Missed and Beat Analyst Consensus. Jurnal Ilmiah Akuntansi dan Bisnis, 16(1), 60-70.
ARTICLE HISTORY
Received:
27 January 2020
Revised:
24 June 2020
Accepted:
13 July 2020
Earnings Management in Companies that Missed and Beat Analyst Consensus
Ni Made Cesya Pratiwi 1*, Dewa Gede Wirama2
Abstract
The aim of this study is to analyze the differences of earnings management between companies that missed and beat analyst consensus. Nonfinancial companies listed in the Indonesia Stock Exchange in 2017–2018 and have analyst consensus data available are used as the research sample, which consist of 28 companies observed for four quarters. The final sample in the analysis consists of 94 observations (firm-quarters). The independent sample t-test is used for data analysis. Results show that companies that missed analyst consensus have greater discretionary accrual than the group of companies that beat analyst consensus. Therefore, differences in earnings management between companies that missed and beat analyst consensus exist. Companies that missed analyst consensus are more inclined to conduct earnings management in the following period. This finding opens the possibility to develop a new hypothesis in the positive accounting research framework.
Keywords: analyst consensus, missed and beat, earnings management.
Introduction
Analyst consensus is the average of estimates of a group of analysts who predict public companies performance (Comprix et al., 2006). The most common estimate provided by analysts is corporate earnings for the next period, presented as EPS (earnings per share). Chen (2019) stated analysts try to make estimates about how the company is doing and rely mainly on the company's financial statements to predict the state of the company in the future. A company will be perceived as well performing ifit can reach or exceed analyst consensus.
One of the Indonesian companies that present data on the achievement of analyst consensus is PT Indosat Tbk. (ISAT) as presented in Figure 1. Mandiri Sekuritas analyst Kresna Hutabarat pointed that ISAT's revenue and profit in the first quarter of 2017 were below analyst consensus, this was seen on the Yahoo Finance, (2019). Various actions had been taken by management to increase company's revenue and profits in the next period. Through CNN Indonesia (2018) reporter Dinda Audriene said the company has reduced debt by 54.7 percent to US$158.9 million from US$351 million. ISAT also added 5,849 base transceiver stations (BTS) during the first quarter of 2017. From the total

■IM .120» -140 00
Q4 2017 Ql 2018 Q2 2018 Q3 2018 Q4 2018
Missed Missed Beat Missed —
by S65.2by S155.9⅛y S55.00by S77.75 Nov 25
Figure 1. PT Indosat Tbk Missed or Beat Analyst Consensus. (ISAT)
Source: Yahoo Finance, 2019
BTS, 58 percent are 3G and 4G BTS which were expected to support increased data usage. Kresna Hutabarat also added that a large promotion would help ISAT to get customers from the community and a steady growth of mobile data revenue.
The ISAT case indicates that companies in general try to reach analyst consensus. The pressure to reach the consensus of analysts causes management to implement various strategies that help the company profit to be at or above consensus in the next period. The pressure, however, can trigger management to manage net income by conducting earnings management.
Earnings management is the choice of accounting policies or actual operational actions taken by management to influence reported earnings in order to achieve certain objectives (Scott, 2015: 445). The term ‘earnings management’ arises because of the various efforts of the management or financial statement providers to manage accounting information, especially company’s profits. Investors often use profit levels as an indicator of the success and failure of a company. Consequently, management tends inflate profit.
One of the case that shows companies conduct earnings management, even profit manipulation, when they were unable to meet analyst consensus is reflected in the case of PT Garuda Indonesia (Persero) Tbk. (GIAA). Through CNN Indonesia (2019), reporter Ulfa Arieza said that the GIAA managed to book a net profit of US$809 thousand in 2018 or equivalent to Rp11.56 billion. As a comparison, in 2017 GIAA posted a loss of US$216.58 million or equivalent to Rp3.09 trillion. Moreover, in the third quarter of 2018 GIAA was still losing money in the amount of US$114.08 million or Rp1,63 trillion, which means that the company did not reach analyst consensus for the quarter. GIAA was able to report profit by recognizing unearned revenues. It recorded the “accounts receivable” from a cooperation transaction with PT Mahata Aero Teknologi (Mahata) related to providing in-flight wifi connections as revenue in the 2018 financial statements in the amount of US$239.94 million.
Comprix et al. (2006) found indications of earnings management conducted with the purpose of meeting analyst consensus. They found that there was a difference between recognized and actual expenses, which correlated significantly with missed and
beat analyst consensus in a particular quarter. The differences were detected in the selling and administrative expenses recognized in the corresponding periods.
BeBchuk & Fried (2004) reported that Verizon Communications succeeded in exceeding analyst consensus for 2001 by changing its expected rate of return on assets of its pension plan to 9.25 percent from 9 percent in the previous year. The change resulted in higher retirement income, which finally allowed Verizon to report an EPS that was US$0.10 higher than analyst consensus of US$3.01. Using that information as an illustration, Lee et al (2014) found that defined benefit pension plans are widely used to manipulate earnings to reach or exceed analyst consensus through changes in assumptions on the plan, especially assumptions about expected rates of return from pension plan assets.
Different from Comprix et al (2006) and Lee et al (2014), this study compares earnings management in companies whose profit exceed (beat) and does not reach (missed) analyst consensus. Companies that missed consensus analysts have stronger motivation to conduct earnings management as an effort to avoid the occurrence of the condition a second time in a row. Missed consensus analysis conditions in a row can greatly affect investor confidence in the company, and can further reduce trust in management capabilities as an agent.
Agency theory explains the relationship between principals and agents (Jensen & Meckling, 1976). The relationship is seen as a contractual relationship between the principal who assigns the agent to carry out certain tasks. In the context of company management, management is an agent who carries out the duties assigned by shareholders (company owners) as principals (Baridwan, 2000). In general, the task is to maximize the welfare of the principal through maximizing the value of the company.
Eisenhardt (1989) stated that agency theory uses three assumptions of human nature, that is: (1) humans are generally self-interested, (2) humans have limited thought power (bounded rationality), and (3) humans always avoid risk (risk averse). Assumption of human nature can cause management as an agent to act opportunistically or prioritize his personal interests. Watts & Zimmerman (1986) stated that agent’s compensation is often determined by accounting numbers, which triggers agents to think about how the accounting numbers can be used as a means to maximize their interests. One of the actions of the agent is earnings management.
The tendency of management to conduct earnings management is also triggered by the fact that principal cannot observe the agent's efforts directly. An evaluation of an agent's efforts is made through observing the final results of the agent's performance, namely profits, which are considered to reflect an increase in the company's value (Basu, 1995). In this case, earnings management is carried out to maintain management's reputation as an agent.
Earnings management is suspected to appear or be carried out by the company's management or the providers of financial statements and it is happened because of motivation by the management that is expected from that actions (Agustia & Suryani, 2018). Barkhordar & Tehrani (2015) stated earnings management practice is not an act of fraud, but it is a legal action. Hence, this effort is recognized and allowed by the accounting standards, as long as the company was clear in reported financial statements (Kurniawansyah, 2018). According to Astari & Suryanawa (2017) earnings management actions is carried out by the management by choose accounting policies of a certain standard with the aim of maximized the welfare of the management and the company's
performance. Accounting principles provide freedom for management to choose the accounting methods that the company wanted to use in accordance with company goals (Astika, 2010). According to Sedianingsih & Naimah (2015), a company could perform well if the achieved performance above the analyst consensus figure. A number of achievement above analyst consensus predictions could increase the performance of company. That is, it could increase analysts recommendations on a company.
Positive accounting theory predicts the choice of accounting policies by management and how management will respond to the proposed new accounting standards (Scott, 2015). Watts & Zimmerman (1986) stated that the development of positive accounting theory cannot be separated from dissatisfaction with normative theory. They developed a positive approach that is more oriented toward empirical researches explaining the various accounting techniques or methods that are chosen, or looking for new models to develop accounting theory in the future. Positive accounting theory is based on the proposition that management, shareholders and regulators are rational and each prioritizes their own interests, which are directly related to compensation and their welfare. The choice of an accounting policy by several groups depends on the relative comparison of costs and benefits of various accounting procedures. The prediction of positive accounting theory is outlined in the three hypotheses formulated by Watts & Zimmerman (1986), which are the bonus scheme hypothesis, the debt contract hypothesis, and the political cost hypothesis. The hypothesis of this research is related to management compensation, the amount of which is more or less determined by the principal's perception of the reputation or capability of management. Earnings management is expected in order to avoid missing analysts consensus consecutively. It is an effort of management to maintain reputation.
As described in the foregoing background, it is predicted that companies that missed analyst consensus are more likely to conduct earnings management compared to companies that beat analysts’ consensus. This research is focused on non-financial companies that have analysts consensus data. Financial companies such as banks and other financial institutions are subject for various regulations that cause the reported profit figures and ratios being incomparable to the numbers on the financial statements of non-financial companies. As an affirmation, the research hypothesis is: Companies that missed analysts consensus are more inclined to conduct earnings management compared to companies that beat analyst consensus.
Research Method
This research was conducted at non-financial companies listed on the Indonesia Stock Exchange (IDX). Companies data was obtained from the IDX's official website. Analysts consensus examined in this study is consensus about corporate EPS. Achievement of analyst consensus is measured using dummy variable which gives a value of 1 for companies that beat analyst consensus and 0 for companies that missed analyst consensus. Information about missed and beat analysts consensus were obtained from Yahoo! Finance.
Earnings management is detected by discretionary accruals. The use of accruals to detect earnings management was popularized by Healy (1985). He defined accruals as the difference between net income and cash flow from operating activities. A positive difference (net income greater than cash flow from operating activities) is considered to
be the result of an income increasing earnings management. The greater the value of the accruals, the greater the income increasing earnings management.
Later, the use of total accruals as proxy for earnings management is considered inappropriate because not all of the accruals are the results of accounting policy choices in the framework of earnings management (Suyono, 2017). A certain portion of the accrual is resulted from company's obligation to comply with certain regulations, such as the obligation to make an allowance for doubtful accounts. Still another portion is resulted from common business practices, such as in determining the amount of the allowance. Thus, total accruals contain elements of discretionary and non-discretionary items, and only the discretionary component of the accruals is appropriate to be used as a proxy for earnings management.
An initial attempt to separate the discretionary component from total accruals was carried out by Jones (1991) in her study of whether companies that would benefit from import relief policies reduced income through earnings management practices during the import relief investigation by the United States International Trade Commission. Relief import policies, for example, could be in the form of increased import duty and reduction of quotas for importers. The use of accounting figures as basis for decision making in the context of implementing the policies provided incentives for companies to conduct income decreasing earnings management to increase the possibility of obtaining import relief from the government. Jones predicted that companies that have potential benefits from import protection chose accounting policies that reduced reported earnings during the investigation period of the International Trade Commission. The estimate used to measure earnings management was discretionary accruals.
Jones (1991) assume that accruals related to sales are naturally non-discretionary. Later, to capture the possibility of an element of discretion in sales accruals, Dechow et al (1995) proposed modifications to the Jones model. The results of these modifications are now known as the Modified Jones Model. This model is used to estimate discretionary accruals in this study. Modified Jones Model is chosen because it can detect earnings management better than other models (Dechow et al., 1995). The following are the four steps of discretionary accrual estimation in the Modified Jones Model.
Firstly, total accruals are calculated, that is, net income less operating cash flow
as presented in Equation 1.
Secondly, we estimate the regression coefficient (β) with multiple linear regression presented in Equation 2.
TAt / At-ι =^1(1∕At-1) +^2(ΔREV√At-1) +β3(PPE√At) + ε (2)
Thirdly, the regression coefficient from Equation 2 is used to calculate non-discretionary accruals, as presented in Equation 3.
NDAit =Λ1(l∕At-1) +A2((ΔREVt-ΔRECt)∕At-ι) +β3(PPE√At-1) (3)
Lastly, discretionary accruals as a measure of earnings management are calculated by subtracting the non-discretionary accruals calculated in Equation 3 from total accruals, as presented in Equation 4.
Notes:
TAit = Total accruals of company i in period t.
NIit = Net income of the company i in period t.
CFOit = Cash flow from operating activities of company i in period t.
Ait-1 = Total assets of company i in period t-1.
ΔRevit = Change in revenue from period t-1.
ΔRecit = Change in receivable from period t-1.
PPEit = Property, plant and equipment of company i in period t.
NDAit = Nondiscretionary accruals of company i in period t.
DAit = Discretionary accruals of company i in period t.
ɛ = Error term.
Data used in the calculation of discretionary accruals are manually picked directly from the company's financial statements. This study uses quarterly data and therefore each period is one quarter.
The research sample is all non-financial companies listed on the Indonesia Stock Exchange starting in the fourth quarter of 2017 until the third quarter of 2018, in accordance to the periods of analyst consensus data availability at Yahoo! Finance. The analysis technique used to test the research hypothesis is independent sample t-test.
Result and Discussion
The number of non-financial companies listed on the Indonesia Stock Exchange at the end of the third quarter of 2018 was 597 companies. However, there are only 28 companies that had analyst consensus data from the fourth quarter of 2017 to the third quarter of 2018. Thus, the number of observations in the initial analysis was 112 firmquarter. The number was then reduced to 94 firm-quarter due to exclusion of outliers from the sample.
Independent sample t-test requires homogeneous variance in sample groups. The requirement was tested by Levene's Test of Homogeneity of Variance. The test results using the initial 112 observation syndicated that the requirement was not fulfilled. It was caused by observations that have values far from the average. To overcome the problem, mean-trimming technique was used.
Devore (2011) stated that mean-trimming is done by trimming the lowest and highest values between 5 percent to 25 percent of the total sample. In this study, data was cut at 7.5 percent on each side. The number of observations that were further analyzed was 94 firm-quarter. Table 1. presents the results of the variance homogeneity test after the mean-trimming procedure.
The Levene's Test basically tests the null hypothesis that variance is homogeneous. If the Levene's statistics significance value is equal to or less than the required level of significance, in this case 0.05, then it is concluded that the null hypothesis is rejected. Conversely, if the significance level is more than 0.05 then the null hypothesis is accepted (variance is declared homogeneous). Table 1. shows the
Table 1. Homogeneity Variance Test Results
|
Levene's Statistic |
Sig. |
Notes | |
|
Discretionary Accruals Based on Mean (DA) |
0.517 |
0.474 |
Variances are homogeneous |
Source: Processed data, 2019
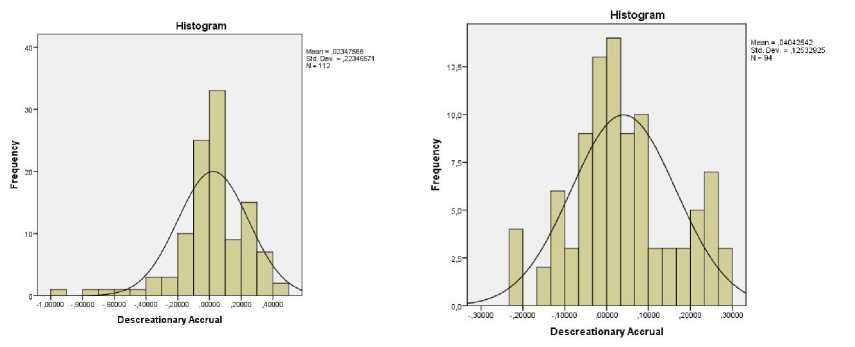
Figure 2. Distribution of data before (left) and after (right) mean trimming Source: Processed data, 2020
Levene's statistics value of 0.517 with a significance level of 0.474. Therefore, it can be stated that the variance homogeneity requirements are met. Figure 2. shows the differences in the distribution of data before and after the mean trimming was done, presented in the histograms.
To obtain a more complete picture of the quality of research data, a normality test was also carried out using the Kolmogorov-Smirnov test. Table 2. presents the results of the test. Similar to Levene's Test of Homogeneity of Variance, the Kolmogorov-Smirnov Test basically tests the null hypothesis that data is normally distributed. Table 2. shows the significance values of 0.471, which is above the predetermined level of significance of 0.05. Therefore, it is concluded that the research data is normally distributed.
Table 3. presents descriptive statistics of the research variables. The value of discretionary accruals (DA) for the whole sample ranges from -0.2215 to 0.2992 with an average of 0.0404 and a standard deviation of 0.1253. Even though the data is normally distributed and satisfies the variance homogeneity requirements, the standard deviation value which reaches about three times the mean indicates that the research data has a high variation.
The lowest value of DA is -0.2215, which means that there were companies that did income decreasing earnings management. This condition was observed in both the missed and beat analyst consensus groups. In the overall sample, there were 37 (39 percent) observations with negative DA. However, a positive average value indicates that on average income increasing earnings management were more prevalent.
Discretionary Accruals in the missed analyst consensus group ranged from -0.1659 to 0.2992 with mean value of 0.0616 and standard deviation of 0.1245. One-sample t-test shows the average value is different from zero (t-statistic=3.705; sig.=0,000), indicating the occurrence income increasing earnings management. Of the
Table 2. Normality Test Results
|
N |
Asymp. Sig. (2-tailed) |
Notes | |
|
Discretionary Accruals (DA) |
94 |
0.471 |
Data normally distrubuted |
Source: Processed data, 2019
|
Table 3. Descriptive Statistics | |
|
Discretionary N Accruals (DA) |
Mean Standard Minimum Maximum Deviation |
|
Missed group 56 Beat group 38 All sample 94 |
0.0616 0.1245 -0,1659 0.2992 0.0091 0.1214 -0,2215 0.2512 0.0404 0.1253 -0,2215 0.2992 |
Source: Processed data, 2019
56 observations in this group, there were 19 (34 percent) observations with negative DA and 37 (66 percent) observations with positive DA. So, again, most of the earnings management actions in this group are classified as income increasing earnings management.
DA in the beat analyst consensus group ranged from -0.2215 to 0.2512 with mean value of 0.0091 and standard deviation of 0.1214. One-sample t-test shows the average value is not different from zero (t-statistic=0.464; sig.=0.646), indicating that earnings management in this group is not statistically insignificant. Of the 38 observations in this group, there were 18 (47 percent) observations with a negative DA and 20 (53 percent) observations with a positive DA. So, there were about the same occurrence of income increasing and income decreasing earnings management in this group.
The average DA in the group of companies that missed analyst consensus was nearly 577 percent (0.0616 versus 0.0091) of the average DA in the group of companies that beat consensus analysts. There were 85 percent (37 compared to 20) more income increasing earnings management in the group of companies that missed the analyst consensus. However, inference can only be made after a statistical test of the difference is conducted. The test carried out was independent sample t-test, which tested the statistical significance of the difference in mean DA in the two sample groups.
The hypothesis of this study was tested using an independent sample t-test. The purpose of the test is to compare the mean of two groups that are not paired with or related to each other. The test results are presented in Table 4.
Table 4. shows the t-statistic of 2.027 with significance level of 0.046, smaller than the specified significance level of 0.05. Thus, it can be concluded that there is a statistically significant difference between the average value of discretionary accruals in the group of companies that missed analysts’ consensus and the group of companies that beat analysts’ consensus. The group of companies that missed the analysts’ consensus had an average value of discretionary accruals of 0.0616. This figure is almost seven times the value of discretionary accruals in the group of companies that beat analysts’ consensus, which has an average value of discretionary accruals of 0.0091. The results of the analysis support the research hypothesis, namely that the group of companies that missed analysts’ consensus are more inclined to conduct income increasing earnings management compared to the group of companies that beat
Table 4. Hypothesis Testing Results
|
t |
df |
Sig. (2-tailed) |
Notes | |
|
Discretionary Accruals (DA) |
2,027 |
92 |
0.046 |
Significant group difference |
Source: Data processing, 2019
analysts’ consensus. In other words, meeting or exceeding the prediction of analysts in one period results in different earnings management actions in the next period.
Conclusion
Based on the results of data analysis that have been presented, it can be concluded that there are differences in earnings management between companies that missed analysts consensus and companies that beat analysts consensus. These earnings management practices are mostly carried out by companies that have missed analysts consensus. The finding can be an indication that management is concerned about its reputation if the company missed analysts consensus successively.
In general, part of management's compensation is determined by its success in achieving certain targets. Achieving profit targets stated as analyst predictions also has the potential to affect the amount of management compensation. In this connection, the findings of this study indirectly support the hypothesis of a bonus scheme in positive accounting theory.
The phenomenon revealed in this study, namely the existence of income increasing earnings management in companies that missed analysts’ consensus, can also be seen as an indication of management concern about its reputation if the company fails to reach analysts’ consensus consecutively. This possibility is worth exploring in greater depth because it has the potential to open the opportunities for developing new hypotheses in positive accounting theory related to other then management compensation, debt contracts, and political costs.
This research is also expected to make a positive contribution to investors or potential investors. The attainment of analyst consensus is generally seen as a good news that tends to be responded positively. Comprix et al (2006) and Lee et al (2014) showed that the achievement of analysts’ consensus can be the results of earnings management, and therefore it is recommended that investors do not rush to react positively to the achievement of analysts’ consensus. This research shows that it need to be extra careful to response especially when the company failed to reach analysts’ consensus in previous period. In other words, achieving analysts’ consensus in a period is not necessarily a good news because it could be the result of earnings management, and failure to reach analysts’ consensus in the previous period is an additional warning about the possibility of earnings management.
The existence of outliers in the research data which is then excluded from the sample will be a limitation of the study if the outliers contain information that significantly influences the outcome of the study. Future studies can conduct more indepth studies specifically to study the observations which have extreme values.
As stated earlier, earnings management by companies that missed analysts’ consensus can be an indication of management's concern about the impact on their reputation if the company missed analysts’ consensus in succession. Future studies can explore this aspect of reputation in the context of accounting policy choices to develop new hypotheses within the framework of positive accounting theory.
Earnings management can be motivated by both opportunistic and efficient contracting motives (Scott, 2015: 445). Earnings management is said to be opportunistic if done by management in the framework of fulfilling its own interests. On the other hand, earnings management is an efficient contracting mechanism if it is done in order to improve the welfare of the principal through increasing the value of the company.
Therefore, it is possible that the income increasing earnings management in the period following a missed analyst’s consensus period are motivated by the desire to maintain the principal’s welfare. Further research can be conducted to determine the motives behind those earnings management practices.
References
Agustia, Y. P., & Suryani, E. (2018). Pengaruh Ukuran Perusahaan, Umur Perusahaan, Leverage, dan Profitabilitas Terhadap Manajemen Laba (Studi pada Perusahaan Pertambangan yang Terdaftar di Bursa Efek Indonesia Periode 2014-2016).
Jurnal Aset (Akuntansi Riset), 10(1), 63–74.
Arieza, U. (2019). Menyoal Laba BUMN yang Mendadak Kinclong. CNNIndonesia.
Astari, A. A. M. R., & Suryanawa, I. K. (2017). Faktor-Faktor Yang Mempengaruhi
Manajemen Laba. E-Jurnal Akuntansi Universitas Udayana, 20(1), 290–319.
Astika, I. B. P. (2010). Manajemen Laba Dan Motif yang Melandasinya. Jurnal Ilmiah Akuntansi Dan Bisnis, 5(1), 1–15.
Audriene, D. (2018). Di Bawah Ekspektasi, Laba Kuartal I Indosat Turun 19.9 Persen. CNNIndonesia.
Baridwan, Z. (2000). Perkembangan Teori dan Penelitian Akuntansi. Jurnal Ekonomi Dan Bisnis Indonesia, 15(4), 486–497.
Barkhordar, M., & Tehrani, R. (2015). Investigating The Effect of Free Cash Flow, Dividend and Financial Leverage on Earnings Management in Listed Companies in Tehran Stock Exchange. International Journal Of Humanities and Cultural Studies, 127–143.
Basu, S. (1995). Properties of Accounting Earnings in Not-For-Profit Organizations.
Journal of Accounting and Economics, 24, 3–37.
BeBchuk, L., & Fried, J. (2004). Pay Without Performance: The Unfulfilled Promise of Executive Compensation. Harvard University Press, 125–126.
Chen, J. (2019). Consensus Estimate, Investopedia. Diunduh dari Investopedia website: https://www.investopedia.com/terms/c/consensusestimate.asp
Comprix, J., Mills, L., & Schmidt, A. (2006). Earnings Management to Meet or Beat Analyst Earnings Forecasts Through Changes in Interim Expenses. Working Paper, 34(1), 31–53.
Dechow, P. M., Sloan, R. G., & Sweeney, A. P. (1995). Detecting Earnings Management. The Accounting Review, 70, 193–225.
Devore, J. L. (2011). Probability and Statistics for Engineering and The Sciences (8th ed.). San Luis Obispo:California Polytechnic State University.
Eisenhardt, K. M. (1989). Agency Theory: An Assessment and Review. Academy of Management Review, 14(1), 57–74.
Healy, P. (1985). The Effect of Bonus Schemes on Accounting Decisions. Journal of Accounting and Economics, 7, 85–10.
Jensen, N., & Meckling, W. (1976). Theory of the Firm: Managerial Behavior, Agency Cost and Ownership Structure. Journal of Financial Economics, 3(4), 305–360.
Jones, J.J. (1991). Earnings Management During Important Relief Investigations. Journal of Accounting Research, 29(2), 193–228.
Kurniawansyah, D. (2018). Apakah Manajemen Laba Termasuk Kecurangan? : Analisis Literatur. Jurnal Riset Akuntansi Dan Bisnis Airlangga, 3(1),341–356.
Lee, Y. W., Yu, T., & Zhang, T. (2014). Do Corporations Manipulate Earnings to Meet or Beat Analysts’ Forecasts? Evidence from Pension Plan Assumption Changes. Review of Accounting Studies, 19(2), 698-735.
Scott, W. R. (2015). Financial Accounting Theory (6th edition). Toronto: Pearson Education Canada.
Sedianingsih, & Naimah, Z. (2015). Penilaian Pasar Terhadap Manajemen Laba. Jurnal Ekonomi Dan Bisnis, 25(1), 1–12.
Suyono, E. (2017). Berbagai Model Pengukuran Earnings Management: Mana yang Paling Akurat. Sustainable Competitive Advantage FEB UNSOED, 7(1), 303–324.
Watts, R., & Zimmerman, J. (1986). Positive Accounting Theory. Cambridge: Prentice Hall.
Yahoo. (2019). Yahoo Finance - Business Finance, Stock Market, Quotes, News. Yahoo Finance. http://finance.yahoo.com/quote/ISAT.JK/diakses tanggal 29/09/2019
Jurnal Ilmiah Akuntansi dan Bisnis, 2021 | 70
Discussion and feedback