Tax Authority Versus Peer Communication: The Influence of Trust, Service Climate, and Voluntary Cooperation
on
Tjondro, Patuli, Andrianto and Julitha, Tax Authority Versus ... 61
Tax Authority Versus Peer Communication: The Influence of Trust, Service
Climate, and Voluntary Cooperation
Elisa Tjondro1
Lajuntri Patuli2
Richard Andrianto3
Delitha Julitha4
-
1,2,3,4Faculty of Business and Economics, Universitas Kristen Petra, Indonesia
email: elisatjondro@petra.ac.id
DOI: https://doi.org/10.24843/JIAB.2020.v15.i01.p06
Jurnal Ilmiah Akuntansi dan Bisnis
(JIAB)
Volume 15
Issue 1
January 2020
Page 61 - 74
p-ISSN 2302-514X
e-ISSN 2303-1018
ARTICLE INFORMATION:
Received:
22 May 2019
Revised:
25 November 2019
Accepted:
15 January 2020
ABSTRACT
This research is the first study to discuss the combined influence of peer communication and tax authority communication on taxpayers’ trust in tax institutions, perceptions of service climate, and voluntary cooperation. We also compare the influences of the tax authorities and peer communication on trust, service climate, and voluntary cooperation. The survey was conducted in 2019 and represented five major cities in Indonesia (Jakarta, Surabaya, Semarang, Bandung, and Denpasar). Respondents included 120 self-employed taxpayers in two business fields, namely, trade/production and services/professions. The respondents mainly included those from the millenial and generation X age groups due to their significant contribution to the tax revenue. Participants were recruited using quota sampling, and the data analysis tools included partial least square with Wrap-PLS software. Results show that tax authority communication is more powerful in influencing trust, perception of service climate, and voluntary cooperation, than peer communication.
Keywords: Peer communication, tax authority communication, trust, service climate, voluntary cooperation.
INTRODUCTION
Trust can be built through effective communication because communication plays a vital role in shaping consumer perceptions (Ball et al., 2004). (Liu & Horsley, 2007) showed that government communication would build closer relations with citizens. Trust to the government will also emerge if the information provided, either directly or through the websites, is well conveyed (Schaupp, Carter, & McBride, 2010). Trust can arise from good communication patterns, especially if the information obtained from the government is accurate (Kogler, Muehlbacher, & Kirchler, 2013). A good pattern of communication between the two parties will ultimately have an impact on increasing voluntary cooperation (Kogler et al., 2013). (Hofmann, Beverungen, Räckers, & Becker, 2013) stated that we need to concern the communication between the government and citizens and also mainly on how the community receives and responds to the
communication. Proper communication can be done in two ways. First, transparency or openness of the government by providing information about what the government is doing (Chun, et al., 2010). Second, participation can make the public establish good relations with the government because the public knows the development of the information. The form of excellent and targeted government’s communication is expected to increase the taxpayers’ level of trust (Chun et al., 2010).
In our research, we focus on how society responds to several types of tax authority communication, like online communication (live chat, twitter, and email), regular communication (telephone), and written communication (print media). Farrar & Thorne (2016) stated that the type of communication most widely used by tax authorities is written communication. This means that generally, the government has not utilized direct and online communication with taxpayers (Hofmann et al.,
2013). (Mergel, 2013) also stated that the impact of government communication through social media is still very lacking. Proper government communication and the ability to communicate online and offline to the taxpayers can increase trust (Ball et al., 2004; Wei, et al., 2015). In Indonesia, the new role of the Director General of Taxes (DGT) in the last two to three years that was most prominent was the existence of the “Taxmin”. Taxmin is a DGT employee in each regional office that manages four social media platforms, namely Facebook, Twitter, Instagram, and Youtube (Taxes, 2019b). Although only two to three years of age, “Taxmin” has helped DGT win national awards in the category of social media at the 4th Public Relations Indonesia Awards 2019. DGT social media managed to record quite a high follower growth (Taxes, 2019a). This study attempts to examine the effect of the role of DGT communication through social media on service climate and voluntary cooperation.
We believe that tax authorities’ communication influences the perception of service climate and voluntary cooperation. In the service climate model, the relationship between taxpayers and tax authorities is likened to “service & clients,” which is intended to be taxpayers and tax authorities working together under the applicable standards and requirements (Gangl, et al., 2015). The service climate is based on professionalism and benevolence services, which will result in the voluntary cooperation of taxpayers (Gangl, et al., 2016). The service climate plays a vital role in governance and becomes essential for taxpayer satisfaction. One of the advantages of a service climate is taxpayers accept tax authorities as legitimate tax collection institutions and accept to work together (Gangl, et al., 2012). Taxpayers perceive tax authority to work for the benefit of the community and provide responses to their obligations as part of the same community (Gangl et al., 2012). Molenmaker, et al. (2018; 2016) states that giving rewards through praise (communication) and gifts will enhance collaboration and minimize noncooperation. It means communication between taxpayers and the tax authority institution is needed to enhance voluntary cooperation.
This study also believes that peer communication affects trust, service climate, and voluntary cooperation of taxpayers. Generally, many peer communication involves social media. Peer communication emphasizes on online communication, where the internet (social media) as a communication
tool makes it easy for us to interact, exchange information with anyone (Wang, et al., 2012). Peer communication plays a role as a factor that influences the level of trust in a product or service (Wang et al., 2012). Peer communication is assumed to be a factor in the occurrence of norms that have a particular role (Wartick & Rupert, 2010). Someone will tend to think “what other people do,” including peers or individuals, will follow what most people do (Wenzel, 2004). In general, people will often make decisions or choices based on the people around them (Bursztyn, et al., 2014). The role of peers as friends of discussion will provide an honest review of something discussed, and inevitably people will be more likely to believe or be influenced by peers (Yu, et al., 2004). Peer communication be the essential reference group to form a communication pattern because they trust each other and even share the social identity and have interests with the same references (Cotterell, 2007). They can share their identities and information because they believe that the information they share with others will be safe and secure (Ge, Figueiredo, Jaiswal, et al., 2003). (Bursztyn et al., 2014) showed that peer communication also plays a vital role in influencing other friends to decide whether to invest in the financial market.
In this study, we used two generations, namely generation X (born in 1965 to 1979) and millennial (1980 to 2000) (Jurney, et al., 2017) because they are the largest generation of taxpayers (Tjondro, et al., 2019). Researchers assume that the most suitable system to maximize tax revenue for both generations is through voluntary cooperation. These two generations also proved to prefer the application of hard power and soft power in a balanced manner by the tax authority in Indonesia (Tjondro, et al., 2019). Hard power and soft power in combination might be perceived as legitimate expert power (Tjondro, et al., 2019), increase trust by creating the impression that free riders will be penalized while supporting honest taxpayers in order to achieve high-level tax compliance (Hofmann, et al., 2014). Based on the current conditions in Indonesia, it is tough to rely solely on enforced compliance systems because the number of tax officers compares with taxpayers in Indonesia is 1: 7700 (Misbakhun, 2018).
The contribution of this study is the first study that examines the influence of tax authority communication on trust, perception of service climate, and voluntary cooperation. Through communication, the tax authority can fortify or prevent the circulation
of bad news about the tax institution. Through massive communication, the level of trust, perception of service climate, and voluntary cooperation continue to increase. Second, this research is the first to compare the effect of tax authority communication and peer communication on trust, perception of service climate, and voluntary cooperation. We found that tax authority communication had a more significant influence on trust, service climate, and voluntary cooperation than peer communication.
Theory of normative social behavior (NSBT) developed by Rimal & Real (2005) and also used in research (Geber, et al., 2019; Geber, et al., 2019; Real & Rimal, 2007) proves that the existence of interaction or communication influenced individual behavior (Geber, et al., 2019). (Geber, et al., 2019) uses NSBT to see whether there is an influence of peer communication. It is necessary to know first normative social influences on decisions and risk behavior to explain in more detail the role of peer communication concerning normative social influences (Real & Rimal, 2007). These two types of norms can be referred to as norms about what has done compared to what norms should be done (Chung & Rimal, 2016; Rimal & Lapinski, 2015), which influences individual behavior through interaction in groups. Communication between peers is a substantial factor in determining normative social
behavior (Southwell & Yzer, 2007). These normative factors may have a direct impact on the formation of someone’s behavior (Jang, et al., 2013).
Siahaan (2012) defines communication as a way or activity to convey information through the exchange of ideas, messages, or information such as speech, writing, or actions and behavior. Excellent communication will always be associated with the quality and quantity of the information delivered (Siahaan, 2012). The research of (Liu & Horsley, 2007) shows that communication built by the government will build closer relations with citizens. For example, Twitter’s social media can be used to form relationships between tax authorities and taxpayers on an ongoing basis through tax socialization and opening questions on Twitter accounts. The government communication that delivered either directly or through websites can be successful if the government can build relationships through giving the information that needed and give the answer to the questions of taxpayers (Schaupp et al., 2010).
DGT communication via social media is regulated in the Tax Law, the Law of Public Services, and the regulation of Minister of Finance (table 1). The Act and the regulation are explained that the tax authority communication is carried out with the aim of improving public services, providing legal certainty, and increasing trust in public services.
Act of Republic of Indonesia number 6 the This law was prepared with the aim of providing justice, year 1983 that has been changed into Act improving services to taxpayers, increasing certainty, and law number 16 the year 2009 concerning enforcement.
General Provision and Tax Procedures
Act of Republic of Indonesia number 25 This law was prepared with the aim of the tax authorities being the year 2009 concerning Public Services obliged to serve every citizen to fulfill tax rights and obligations and to build public trust in public services.
Regulation of Minister of Finance number This law was prepared with the aim of improving the 174 the year 2012 organization and work procedure of the information office and
complaints services of the Director General of Taxes (DGT).
Sources: (Republic of Indonesia, 2012);(Republic of Indonesia, 2009a); (Republic of Indonesia, 2009b)
The main task of government authorities is to report decisions and actions through the media to offset negative information about the government that citizens receive in the media (Liu & Horsley, 2007). This communication will build a very close relationship with citizens (Liu & Horsley, 2007) so that it will raise a high level of trust. Trust can arise from good communication patterns, especially if information obtained from the government is accurate, and will
directly affect the trust of the government and will also have an impact on individual compliance (Kogler et al., 2013). Based on the explanation, the first hypothesis is
H1: Tax authority communication affects trust
The tax authority believes that taxpayers are citizens who are responsible for carrying out their obligations, then taxpayers also see the tax authority
as a partner who can honestly manage tax returns. Trust in the tax authority will also be high because taxpayers consider tax authorities to carry out their duties properly according to applicable rules (Gangl et al., 2016). Taxpayers not only follow existing laws but also have high enthusiasm to obey the law and see tax payments as a moral obligation (Braithwaite, 2017). High and low level of trust of the tax authority determines the perception of taxpayers concerning service climate (Gangl et al., 2012). Trust in the tax authority has a significant influence on the perception of service climate (Gangl et al., 2015). Based on the explanation, the hypothesis are
H2: Tax authority communication affects service climate
H3: Tax authority communication affects service climate through trust as a mediating variable
(Hofmann et al., 2013) in their research stated that the most important thing is not only communication between the government and citizens. However, it is essential to give attention how the community receives and responds to the communication. The information contained in government communication will also increase the cooperation and compliance of taxpayers (Farrar & Thorne, 2016). Thus our study sets the hypothesis based on the above explanation: H4: Tax authority communication affects voluntary
cooperation
H5: Tax authority communication affects voluntary cooperation through service climate as a mediating variable
(Yong & Martin, 2017) gave statement that the influence of peer communication is inseparable from how an individual makes decisions. For example, Asian people like to gather and tend to have at least a community, so that the level of decision making affects the group where the person is located (Yong & Martin, 2017). In contrast to western culture, which tends to be individualistic, westerns may only be influenced by their families who tend to have their perceptions and beliefs in seeing things (Yong & Martin, 2017). In this case, what we need to know is that a person does not always take a paradigm, selfish, and rational nature but instead follows the situation or group they are in (Yong & Martin, 2017). It means that the level of individual adherence will be influenced by the group as long as they believe that there are social penalties that they get if they do not
follow their group (Alm, 2014). Someone will tend to think “what others do,” which means individuals will follow what most other people do (Wenzel, 2004). Peer influences individuals in making decisions (Real & Rimal, 2007), especially the decision about trusting the tax authority. Based on the explanation, the hypothesis is
H6: Peer communication affects trust
The results of media analysis have shown that peer communication has a vital role in the process of forming social norms of society, and influences behavior and actions (Wartick & Rupert, 2010). (Geber, et al., 2019) uses the theory of normative social behavior (NTSB) to see the influence of peer communication. Understanding the role of peer communication concerning the risk of norm development does not only contribute to the theoretical understanding of normative social influences (Southwell & Yzer, 2009) but also communication that occurs between peers is a substantial factor in the formation of norms and behavior (Southwell & Yzer, 2007). Coercion from the government is not enough to increase an individual’s tax, but rather an environmental factor in which a person will grow and have a doctrine about taxes (Rothengatter, 2005). One of the environments is peers. (Rothengatter, 2005) argues that the environment or peer has a significant role in contributing to the individual level of tax compliance. H7: Peer communication affects voluntary cooperation
In service climate, the tax authority is considered a professional institution and performs the rules well, by providing services to its clients or taxpayers (Alm & Torgler, 2011; Braithwaite, 2017). So that the condition will improve compliance (Farrar & Thorne, 2016). Besides, taxpayers give trust to the tax authorities in the hope that the tax authorities can carry out their duties under the rules so that taxpayers pay taxes voluntarily (Kirchler, et al., 2008). Trust in tax authority gives a good perception of service climate and finally increase the voluntary cooperation of taxpayers (Gangl et al., 2016). Trust in the tax authority has a significant influence on service climate as well as on voluntary cooperation (Gangl et al., 2015). Based on the literature and studies described earlier, the researcher sets the hypothesis as follows: H8: Peer communication affects service climate
H9: Peer communication affects service climate through trust as a mediating variable
H10: Peer communication affects voluntary cooperation through service climate as a mediating variable
Based on the identification of variables and hypotheses, the research model can be illustrated in Figure 1.
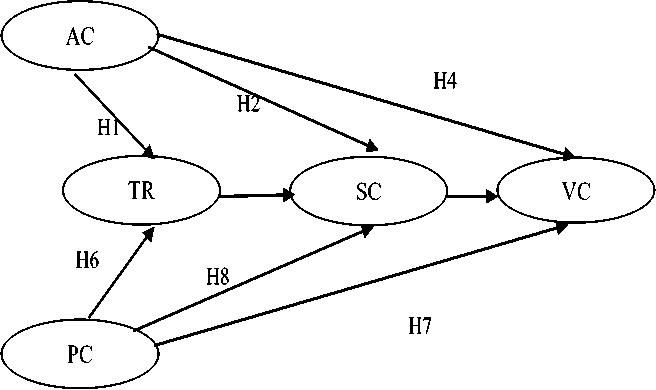
PC: Peer communication; AC: Authority communication; TR: Trust; SC: Service climate;
VC: Voluntary cooperation
Figure 1. Research Model
Source: Processed Data, 2019
RESEARCH METHOD
Respondents in this study are individual taxpayers who were self-employed in two business fields, namely retail/production and services/ professions, which are domiciled in the cities of Jakarta, Surabaya, Semarang, Bandung, and Denpasar. The research sample was 1 20 respondents. The sampling technique used quota sampling with the following criteria: (1) the respondent is an registered taxpayer, (2) the number of respondents who own a business in the retail/ production or services/profession are equal (3) the number of male and female respondents are equal, (4) respondents represent X and Millennial generation, (5) respondents used social media to communicate about taxes and used tax authority services (email/live chat/twitter/telephone), (6) respondents represent the method of “bookkeeping and recording” to calculate income tax, bookkeeping and recording methods are determined based on business circulation in a year which is higher than 4.8 billion or smaller than 4.8 billion Rupiah.
There are several reasons for using the six criteria of respondents. Criteria number four aims to get the right respondent where the respondent use
social media and is an active taxpayer when the survey is conducted. Criteria number two is used with the aim that respondents surveyed are only selfemployed taxpayers who use the self-assessment system to calculate their own taxes so that they are relevant to voluntary cooperation in this study. Criteria number three and six aim to reduce the bias of research results (Jurney et al., 2017).
The measurement used for each variable in this study is a seven-point Likert scale. The use of a seven-point scale in this survey aims to distinguish slightly favorable, moderately favorable, and extremely favorable feelings towards an object. According to (Krosnick & Presser, 2010), the use of a seven-point scale is appropriate. The Likert scale is a proper measurement for this study because it directs respondents to be able to give an opinion about agreeing or not to a question (Cooper & Schindler, 2014). Variables related to this study are peer communication, tax authority communication, trust, service climate, and voluntary cooperation, which are measured by a Likert scale from strongly disagree to strongly agree.
This study measure peers communication using three indicators, direct persuasion, state norms,
highlighting positive aspects of paying tax (Onu & Oats, 2018). We modified the questionnaire (Wang et al., 2012) for tax authority communication. Authority communication indicators use several types of communication used by tax authority institutions, namely online communication, written communication, and face to face communication. We combined and modified questions of previous research (Alghamdi & Rahim, 2016; Wang et al., 2012). For trust
variables, researchers used three indicators, relevant goals, competence & benevolent, and supported. Our study combined and modified the questions from (McAllister, 1995) and (Gangl et al., 2015) concerning the trust. We use the perception of service orientation as an indicator of service climate (Gangl, et al., 2015). Voluntary co-operation uses questions modified from (Gangl et al., 2015). The questionnaire is in the Table 2.
Survey Questions
PC1 My friend encouraged me to pay and report taxes correctly
PC2 My friend encourages to report all income in the tax return
PC3 My friend in the social media group suggested obeying to pay taxes
PC4 My friend and I discussed the positive impact of tax on the country in social media
PC5 I read in the social media group about the benefits of paying taxes
AC1 Email service and “,kring pajak” (live chat, twitter, and telephone) answer all the obstacles that I experienced
AC2 Communication with tax employees is easier and more convenient with email services and “kring pajak" (live chat, Twitter and telephone)
AC3 The latest tax rules information through newspapers and magazines, greatly help my tax obligations
AC4 Tax seminars and training held by the Directorate General of Taxes effectively helped my obstacles
TR1 I rely entirely on the information on the website of the Director General of Taxes (www.pajak.go.id) to answer my taxation problems
TR2 I believe in the tax authority because I agree with their vision
TR3 I trust the tax authorities because they work competently and professionally
TR4 I trust the tax authorities because they complete the task well
SC1 The relations between tax authorities and taxpayers such as companies and clients
SC2 The relationship between tax authorities and taxpayers is service oriented
SC3 When I pay taxes, I do it because the Directorate General of Taxes might respond to my cooperative actions
VC1 When I pay taxes, I do it because the Directorate General of Taxes treats me properly as long as I admit my mistake
VC2 When I pay taxes, I do it because the Directorate General of Taxes helps taxpayers who make unintentional mistakes
VC3 I pay taxes because it is easier than use tricks againts the tax authorities
Source: Processed Data, 2019
RESULTS AND DISCUSSION
The questionnaires were distributed in three stages. The first step was determining the criteria for respondent validity included in the survey sample, which is taxpayers, self-employment in the retail/ production business or services/profession, aged 19 - 54 years (Millennials and X generations), used social media to discuss tax with peers, and communicated with tax services (email/live chat/twitter/telephone). Respondents who did not meet these criteria were excluded from testing. The second stage was determined by the quota sampling criteria based on
gender and income tax calculation methods. The respondent tested must represent both the male and female groups, as well as the “bookkeeping” and “recording” method group. The third stage of questionnaire distribution was carried out based on convenience sampling in a face-to-face and online form. The total number of respondents who responded was 164 respondents. Of the total questionnaires responded, only 120 respondents (73.17%) met the criteria and could be further processed.
|
Table 3. Profile and Demographic Summarry of Respondents | |||
|
Criteria |
Value Label |
Frequency (n) |
Percentage |
|
Gender |
Man |
48 |
40% |
|
Woman |
72 |
60% | |
|
Generation |
Milennials |
102 |
85% |
|
X |
18 |
15% | |
|
Business Type |
Retail/production |
23 |
19.17% |
|
Services/profession 81 |
67.5% | ||
|
Other (both) |
16 |
13.33% | |
|
Business Location (City) |
Jakarta |
23 |
19.17% |
|
Bandung |
15 |
12.5% | |
|
Semarang |
22 |
18.33% | |
|
Surabaya |
52 |
43.33% | |
|
Denpasar |
19 |
15.83% | |
|
Gross Income Calculation |
< 4,8 Billion Rupiah 101 |
84.17% | |
|
Method |
> 4,8 Billion Rupiah 19 |
15.83% | |
|
Using social media to |
Very Often |
10 |
8.333% |
|
communicate about taxes |
Often |
44 |
36.67% |
|
Rarely |
66 |
55% | |
|
Using email/live |
Very Often |
7 |
5.833% |
|
chat/Twitter/phone to |
Often |
32 |
26.67% |
|
communicate with DGT |
Rarely |
81 |
67.5% |
|
Source: Processed Data, 2019 | |||
|
Table 4. shows the average value of all indicators |
for authority communication (AC), the highest mean | ||
|
used. The highest mean in peer communication (PC) |
is on the question of AC2 (5.2 points out of 7) that | ||
|
variables is PC3 (5.27 out of 7) with the indicator of |
the communication with the tax authorities through | ||
|
state norms. This shows that in |
communication |
live chat/twitter/ telephone is more comfortable and | |
|
between peers on social media, topics about the norm |
more convenient, according to the respondents. | ||
|
of paying taxes is the most discussed. Meanwhile, | |||
Table 4. Descriptive Statistics Data for Variables
|
Indicator |
Mean |
Range (Percent) |
Standard Deviasi |
|
PC1 |
5.13 |
73.33 |
1.14 |
|
PC2 |
5.05 |
72.14 |
1.09 |
|
PC3 |
5.27 |
75.35 |
1.07 |
|
PC4 |
5.04 |
72.02 |
1.29 |
|
PC5 |
4.96 |
70.95 |
1.37 |
|
AC1 |
4.94 |
70.59 |
1.06 |
|
AC2 |
5.2 |
74.28 |
1.09 |
|
AC3 |
5.13 |
73.33 |
1.03 |
|
AC4 |
5.04 |
72.02 |
1.11 |
|
TR1 |
5.17 |
73.92 |
1.09 |
|
TR2 |
5.16 |
73.80 |
1.15 |
|
TR3 |
5.27 |
75.35 |
1.04 |
|
TR4 |
5.23 |
74.76 |
1.00 |
|
SC1 |
5.22 |
74.64 |
1.19 |
|
SC2 |
5.45 |
77.97 |
1.09 |
|
SC3 |
5.2 |
74.28 |
1.10 |
|
VC1 |
5.29 |
75.59 |
1.04 |
|
VC2 |
5.19 |
74.16 |
1.08 |
|
VC3 |
5.36 |
76.66 |
1.25 |
|
Source: Processed Data, 2019 | |||
|
Table 5. shows that all indicators met the validity |
brackets must be higher than the cross-loading value. | ||
|
requirements with a loading value of > 0.50. |
Convergent validity is acceptable if the Loading value | ||
|
According to (Kock & Lynn, 2012), the loading value |
is above 0.5, and the P-value is below 0.05 (Hair, | ||
|
and cross-loading that meet the convergent validity |
Black, Babin, & Anderson, 2014). Cross loading must | ||
|
standard are in the range of -1 to 1, and the value in |
be smaller than the loading value. | ||
|
Table 5. Score Loading and Cross Loading | ||||||
|
Indicator |
PC |
AC |
TR |
SC |
VC |
P-Value |
|
PC1 |
(0.724) |
-0.036 |
-0.016 |
-0.229 |
0.132 |
<0.001 |
|
PC2 |
(0.652) |
0.048 |
0.079 |
-0.018 |
0.161 |
<0.001 |
|
PC3 |
(0.774) |
0.315 |
-0.078 |
-0.050 |
-0.052 |
<0.001 |
|
PC4 |
(0.654) |
-0.359 |
-0.044 |
0.109 |
0.038 |
<0.001 |
|
PC5 |
(0.577) |
-0.023 |
0.084 |
0.251 |
-0.320 |
<0.001 |
|
AC1 |
0.211 |
(0.664) |
0.035 |
0.154 |
-0.189 |
<0.001 |
|
AC2 |
-0.077 |
(0.720) |
-0.036 |
0.104 |
-0.261 |
<0.001 |
|
AC3 |
-0.156 |
(0.640) |
-0.303 |
-0.195 |
0.468 |
<0.001 |
|
AC4 |
0.021 |
(0.707) |
0.278 |
-0.074 |
0.020 |
<0.001 |
|
TR1 |
-0.028 |
-0.163 |
(0.745) |
0.112 |
-0.016 |
<0.001 |
|
TR2 |
0.194 |
-0.103 |
(0.724) |
0.044 |
-0.138 |
<0.001 |
|
TR3 |
-0.011 |
0.120 |
(0.767) |
-0.228 |
0.219 |
<0.001 |
|
TR4 |
-0.147 |
0.137 |
(0.758) |
0.078 |
-0.073 |
<0.001 |
|
SC1 |
0.078 |
0.125 |
0.024 |
(0.757) |
-0.151 |
<0.001 |
|
SC2 |
-0.073 |
-0.174 |
0.114 |
(0.737) |
-0.161 |
<0.001 |
|
SC3 |
-0.007 |
0.046 |
-0.140 |
(0.733) |
0.318 |
<0.001 |
|
VC1 |
0.244 |
-0.293 |
0.103 |
0.029 |
(0.768) |
<0.001 |
|
VC2 |
-0.406 |
0.226 |
-0.025 |
0.282 |
(0.729) |
<0.001 |
|
VC3 |
0.158 |
0.088 |
-0.088 |
-0.332 |
(0.686) |
<0.001 |
|
Source: Processed Data, 2019 | ||||||
Table 6 presents the test values, which reveal with the correlation coefficient value smaller than that the discriminant validity is fulfilled for all variables the AVE square value.
|
Table 6. AVE’s Square Root and Correlation Coefficient | |||||
|
PC |
AC |
TR |
SC |
VC | |
|
PC |
(0.679) |
0.627 |
0.344 |
0.439 |
0.355 |
|
AC |
0.627 |
(0.683) |
0.465 |
0.460 |
0.446 |
|
TR |
0.344 |
0.465 |
(0.749) |
0.556 |
0.547 |
|
SC |
0.439 |
0.460 |
0.556 |
(0.742) |
0.610 |
|
VC |
0.355 |
0.446 |
0.547 |
0.610 |
(0.728) |
|
Source: Processed Data, 2019 | |||||
|
The composite reliability must be more than 0.7 |
are |
acceptable when each value is above 0.5 (A. | |||
|
(Kock & Lynn, 2012). The results of the composite |
M. Dall’Oglio et al., 2010; I. Dall’Oglio et al., 2015; | ||||
|
reliability of all variables are more than 0.7 (table 7) |
Nguyen et al., 2019) | ||||
|
so that it is acceptable. All Cronbach’ |
s alpha values | ||||
|
Table 7. Composite Reliability and Cronbach’s Alpha | |
|
Variable |
PC AC TR SC VC |
|
Composite Reliability Cronbach’s Alpha |
0.809 0.778 0.836 0.786 0.772 0.705 0.619 0.738 0.592 0.556 |
S ource: Processed Data, 2019
variables in a study. The recommended values are 0.02, 0.15, and 0.35 for small, medium, and large, respectively
Table 8. shows the effect size of each indicator in this study. Effect size is used to measure how much value or influence each indicator has on latent
|
Table 8. Effect Size | |
|
Indicator PC |
AC TR SC |
|
PC AC TR 0.045 SC 0.079 VC 0.033 |
0.222 0.093 0.294 0.178 0.265 |
Source: Processed Data, 2019
Figure 2 shows the β and p-value to test the significant level of the hypothesis. Direct variables between variables showed in this figure.
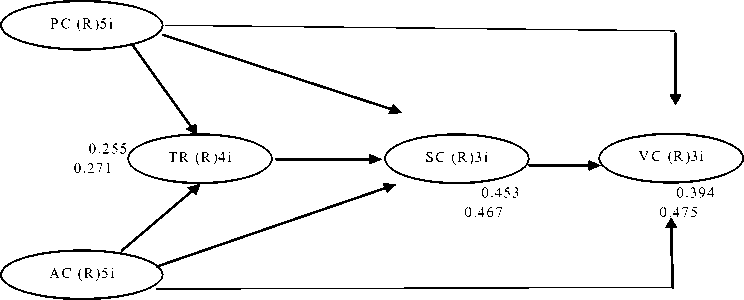
Figure 2. Structural Model
Source: Processed Data, 2019
Table 9 shows the direct and indirect effects between variables. The direct link between AC and TR shows a p-value <0.01 with β value 0.440, which shows a significant positive link, meaning H1 is accepted. Direct links between AC and SC also show significant positive results (H2 accepted) with p-value 0.015 and β value 0.192. The indirect effect between AC, TR, and SC shows a significant positive link with p-value <0.001 and β value 0.210 or H3 accepted. The direct link between AC and VC also shows a significant positive result (p-value <0.001
and β value 0.319, meaning H4 is accepted. The indirect effect between AC, SC, and VC shows a significant positive link with p-value 0.097 (significant at α 10%) and β value 0.210, meaning H5 is accepted. The direct link between PC and TR; PC and SC also shows significant positive, so that H6 and H8 are accepted. The test results show that the direct link between PC and VC is not significant, and indirect links between PC, TR, SC, and PC, SC, VC also are not significant. However, H7, H9, and H10 are rejected.
Table 9. Inner Model Result
|
Direct Effect |
Indirect Effect |
Total Effect | |||
|
0.440 | |||||
|
AC |
→ |
TR |
p<0.001 0.192 p=0.015 |
0.210, |
0.402 |
|
AC |
→ |
SC |
p <0.001 AC→TR→SC | ||
|
0.319 p<0.001 |
0.083, |
0.402 | |||
|
AC |
→ |
VC |
p = 0.097 AC→SC→VC | ||
|
PC |
→ |
TR |
0.128 p=0.076 0.181 p=0.020 |
0.061 |
0.242 |
|
PC |
→ |
SC |
p=0.170 PC→TR→SC | ||
|
-0.086 p=0.170 |
0.078 |
-0.008 | |||
|
PC |
→ |
VC |
p=0.111 PC→SC→VC | ||
S ource: Processed Data, 2019
We found that the effects of authority communication to the trust, service climate, and voluntary compliance, showed strong significant
effects (Table 9). It explained that Millennials and X generations make an individual assessment on every information they get from all resources, including the
internet, social media, and print media. Millennials and X taxpayers considered all the tax information coming from DGT as ways to help, simplify, and get closer to taxpayers so that taxpayers can perform their obligations in a simple way. This was the duty of tax authority as a legitimate expert power in the view of Millennials and X generations (Tjondro, Setiabudi, et al., 2019). This also confirms the H3 test results, where authority communication affects the perception of service climate through trust. The tax authority is more trusted by the Millenials and X generations because they get reliable information and served as clients. This trust is formed as a result of quality reviews or discussions and certainly helps in various ways, such as providing the information and helping in solving problems (Schaupp et al., 2010; B.G. Southwell & Yzer, 2007; Wang et al., 2012).
On the contrary, based on the result, it can be concluded that peer communication only had a significant effect on perceptions of service climate, but low influence on trust and does not affect the voluntary compliance (table 10). It explained that all the presumptions about peer communication as a factor in the occurrence of norms (Wartick & Rupert, 2010), as a reference in making decisions and choices, and as a reference of discussions to provide honest reviews (Yu et al., 2004), only has a strong effect on perception of service climate and weak effect on trust of DGT. This result describes the overall picture of Millennial and X taxpayers that they do not rely on their decisions about tax institutions on several individual peers.
Table 10. Comparison of β Value on Authority and Peer Communication
|
Direct effect |
β |
p-value | ||
|
AC |
→ |
TR |
0.440 |
Strong significant |
|
PC |
→ |
TR |
0.128 |
Weak significant |
|
AC |
→ |
SC |
0.192 |
Strong significant |
|
PC |
→ |
SC |
0.181 |
Strong significant |
|
AC |
→ |
VC |
0.319 |
Strong significant |
|
PC |
→ |
VC |
-0.086 |
Not significant |
Source: Processed Data, 2019
institutions, perception of service climate, and voluntary cooperation rather than peer communication on all three. Table 10 shows the authority communication and peer communication to have a significant effect on the trust of the tax authority institution. Nevertheless, the value of β between AC and TR is higher than PC and TR, meaning authority communication has a more significant influence on trust than the effect of peer
communication on the trust of the tax institution. We also found authority communication has a stronger influence on climate service perceptions than peer communication on the perception of service climate. The influence of authority communication on voluntary cooperation proved to be higher than peer communication because peer communication proved not to affect voluntary cooperation.
Table 11. Mean of Each Indicator of Authority Communication
|
Indicator |
AC1 |
AC2 |
AC3 |
AC4 |
|
Mean |
4.94 |
5.2 |
5.13 |
5.04 |
Source: Processed Data, 2019
Based on Table 11. The AC2 indicator has the highest average than others (5.2 out of 7). This shows that the taxpayers agree concerning authority communication with taxpayers through online communication (e-mail, live chat, telephone, and Twitter). This means that taxpayers, especially the X generation and Millennial generation, really enjoy and like this way of communication because it is more
comfortable and more convenient and time-effective. The second-highest average indicator is AC3 question (5.13 out of 7), which is about print media (newspapers and magazines). The taxpayers are much helped by disseminating the latest tax rules through print media so that the taxpayers can have an information update.
CONCLUSION
Our research found that authority is more powerful in effecting trust and perception of service climate of tax institution, and voluntary cooperation rather than peer communication. This means taxpayers in this era, Millennials, and X generations, have more trust in authority communication than peer communication in terms of taxation. Image of the tax institution has a more direct influence on trust, perception of service climate, and voluntary cooperation in terms of taxpayers’ assessment of the tax institutions. This is an advantage that needs to be utilized by the Directorate General of Taxes (DGT).
We also found that taxpayers prefer tax authority communication through online communication (e-mail, live chat, telephone, and Twitter) and print media (newspapers and magazines) than other regular media. This means that taxpayers, especially the Millennial and X generation, really enjoy and like this way of communication because it is more comfortable, more convenient and time-effective. Millennials and generation X is the most significant tax contributors to the country. Therefore, their needs based on technology must be considered including in authority communication.
This study has several limitations. This study uses non-probability sampling, which is quota sampling, which has weaknesses in determining samples that tend to be subjective for researchers because they are carried out in the number or quota desired by researchers. The results of this study apply in the location sector that we input as the research target, but it must be noted that it cannot be used in general (depending on where the research was conducted). For better research results for further research in population, sampling needs to be considered further.
REFERENCES
Alghamdi, A., & Rahim, M. (2016). Development of a measurement scale for user satisfaction with e-tax systems in Australia, 64–83. https:// doi.org/10.1007/978-3-662-53416-8
Alm, J. (2014). Expanding the theory of tax compliance from individual to group motivations. A Handbook of Alternative Theories of Public Economics, 260–277. https://doi.org/ 10.4337/9781781004715.00020
Alm, J., & Torgler, B. (2011). Do Ethics Matter/ ? Tax Compliance and Morality, 635–651. https:// doi.org/10.1007/s10551-011-0761-9
Ball, D., Simões Coelho, P., & Machás, A. (2004). The role of communication and trust in explaining customer loyalty. European Journal of Marketing (Vol. 38). https://doi.org/ 10.1108/03090560410548979
Braithwaite, V. (2017). Dancing with tax authorities: Motivational postures and non-compliant actions. Taxing Democracy: Understanding Tax Avoidance and Evasion, (January 2003), 15– 40.
Bursztyn, L., Ederer, F., Ferman, B., & Yuchtman, N. (2014). Understanding Mechanisms Underlying Peer Effects: Evidence From a Field Experiment on Financial Decisions. Econometrica, 82(4), 1273–1301. https:// doi.org/10.3982/ecta11991
Chun, S. A., Shulman, S., Sandoval, R., & Hovy, E. (2010). Government 2.0: Making connections between citizens, data, and government. Information Polity, 15(1–2), 1–9. https:// doi.org/10.3233/IP-2010-0205
Chung, A., & Rimal, R. N. (2016). Social Norms: A Review. Review of Communication Research, 4(June), 1–28. https://doi.org/10.12840/ issn.2255-4165.2016.04.01.008
Cooper, D. R., & Schindler, P. S. (2014). Business Research Methods, 12th Edition. https:// doi.org/https://www.academia.edu/34618043/ Business_Research_Methods_12th_Edition_-_Donald_R_Cooper_
Cotterell, J. (2007). Social networks in youth and adolescence. London: Routledge. https:// doi.org/https://doi.org/10.4324/9780203007488
Croasdell, D., Mcleod, A., & Simkin, M. G. (2011). Why don ’ t more women major in information systems/ ? Information Technology & People, 24(2), 158–183. https://doi.org/10.1108/ 09593841111137340
Dall’Oglio, A. M., Rossiello, B., Coletti, M. F., Caselli, M. C., Ravà, L., Di Ciommo, V., … Pasqualetti, P. (2010). Developmental evaluation at age 4: Validity of an Italian parental questionnaire. Journal of Paediatrics and Child Health, 46(7–8), 419–426. https://doi.org/10.1111/j.1440-1754.2010.01748.x
Dall’Oglio, I., Nicolò, R., Di Ciommo, V., Bianchi, N., Ciliento, G., Gawronski, O., … Raponi, M. (2015). A Systematic Review of Hospital Foodservice Patient Satisfaction Studies. Journal of the Academy of Nutrition and Dietetics, 115(4), 567–584. https://doi. org/ 10.1016/j.jand.2014.11.013
Farrar, J., & Thorne, L. (2016). Written Communications and Taxpayers’ Compliance: An Interactional Fairness Perspective, 64(2), 351.
Gangl, K., Hofmann, E. B., Pollai, M., & Kirchler, E. (2012). The Dynamics of Power and Trust in the “Slippery Slope Framework” and its Impact on the Tax Climate. Ssrn Electronic Journal, 1–27.
Gangl, K., Hofmann, E., Hartl, B., & Kirchler, E. (2016). Power of authorities and trust in authorities determine the interaction climate and tax compliance. Contemporary Issues in Taxation Research, 2(April), 87–102. Retrieved from https://www.researchgate.net/publication/ 301547030
Gangl, K., Hofmann, E., & Kirchler, E. (2015). Tax authorities’ interaction with taxpayers/ : A conception of compliance in social dilemmas by power and trust. New Ideas in Psychology, 37, 13–23. Retrieved from http://dx.doi.org/10.1016/ j.newideapsych.2014.12.001
Ge, Z., Figueiredo, D. R., Jaiswal, S., Kurose, J., & Towsley, D. (2003). Modeling peer-peer file sharing systems. Proceedings - IEEE INFOCOM, 3(C), 2188–2198. https://doi.org/ 10.1109/infcom.2003.1209239
Geber, S., Baumann, E., Czerwinski, F., & Klimmt, C. (2019). The Effects of Social Norms Among Peer Groups on Risk Behavior: A Multilevel Approach to Differentiate Perceived and Collective Norms. Communication Research. https://doi.org/10.1177/0093650218824213
Geber, S., Baumann, E., & Klimmt, C. (2019). Where Do Norms Come From? Peer Communication as a Factor in Normative Social Influences on Risk Behavior. Communication Research, 46(5), 708–730. https://doi.org/10.1177/ 0093650217718656
Hair, J. F., Black, W. C., Babin, B. J., & Anderson, R. E. (2014). Multivariate Data Analysis (MVDA). Pearson. https://doi.org/10.1002/ 9781118895238.ch8
Hair, J. F., Ringle, C. M., & Sarstedt, M. (2011). PLS-SEM: Indeed a silver bullet. Journal of Marketing Theory and Practice, 19(2), 139– 151. https://doi.org/10.2753/MTP1069-6679190202
Hofmann, E., Gangl, K., Kirchler, E., & Stark, J. (2014). Enhancing tax compliance through coercive and legitimate power of tax authorities by concurrently diminishing or facilitating trust in tax authorities. Law and Policy, 36(3), 290– 313. https://doi.org/10.1111/lapo.12021
Hofmann, S., Beverungen, D., Räckers, M., & Becker, J. (2013). What makes local governments’ online communications successful? Insights from a multi-method analysis of Facebook. Government Information Quarterly, 30(4), 387–396. https://doi.org/ 10.1016/j.giq.2013.05.013
Jang, S. A., Rimal, R. N., & Cho, N. A. (2013). Exploring Parental Influences in the Theory of Normative Social Behavior: Findings From a Korean High School Sample. Communication Research, 40(1), 52–72. https://doi.org/10.1177/ 0093650211407061
Jurney, S., Rupert, T., & Wartick, M. (2017). Generational differences in perceptions of tax fairness and attitudes towards compliance. Advances in Taxation. https://doi.org/10.1108/ S1058-749720170000024004
Kirchler, E., Hoelzl, E., & Wahl, I. (2008). Enforced versus voluntary tax compliance/ : The ‘“ slippery slope “’ framework. Journal of Economic Psychology, 29, 210–225. https:// doi.org/10.1016/j.joep.2007.05.004
Kock, N., & Lynn, G. . (2012). Lateral Collinearity and Misleading Results in Variance-Based SEM: An Illustration and Recommendations. Journal of The Association for Information Systems, 13(7), 546–580.
Kogler, C., Muehlbacher, S., & Kirchler, E. (2013). Trust, Power, and Tax Compliance: Testing the “Slippery Slope Framework” Among SelfEmployed Taxpayers. SSRN Electronic Journal. https://doi.org/10.2139/ssrn.2294886
Krosnick, J. A., & Presser, S. (2010). Question and Questionnaire Design. In Handbook of Survey Research (2nd Edition) (pp. 263–313). San Diego: Elsevier. https://doi.org/https:// web.stanford.edu/dept/communication/faculty/ krosnick/docs/2009/2009_handbook_ krosnick.pdf
Liu, B. F., & Horsley, J. S. (2007). The government communication decision wheel: toward a public relations model for the public sector. Journal of Public Relations Research, 19(4), 377–393. https://doi.org/10.1080/10627260701402473
McAllister, D. J. (1995). The Academy of Management Journal Volume 38 issue 1 1995 [doi 10.2307 %2F256727] Daniel J. McAllister — Affect-and Cognition-Based Trust as Foundations for Interpersonal Cooperation in Organizations (1).pdf, 38(1), 24–59.
Mergel, I. (2013). The social media innovation challenge in the public sector. ICT, Public
Administration and Democracy in the Coming Decade, 17, 71–82. https://doi.org/10.3233/978-1-61499-244-8-71
Misbakhun, H. M. (2018). Reformasi Perpajakan Untuk Meningkatkan Kesadaran Pajak: disampaikan pada seminar “meningkatkan kesadaran pajak.” Jakarta: disellenggarakan oleh Ditjen Pajak Kementerian Keuangan RI.
Molenmaker, W. E., de Kwaadsteniet, E. W., & van Dijk, E. (2019). The effect of decision timing on the willingness to costly reward cooperation and punish noncooperation: Sanctioning the past, the present, or the future. Journal of Behavioral Decision Making, 32(3), 241–254. https:// doi.org/10.1002/bdm.2110
Molenmaker, W. E., Kwaadsteniet, E. W. De, & Dijk, E. Van. (2016). Organizational Behavior and Human Decision Processes The impact of personal responsibility on the ( un ) willingness to punish non-cooperation and reward cooperation. Organizational Behavior and Human Decision Processes, 134, 1–15. https:/ /doi.org/10.1016/j.obhdp.2016.02.004
Nguyen, M. C., Gabbe, S. G., Kemper, K. J., Mahan, J. D., Cheavens, J. S., & Moffatt-Bruce, S. D. (2019). Training on mind-body skills: Feasibility and effects on physician mindfulness, compassion, and associated effects on stress, burnout, and clinical outcomes. Journal of Positive Psychology, 00(00), 1–14. https:// doi.org/10.1080/17439760.2019.1578892
Onu, D., & Oats, L. (2018). Tax Talk: An Exploration of Online Discussions Among Taxpayers. Journal of Business Ethics, 149(4), 931–944. https://doi.org/10.1007/s10551-016-3032-y
Overview, H., & Bandura, A. (1986). Social Cognitive Theory Of Learning, 1–7.
Real, K., & Rimal, R. N. (2007). Friends talk to friends about drinking: Exploring the role of peer communication in the theory of normative social behavior. Health Communication, 22(2), 169– 180. https://doi.org/10.1080/10410230701454254
Republic of Indonesia. Penetapan Peraturan Pemerintah Pengganti Undang-undang Nomor 5 Tahun 2009 Tentang Perubahan Keempat Atas Undang-undang Nomor 6 Tahun 1983 Tentang Ketentuan Umum dan Tata Cara Perpajakan Menjadi Undang-undang (2009). https://doi.org/ http://www.dpr.go.id/dokjdih/document/uu/ UU_2009_16.pdf
Republic of Indonesia. Undang-undang Republik Indonesia Nomor 25 Tahun 2009 Tentang Pelayanan Publik (2009). https://doi.org/http://
pelayanan.jakarta.go.id/download/regulasi/ undang-undang-nomor-25-tahun-2009-tentang-pelayanan-publik.pdf
Republic of Indonesia. (2012). Memorandum of Understanding between the Ministry of Finance and the Indonesian National Police MOU-1 / MK.09 / 2012 concerning law enforcement in the field of taxation.
Rimal, R. N., & Lapinski, M. K. (2015). A ReExplication of Social Norms, Ten Years Later. Communication Theory, 25(4), 393–409. https:/ /doi.org/10.1111/comt.12080
Rimal, R. N., & Real, K. (2005). How Behaviors are Influenced. https://doi.org/10.1177/ 0093650205275385
Rothengatter, M. R. (2005). Social networks and tax (non-)compliance in a multicultural nation: Emerging themes from a focus-group study among ethnic minorities in Australia. International Journal of Entrepreneurial Behaviour and Research, 11(4), 280–314. https://doi.org/10.1108/13552550510603306
Schaupp, L. C., Carter, L., & McBride, M. E. (2010). E-file adoption: A study of U.S. taxpayers’ intentions. Computers in Human Behavior, 26(4), 636–644. https://doi.org/10.1016/ j.chb.2009.12.017
Siahaan, F. O. P. (2012). The Influence of Tax Fairness and Communication on Voluntary Compliance/ : Trust as an Intervening Variable. International Journal of Business and Social Science, 3(21), 191–198.
Southwell, B. G., & Yzer, M. C. (2007). The Roles of Interpersonal Communication in Mass Media Campaigns. Annals of the International Communication Association, 31(1), 420–462. https://doi.org/10.1080/23808985.2007.11679072
Southwell, B. G., & Yzer, M. C. (2009). When (and Why) Interpersonal Talk Matters for Campaigns. Communication Theory, 19(1), 1–8. https:// doi.org/10.1111/j.1468-2885.2008.01329.x
Taxes, D. G. of. (2019a). Laporan tahunan dan media sosial Ditjen Pajak sabet PRIA 2019. https:// doi.org/https://www.pajak.go.id/id/berita/ laporan-tahunan-dan-media-sosial-ditjen-pajak-sabet-pria-2019
Taxes, D. G. of. (2019b). Taxmin: baru, tidak terlihat, nyata. https://doi.org/https://www.pajak.go.id/ artikel/taxmin-baru-tidak-terlihat-nyata
Tjondro, E., Santosa, K. G., & Prayitno, N. (2019). Perceptions of service-orientation and trust of tax officers between millennials, x, and baby
boomers. MIX: Jurnal Ilmiah Manajemen, 9(1), 1–18.
Tjondro, E., Setiabudi, J., & Joyo, A. C. (2019). Intergenerational Perceptions of Coercive and Legitimate Power. Jurnal Economia, 15(1), 96–113. https://doi.org/10.21831/economia. v15i1.23998
Wang, X., Yu, C., & Wei, Y. (2012). Social Media Peer Communication and Impacts on Purchase Intentions: A Consumer Socialization Framework. Journal of Interactive Marketing, 26(4), 198–208. https://doi.org/ 10.1016/j.intmar.2011.11.004
Wartick, M. L., & Rupert, T. J. (2010). The effects of observing a peer’s likelihood of reporting income on tax reporting decisions. Advances in Taxation (Vol. 19). Elsevier. https://doi.org/ 10.1108/S1058-7497(2010)0000019005
Wei, W., Ma, J., & Wang, L. (2015). The “warm” side of coldness: Cold promotes interpersonal
warmth in negative contexts. British Journal of Social Psychology, 54(4), 712–727. https:// doi.org/10.1111/bjso.12108
Wenzel, M. (2004). The social side of sanctions: Personal and social norms as moderators of deterrence. Law and Human Behavior, 28(5), 547–567. https://doi.org/10.1023/B:LAHU. 0000046433.57588.71
Yong, D. S., & Martin, F. (2017). Tax Compliance and Cultural Values: The Impact of “Individualism and Collectivism” on the Behaviour of New Zealand Small Business Owners. SSRN Electronic Journal, (February 2016), 289–320. https://doi.org/10.2139/ ssrn.2804417
Yu, B., Singh, M. P., & Sycara, K. (2004). Developing trust in large-scale peer-to-peer systems. 2004 IEEE 1st Symposium on Multi-Agent Security and Survivability, 1–10. https://doi.org/10.1109/ massur.2004.1368412
Discussion and feedback