Strategic Performance Measure, Innovativeness, Enterpreuneurship and Strategic Outcomes
on
Yuliansyah, Strategic Performance ... 197
p-ISSN 2302-514X
e-ISSN 2303-1018
STRATEGIC PERFORMANCE MEASURES, INNOVATIVENESS, ENTREPRENEURSHIP, AND STRATEGIC OUTCOMES
Yuliansyah1
1University of Lampung, Lampung, Indonesia email: yuliansyah@feb.unila.ac.id
ABSTRACT
This study investigates the extent to which strategic performance measures (SPM) could enhance innovativeness and entrepreneurship by studying middle level of management in Indonesian financial institutions. The study analysed 157 data points using smartPLS. The study found that SPM leverages differentiation strategy only through innovativeness, rather than through entrepreneurship. This study also suggests that financial institutions in Indonesia should focus on innovativeness to differentiate themselves from their rivals, rather than trying to undercut rivals in price. Low-cost schemes cannot benefit those firms without innovativeness.
Keywords: Entrepreneurship, innovativeness, strategic outcomes, strategic performance measures
PENGUKURAN KINERJA STRATEGIK, INNOVASI, KEWIRAUSAHAAN, DAN KELUARAN STRATEGIK
ABSTRAK
Tujuan penelitian menginvestigasi seberapa besar sistem pengukuran kinerja dapat meningkatkan inovasi dan kewirausahaan. Pada penelitian ini saya menggunakan survey studi pada manager level menengah di lembaga keuangan di Indonesia. Penulis menganalisis 157 responden menggunakan SmartPLS. Penulis menemukan bahwa sistem pengukuran kinerja dapat meningkatkan strategi berbasis differensiasi melalui inovasi dibandingkan dengan kewirausahaan. Penelitian ini menyarankan bahwa lembaga keuangan di Indonesia sebaiknya fokus pada innovasi untuk menghasilkan diferensiasi produk dalam berkompetisi dengan pesaing dibandingkan kempetisi pada harga murah. Strategi menggunakan harga lebih rendah tidak memberikan manfaat lebih bagi perusahaan dalam berinovasi.
Kata Kunci: Kewirausahaan, inovasi, keluaran strategik, pengukuran kinerja strategik
DOI: https://doi.org/10.24843/JIAB.2018.v13.i02.p12
INTRODUCTION
Due to the rapid developments in global competition and technology, a company must introduce significant new products and services in order to maintain its competitive advantage(Akroyd and Maguire, 2011). Indeed, the way for an organization to sustain competitive advantage is by supporting its own entrepreneurs and innovators. The role of management is simply to support innovation and entrepreneurship (Davila and Foster, 2008; Davila, Foster, and Li, 2009a; Davila, Foster, and Oyon, 2009b).
Currently, management control systems involve resource-based theories (Davila et al., 2009b; Henri, 2006), a recent phenomenon (Davila and Foster, 2008). Although, previous studies about the relationship between SPM and strategic objective shows a significant contribution in the field, very few study
links those to the RBV theory. Henri (2006, p. 530) suggested in his statement “Despite considerable interest in the relationship between management control systems (MCS) and strategy, the MCS literature has devoted scant attention to the RBV”. Morever, links between management control systems and entrepreneurship on the one hand, and innovation on the other, receive little attention from researchers in the field of management accounting (Davila et al., 2009b). Therefore, this study seeks to explore the effect of innovativeness and entrepreneurship on the relationship between management control systems and strategic outcomes. More specifically, the current study applies one element of management control: performance measurement system (PMS) .
PMS plays a critical role in sustaining excellent competitive and strategic outcomes. Some proponents claim that innovation and entrepreneurship are the two elements that most often lead to superior performance (Hult, Ketchen Jr, and David, 2001; Hurley and Hult, 1998). For example, an organization that has a strong entrepreneurship orientation may discover new opportunities to exploit existing resources (Alvarez and Busenitz, 2001; Wiklund and Shepherd, 2003).
Simons (1995) notes that PMS can stimulate managers to search for new opportunities and gain information to be creative (Simons, 1995). I investigate the effect of PMS on entrepreneurship and innovation.Using Two recent studies of the Indonesian service sector data, Yuliansyah, Rammal, and Rose (2016) and Yuliansyah, Gurd, and Mohamed (2017), this study contributes to the extent to which PMS links with entrepreneurship and innovation (1) in the service sector and (2) in Asian countries in the last 20 years. In addition, practical contribution of the study is that SPM can help organisation to build their entrepreneurship and innovativeness culture to improve an organisational performance through creating of strategic outcomes.
We believe that SPM can enhance strategic outcomes (Baird, 2017; Pollanen, Abdel-Maksoud, Elbanna, and Mahama, 2017; Yuliansyah, Gurd, and Mohamed, 2017; Yuliansyah and Khan, 2015a) through entreprenueship and innovativeness(Davila and Foster, 2008; Davila et al., 2009a; Davila et al., 2009b).strategic performance measures (SPM) can motivate managers to seek new markets, a task requiring entrepreneurial skills. This approach needs strong leadership (Dess, Lumpkin, and Covin, 1997; Miller, 1983).The approach is effective for both goods and services (Hunt and Morgan, 1996). I propose the following hypotheses:
H1: There is a positive relationship between SPM and innovation.
H2: There is a positive relationship between innovation and strategic outcomes
Hurley and Hult (1998), Hunt and Morgan (1995), Hunt and Morgan (1996) and Hult, Hurley, and Knight (2004) place the most importance on innovation to improve company performance. Innovative employees survive and succeed by solving
problems and meeting challenges (Hult et al., 2004). In addition, innovation lets the company maintain prices because it is more in demand than its competitors (Hult et al., 2004; Webster, 2004). Specifically, Sher and Lee (2004) speak of (1) reduced operating costs, (2) shortened lead-time, and (3) product differentiation. Bisbe and Otley (2004) note that PMS can support individual innovation. Henri (2006b) agrees. Akroyd and Maguire (2011) make it clear that SPM reduces uncertainty during the process of innovation.
Yuliansyah and Razimi (2015)’s study of companies listed on the Indonesian stock exchanges finds that PMS fosters innovation. In addition, Cardinal (2001)’s study of pharmaceutical companies finds a positive relationship between performance control and innovation. I propose the following hypothesis:
H3: There is a positive relationship between SPM and entrepreneurship
H4: There is a positive relationship between entrepreneurship and strategic outcomes.
Chenhall (2005) explicitly examines the relationship between SPM and strategic outcomes. He shows that SPM helps managers to create longterm sustainable competitive advantages with both product differentiation and lower costs of doing business. One of the biggest advantages of SPM is that it measures how well a business systematically implements its strategy (Grafton, Lillis, and Widener, 2010). In addition, broader information (both financial and non-financial) illuminates a wider range of strategies. For example, if an organization wants to focus on lowering costs, the financial PMS is effective (Govindarajan, 1988), However, if an organization desires to focus on differentiation, a nonfinancial PMS is more appropriate (Perera, Harrison, and Poole, 1997) because it can be used, for example, to measure customer satisfaction. Lillis and Veen-
Dirks (2008) show that using both financial and nonfinancial PMS at the same time facilitates joint strategic decisions on both low-cost and differentiation strategies. Thus, based on the above information, I propose Hypothesis 5:
H5: There is a positive relationship between SPM and strategic outcomes
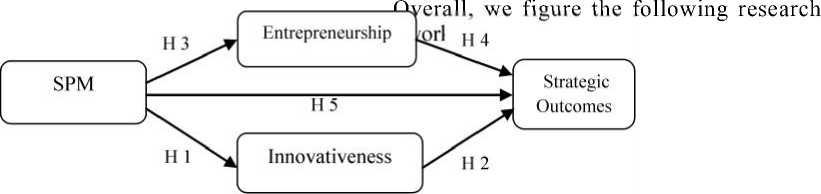
Figure 1. A research framewok of the study
RESEARCH METHOD
To collect data on Indonesian financial institution managers, I obtain details of these companies from the central bank of Indonesia and, for finance and insurance companies, from the Indonesian Capital Market Supervisory Agency’s website. A two-step pilot study precedes the main survey, for these reasons: 1) to ensure that the questions are clear and easily understood by the respondents, (2) to identify and rectify any problems with the questions, and (3) to ensure that the questions in translation convey the same meaning as the original (O’Connor,
Vera-Muñoz, and Chan, 2011, p. 251). The first step is, of course, to translate the questions from English into Indonesian. The second step is to administer the questionnaire to a representative selection of respondents, and the last phase is to confirm its validity and reliability.
With that encouragement, I send a total of 710 questionnaires to 355 organisations and receive 176 responses, from which 158 are usable (22.25%), a good response for this type of research. Table 1 illustrates the demography of respondents that was taken from Yuliansyah, Rammal, and Rose (2016) and Yuliansyah et al. (2017).
Table 1.
Demographic information of respondents
|
n |
Cumulative |
% |
Cumulative (%) | ||
|
Gender |
Men |
92 |
92 |
58.2 |
58.2 |
|
Women |
66 |
158 |
41.8 |
100 | |
|
< 35 |
51 |
51 |
32.3 |
32.3 | |
|
Age |
36-40 |
42 |
93 |
26.6 |
58.9 |
|
41-45 |
37 |
130 |
23.4 |
82.3 | |
|
>46 |
28 |
158 |
17.7 |
100 | |
|
Accountingand |
51 |
51 |
32.3 |
32.3 | |
|
finance |
24 |
75 |
15.2 |
47.5 | |
|
Division |
General |
44 |
119 |
27.8 |
75.3 |
|
Human resources |
15 |
134 |
9.5 |
84.8 | |
|
Marketing Others |
24 |
158 |
15.2 |
100 | |
|
Banking |
56 |
56 |
35.4 |
35.4 | |
|
Type of |
Financing |
32 |
88 |
20.3 |
55.7 |
|
Business |
Insurance |
57 |
145 |
36.1 |
91.8 |
|
Others |
13 |
158 |
8.2 |
100 | |
Source: Result of data, 2011
Thirteen questions about SPM are developed by Yuliansyah et al. (2017), and are based on Explanatory Factor Analysis (EFA). They fall into two categories: 1) Strategic and operational linkages (SOL) and 2) Internal aspects of employees (IAE). Respondents indicate their performance characteristics using a seven-point Likert scale anchored by 1 (not important) and 7 (very important).
Entrepreneurship is developed by Naman and Slevin (1993) and Hult (1998). This instrument is used by Hult et al. (2001), and Henri (2006a). Based on the EFA test, this construct also has two dimensions: 1) Proactiveness and 2) Risk-taking. Respondents describe their company using a seven-point Likert scale ranging from 1 (strongly disagree) to 7 (strongly agree).
The 5-item scale of innovativeness iis developed by (Burke, 1989), by Hult and Ketchen Jr (2001), and by (Henri, 2006, 2010). Respondents describe their company using a seven-point Likert scale from
1 (strongly disagree) to 7 (strongly agree).The strategic outcomes instrument is originally by Porter (1990). However, I use one adapted from Auzair and Langfield-Smith (2005). Respondents evaluate their organization using a seven-point Likert scale anchored by 1 (not at all) and 7 (strongly important).
RESULTS AND DISCUSSION
I choose structural equation modelling (SEM) because it ‘provides the researcher with an opportunity to adopt a more holistic approach to model building’(Smith and Langfield-Smith, 2004, p. 59-60). More specifically, this study uses the component-based approach PLS rather than covariance-based structural equating modelling (CBSEM) such as AMOS and LISREL. The PLS software tool is used because the package has several advantages: 1) the minimum sample size requirement is small (Chin, 1998; Chin, Marcolin, and Newsted,
2003; Chin, Peterson, and Brown, 2008; Faizan, Mostafa, Marko, M., and Kisang, 2018; Franziska, R., M., and Christopher, 2016; Gefen and Straub, 2005; Gudergan, Ringle, Wende, and Will, 2008; Hair, Ringle, and Sarstedt, 2011) compared to using AMOS, whose recommended minimum sample size is 200(Tomarken and Waller, 2005; Urbach and Ahlemann, 2010). 2) because SPM is a self-developed instrument, PLS is appropriate for examining variables that have not been used in a prior study (Chin, 1998; Chin et al., 2003; Chin et al., 2008; Faizan et al., 2018; Franziska et al., 2016; Gefen and Straub, 2005; Gudergan et al., 2008; Hair et al., 2011).
In management accounting literature the PLS is in wide use by scholars (e.g. Hall, 2008, 2011; Hartmann and Slapnièar, 2009, 2012; Naranjo-Gil and
Hartmann, 2007; Yuliansyah and Khan, 2015a; Yuliansyah and Khan, 2017; Yuliansyah and Khan, 2015b; Yuliansyah and Razimi, 2015). To test the SEM, Hulland (1999) suggests two sequential phases: the measurement model and the assessment structural model. The following sections discuss those models.
There are two main assessments in the measurement model: reliability and validity. The measurement reliability was conducted by testing individual items using Cronbach’s alpha and composite reliability. Reliability is “satisfactory” if it is higher than 0.7 and it is “acceptable” if it is higher than 0.6 (Chin, 1988). Table 3 summarizes Cronbach’s alpha and shows composite reliability ranging between 0.750 and 0.940. Thus, reliability is well above satisfactory.
Table 2.
Measurement Model (n=158)
|
Original Sample |
Sample Mean |
Standard Error |
T Statistics | |
|
SOL -> Entre1 |
0,459 |
0,441 |
0,132 |
3,470 |
|
SOL -> Entre2 |
0,458 |
0,448 |
0,121 |
3,779 |
|
SOL -> Inno |
0,493 |
0,474 |
0,121 |
4,071 |
|
IAP -> Entre1 |
0,013 |
0,043 |
0,121 |
0,107 |
|
IAP -> Entre2 |
-0,042 |
-0,022 |
0,114 |
0,372 |
|
IAP -> Inno |
0,107 |
0,132 |
0,117 |
0,910 |
|
Entre1 -> LC1 |
0,208 |
0,200 |
0,130 |
1,594 |
|
Entre1 -> Diff |
0,087 |
0,093 |
0,095 |
0,913 |
|
Entre2 -> LC1 |
0,074 |
0,078 |
0,115 |
0,640 |
|
Entre2 -> Diff |
0,095 |
0,092 |
0,088 |
1,072 |
|
Inno -> LC1 |
0,157 |
0,156 |
0,132 |
1,189 |
|
Inno -> Diff |
0,274 |
0,275 |
0,104 |
2,639 |
|
SOL -> LC1 |
0,326 |
0,313 |
0,143 |
2,282 |
|
SOL -> Diff |
0,471 |
0,467 |
0,097 |
4,844 |
|
IAP -> LC1 |
0,075 |
0,097 |
0,125 |
0,602 |
|
IAP -> Diff |
0,179 |
0,187 |
0,102 |
1,760 |
Source: Result of data, 2011
Validity is tested by analysing convergent validity and discriminant validity. Convergent validity ensures (1) that observable indicators measure the latent variable, (2) that the indicators are significantly fit, and (3) that they are highly correlated. It is tested using the average variance extracted (AVE) and is
“adequate” if the AVE is higher than 0.5 (Fornell and Larcker, 1981; Henseler, Ringle, and Sinkovics, 2009). As seen in Table 3, all AVEs of all the constructs exceed 0.5. That is, all the constructs are adequate in term of convergent validity.
Table 3.
AVE, composite reliability and Cronbach’s alpha
|
AVE |
Composite Reliability |
R Square |
Cronbachs Alpha | |
|
Strategic and operational linkages (SOL) |
0,663 |
0,940 |
0,927 | |
|
Internal aspects of employees (IAE) |
0,676 |
0,912 |
0,882 | |
|
Proactiveness |
0,532 |
0,849 |
0,220 |
0,778 |
|
Risk-taking |
0,633 |
0,873 |
0,181 |
0,807 |
|
Innovativeness |
0,562 |
0,863 |
0,336 |
0,805 |
|
Low-cost strategy |
0,800 |
0,889 |
0,256 |
0,750 |
|
Differentiation strategy |
0,591 |
0,920 |
0,495 |
0,900 |
Another validity test is discriminant validity. The latent variables. In addition, good dicriminant validity discriminant validity is measured in two ways: the when the value of the square root of the AVE along Fornell-Larcker measure and cross-loading(Fornell the diagonal is greater than correlations between and Larcker, 1981). The Fornell-Larcker criterion constructs. Table 4 shows that discriminant validity can be comparing the the square root of the AVE of is satisfactory.
|
Table 4. Discriminant validity of latent variables correlations | |
|
Latent variables |
Correlations Pro- Risk SOL IAE activeness taking Inno Low-cost Diff |
|
SOL IAE Pro-activeness Risk-taking Innovativeness Low-cost Differentiation |
0,814 0,770 0,822 0,469 0,367 0,73 0,425 0,310 0,628 0,795 0,575 0,486 0,725 0,609 0,75 0,384 0,326 0,448 0,369 0,452 0,894 0,609 0,542 0,523 0,471 0,615 0,452 0,769 |
Source: Result of data, 2011
Furthermore, discriminant validity measurement (Barclay, Higgins, and Thompson, 1995; Urbach and using cross loading requires that factor loadings should Ahlemann, 2010). As shown in Table 5, discriminant be above 0.5 (Al-Gahtani, Hubona, and Wang, 2007; validity using cross loading is adequate.
Hulland, 1999) and higher than any other constructs
|
Table 5. Cross loadings SOL IAE Entre1 Entre2 Inno Low-cost Diff | |
|
SOL1 SOL2 SOL3 SOL4 SOL5 SOL6 SOL7 SOL8 IAE1 IAE2 IAE3 IAE4 IAE5 ENTRE1 ENTRE2 ENTRE3 ENTRE4 ENTRE5 ENTRE6 ENTRE7 ENTRE8 ENTRE9 INNO1 INNO2 INNO3 INNO4 INNO5 SO1 SO2 SO3 SO4 SO6 SO7 SO8 SO9 SO10 SO11 |
0,747 0,574 0,258 0,239 0,399 0,252 0,452 0,820 0,588 0,302 0,308 0,449 0,294 0,436 0,740 0,536 0,365 0,294 0,376 0,300 0,381 0,838 0,652 0,326 0,309 0,430 0,332 0,464 0,868 0,682 0,459 0,430 0,555 0,357 0,542 0,845 0,630 0,434 0,409 0,514 0,272 0,533 0,808 0,652 0,437 0,383 0,511 0,354 0,552 0,837 0,679 0,424 0,348 0,471 0,323 0,563 0,625 0,755 0,206 0,161 0,278 0,134 0,362 0,641 0,831 0,212 0,278 0,372 0,262 0,392 0,637 0,880 0,271 0,222 0,370 0,249 0,466 0,624 0,806 0,454 0,354 0,524 0,374 0,501 0,645 0,833 0,282 0,203 0,380 0,248 0,464 0,378 0,314 0,788 0,427 0,605 0,287 0,505 0,306 0,247 0,751 0,548 0,574 0,315 0,440 0,225 0,132 0,669 0,574 0,483 0,247 0,331 0,393 0,320 0,625 0,295 0,500 0,356 0,229 0,389 0,297 0,800 0,477 0,524 0,417 0,376 0,395 0,303 0,565 0,819 0,560 0,315 0,398 0,300 0,212 0,533 0,779 0,507 0,313 0,413 0,249 0,190 0,397 0,747 0,435 0,217 0,302 0,385 0,267 0,482 0,833 0,428 0,313 0,371 0,491 0,471 0,553 0,435 0,801 0,368 0,487 0,196 0,127 0,324 0,287 0,549 0,246 0,123 0,499 0,410 0,587 0,480 0,686 0,324 0,616 0,471 0,385 0,600 0,502 0,865 0,383 0,472 0,381 0,306 0,619 0,524 0,806 0,351 0,425 0,332 0,271 0,378 0,328 0,398 0,886 0,372 0,354 0,310 0,421 0,332 0,411 0,902 0,434 0,516 0,492 0,309 0,225 0,415 0,493 0,737 0,351 0,329 0,271 0,250 0,376 0,244 0,663 0,488 0,386 0,314 0,289 0,390 0,266 0,670 0,404 0,328 0,453 0,428 0,465 0,304 0,753 0,482 0,432 0,572 0,569 0,637 0,437 0,840 0,442 0,453 0,383 0,367 0,463 0,347 0,827 0,513 0,436 0,344 0,227 0,397 0,241 0,781 0,533 0,461 0,494 0,453 0,572 0,399 0,853 |
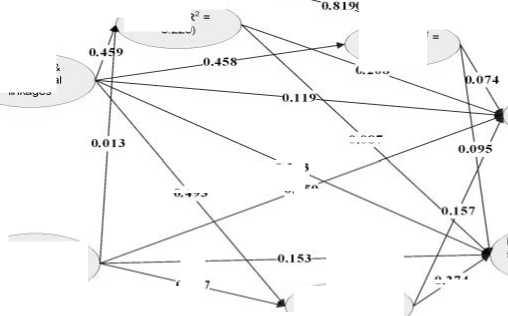
The evaluation of the structural model can be carried out by calculating means of the R2 of for dependent variables and path coefficient tests. In
Camisón and López (2010), the threshold level of 0.1 for R2 is acceptable. By their criterion, my R2 of the endogenous constructs is over the threshold.
Table 6.
The result of PLS structural model: path coefficient, t-statistics and R2
|
Dependent variables |
Independent variables |
R2 | ||||
|
Strategic and operational linkages |
Internal aspect of employees |
Proactiveness |
Risk-taking |
Innovation | ||
|
Pro-activeness |
0,459 |
0,013 |
0,152 | |||
|
Risk-taking |
0,458 |
-0,042 |
0,469 | |||
|
Innovation |
0,493 |
0,107 |
0,156 | |||
|
Low-cost strategy |
0,119 |
0,059 |
0,208 |
0,074 |
0,157 |
0,473 |
|
Differentiation |
0,253 |
0,153 |
0,087 |
0,095 |
0,274 | |
|
strategy | ||||||
Source: result of data, 2011
Hypothesis 1 postulated a positive relationship between SPM and innovation. Table 5 indicates that strategic and operational linkages have a strong relationship with innovation (β=0.493, t = 4.071, p < 0.01). In contrast, internal aspect of employees has no relationship with innovation (β=0.107, t = 0.910, p < 0.1). Thus, Hypothesis 1 is partly supported. I claim that when an organisation develop SPM, it can enhance innovation. This study supports Bisbe and Otley (2004) mentioned that a performance measurement systems can increase innovation.
Hypothesis 2 states that there is a positive relationship between innovation and strategic outcomes. I find that innovation has no effect on low-cost strategy (β=0.157, t = 1.189, p < 0.1) but it has a strong effect on differentiation strategy (β=0.274, t = 2.639, p < 0.01). Hypothesis 2 is partly supported. In previous studies, innovation is a way how an organisation can compete with its rivals by offering new and/or developed products/services. It is not like in manufacturing industry, in financial institution, firm explore to find new how to achive an excellent service. Thus, our study supports Yuliansyah, Rammal and Rose (2016) that innovation in service sector can support differentiation strategy, not for low-cost strategy.
Hypothesis 3 proposes that SPM has a positive effect on entrepreneurship. My results indicate that strategic and operational linkages has a positively associated with proactiveness (β=0.459, t = 3.470, p < 0.01) and Risk-taking (β=0.458, t = 3.779, p < 0.01). Additionally, another dimension of SPM, internal aspect of employees, has no effect on entre 1 nor on entre 2 either.Thus, according to the results, Hypothesis 3 is partly supported.
Hypothesis 4 claims a positive relationship between entrepreneurship and strategic outcomes. The findings suggest that proactiveness has a positive effect on low-cost strategy (β=0.208, t = 1.594, p < 0.1) rather than on differentiation strategy (β=0.087, t = 0.913, p < 0.1). Furthermore, Risk-takinghas no relationship with either low-cost or differentiation strategies, (β=0.074, t = 0.640, p < 0.1) and (β=0.095, t = 1.072, p < 0.1) respectively. Hypothesis 4, like the others, is partly supported.
Hypothesis 5 says that there is a positive relationship between SPM and strategic outcomes. My results show that strategic and operational linkages have no effect on low cost strategy (β=0.119, t = 0.931, p < 0.1); they do, however, have a strongly positive association with differentiation strategy (β=0.253, t = 2.401, p < 0.01). Similarly, internal aspect of employee has also no effect on low-cost strategy (β=0.059, t = 0.515, p < 0.1) but it has a weak relationship with differentiation strategy (β=0.153, t = 1.488, p < 0.1). Thus, Hypothesis 5 is also partly supported.
CONCLUSION
The study seeks to investigate the effect of strategic performance measures on strategic outcomes through entrepreneurship and innovativeness. The link between SPM and entrepreneurship and innovativeness to leverage business performance is often studied in the management accounting literature. I believe that SPM has a significant role in stimulating individual skills.
Most Indonesian financial institutions are headquartered in Jakarta. My respondents are middle
RISPM1
RISPM2
RISPM3
RISPM4
RISPM5
RISPM6
RISPM7
RISPM8
RISPM9
RISPM10
RISPM11
RISPM12
RISPM13
.747
0.820
0.740
0.838
0.84
0.80
0.837
0.831
0.880
0.806
0.833
0.755
0.7880.7510.6690.625 0.800
.779 0.747 0.833
0.208
Strategic & operationa linkages
Entre1(R 0.220)
Entre 2 (R2 0.181)
Entre1 Entre2
Entre3 Entre4
Entre1 I i Ente2 J I Entre3 J I Entre4 Entre5 I
.074
0.095
Differentiation strategy (R2 = 0.495)
0.107
Innovativeness (R2 = 0.336)
Internal aspects of employee
0.9010.901 Diff1
0.253
0.087
0.493
0.059
Diff2
Low-cost strategy (R 0.256)
0.7
0.85
0.737
0.663
Diff5
0.751
0.67
0.274

.763


0.801 0.589 0.686 0.865 0.806
Inno1 Inno2 Inno3 inno4
Inno5
Diff6
840
0.82

Figure 2. PLS Model with Significant Path Coefficients
managers in the headquarters office, because middle managers receive all executive instructions and interpret those instructions to lower level management. Hence, middle level managers have more knowledge of organisational goals.
From my very satisfactory total of 157 usable data points, I find that SPM has a significant role in stimulating entrepreneurship and innovativeness. However, not all dimension of entrepreneurship and innovativeness improves strategic outcomes unless innovativeness links to differentiation strategy. Overall, this study indicates that SPM enhances differentiation strategy only through innovativeness and not through entrepreneurship.
I predict that (1) differentiation is the key to sustainability in Indonesian financial institutions (Yuliansyah et al., 2016), and (2) that trust and excellent service are the ultimate predictor of success, especially for financial institutions which have relatively little difference in their ‘product’, financial services. This study implies that financial institutions in Indonesia may focus on differentiation strategy to compete with rivals. In contrast, competition on price provides no advantage for any firm.
REFERENCES
Akroyd, C., & Maguire, W. (2011). The roles of management control in a product development setting. Qualitative Research in Accounting and Management, 8(3), 212-237.
Al-Gahtani, S. S., Hubona, G. S., & Wang, J. (2007).
Information technology (IT) in Saudi Arabia:
Culture and the acceptance and use of IT. Information and Management, 44(8), 681-691.
Alvarez, S. A., & Busenitz, L. W. (2001). The entrepreneurship of resource-based theory. Journal of Management, 27(6), 755.
Auzair, S. M., & Langfield-Smith, K. (2005). The effect of service process type, business strategy and life cycle stage on bureaucratic MCS in service organizations. Management Accounting Research, 16(4), 399-421.
Baird, K. (2017). The effectiveness of strategic performance measurement systems. International Journal of Productivity and Performance Management, 66(1), 3-21.
Barclay, D., Higgins, C., & Thompson, R. (1995). The partial least squares (PLS) approach to causal modeling: Personal computer adoption and use as an illustration. Technology Studies, 2(2), 285-309.
Bisbe, J., & Otley, D. (2004). The effects of the interactive use of management control systems on product innovation. Accounting, Organizations and Society, 29(8), 709-737.
Burke, W. W. (1989). Culture Instrument. Working Paper, Columbia University.
Camisón, C., & López, A. V. (2010). An examination of the relationship between manufacturing flexibility and firm performance: The mediating role of innovation. International Journal of Operations and Production Management, 30(8): 853-878.
Cardinal, L. B. (2001). Technological Innovation in the Pharmaceutical Industry: The Use of
Organizational Control in Managing Research and Development. Organization Science, 12(1): 19-36.
Chenhall, R. H. (2005). Integrative strategic performance measurement systems, strategic alignment of manufacturing, learning and strategic outcomes: an exploratory study. Accounting, Organizations and Society, 30(5): 395-422.
Chin, W. W. (1998). Issues and opinion on Structural Equation Modeling. MIS Quarterly, 22(1): vii-xvi.
Chin, W. W., Marcolin, B. L., & Newsted, P. R. (2003). A Partial Least Squares Latent Variable Modeling Approach for Measuring Interaction Effects: Results from a Monte Carlo Simulation Study and an Electronic-Mail Emotion/Adoption Study. Information Systems Research, 14(2): 189-217.
Chin, W. W., Peterson, R. A., & Brown, S. P. (2008). Structural equation modeling in marketing: some practical reminders. Journal of Marketing Theory and Practice, 16(4): 287-298.
Davila, A., & Foster, G. 2008. The Adoption and Evolution of Management Control Systems in Entrepreneurial Companies: Evidence and a Promising Future, Handbooks of Management Accounting Research, 3, 1323-1336.
Davila, A., Foster, G., & Li, M. (2009a). Reasons for management control systems adoption: Insights from product development systems choice by early-stage entrepreneurial companies. Accounting, Organizations and Society, 34(34): 322-347.
Davila, A., Foster, G., & Oyon, D. (2009b). Accounting and Control, Entrepreneurship and Innovation: Venturing into New Research Opportunities. European Accounting Review, 18(2), 281-311.
Dess, G. G., Lumpkin, G. T., & Covin, J. G. (1997). Entrepreneurial strategy making and firm performance: tests of contingency and configurational models. Strategic Management Journal, 18(9): 677-695.
Faizan, A., Mostafa, R. S., Marko, S., M., R. C., & Kisang, R. (2018). An assessment of the use of partial least squares structural equation modeling (PLS-SEM) in hospitality research. International Journal of Contemporary Hospitality Management, 30(1): 514-538.
Fornell, C., & Larcker, D. F. (1981). Evaluating Structural Equation Models with Unobservable Variables and Measurement Error. Journal of Marketing Research (JMR), 18(1): 39-50.
Franziska, R. N., R., S. R., M., R. C., & Christopher, S. (2016). A critical look at the use of SEM in international business research. International Marketing Review, 33(3): 376-404.
Gefen, D., & Straub, D. (2005). A practical guide to factorial validity using pls-graph: tutorial and annotated example. Communications of AIS, 16, 91-109.
Govindarajan, V. (1988). A contingency approach to strategy implementation at the business-unit level: integrating administrative mechanisms with strategy. Academy of Management Journal, 31(4): 828-853.
Grafton, J., Lillis, A. M., & Widener, S. K. (2010). The role of performance measurement and evaluation in building organizational capabilities and performance. Accounting, Organizations and Society, 35(7), 689-706.
Gudergan, S. P., Ringle, C. M., Wende, S., & Will, A. (2008). Confirmatory tetrad analysis in PLS path modeling. Journal of Business Research, 61(12),1238-1249.
Hair, J. F., Ringle, C. M., & Sarstedt, M. (2011). PLS-SEM: Indeed a silver bullet. Journal of Marketing Theory and Practice, 19(2), 139-151.
Hall, M. (2008). The effect of comprehensive performance measurement systems on role clarity, psychological empowerment and managerial performance. Accounting, Organizations and Society, 33(2-3), 141-163.
Hall, M. (2011). Do comprehensive performance measurement systems help or hinder managers’ mental model development? Management Accounting Research, 22(2): 68-83.
Hartmann, F., & Slapničar, S. (2009). How formal performance evaluation affects trust between superior and subordinate managers. Accounting, Organizations and Society, 34(6-7), 722-737.
Hartmann, F., & Slapničar, S. (2012). The perceived fairness of performance evaluation: The role of uncertainty. Management Accounting Research, 23(1), 17-33.
Henri, J.-F. (2006). Management control systems and strategy: A resource-based perspective. Accounting, Organizations and Society, 31(6), 529-558.
Henri, J.-F. (2010). The Periodic Review of Performance Indicators: An Empirical Investigation of the Dynamism of Performance Measurement Systems. European Accounting Review, 19(1), 73-96.
Hulland, J. (1999). Use of partial least squares (PLS) in strategic management research: A review of four recent. Strategic Management Journal, 20(2), 195-204.
Hult, G. (1998). Managing the International Strategic Sourcing Process as a Market-Driven Organizational Learning System. Decision Sciences, 29(1), 193-216.
Hult, G., Hurley, R., & Knight, G. (2004). Innovativeness: Its antecedents and impact on business performance. Industrial Marketing Management, 33(5), 429-438.
Hult, G., Ketchen Jr, & David, J. (2001). Does Market orientation matter?: A test of the relationship between positional advantage and performance. Strategic Management Journal, 22(9), 899.
Hunt, S., D., & Morgan, R. M. (1995). The Comparative Advantage Theory of Competition. Journal of Marketing, 59(2), 1-15.
Hunt, S. D., and Morgan, R. M. (1996). The Resource-Advantage Theory of Competition: Dynamics, Path Dependencies, and Evolutionary Dimensions. Journal of Marketing, 60(4), 107-114.
Hurley, R. F., & Hult, G. (1998). Innovation, Market Orientation, and Organizational Learning: An Integration and Empirical Examination. Journal of Marketing, 62(3), 42-54.
Lillis, A. M., & Veen-Dirks, P. M. G. v. (2008). Performance Measurement System Design in Joint Strategy Settings. Journal of Management Accounting Research, 20, 25-57.
Miller, D. (1983). The Correlates of Entrepreneurship in Three Types of Firms. Management Science, 29(7): 770-791.
Naman, J. L., & Slevin, D. P. (1993). Entrepreneurship and the concept of fit: a model and empirical tests. Strategic Management Journal, 14(2), 137-153.
Naranjo-Gil, D., & Hartmann, F. (2007). Management accounting systems, top management team heterogeneity and strategic change. Accounting, Organizations and Society, 32(7-8), 735-756.
O’Connor, N. G., Vera-Muñoz, S. C., & Chan, F. (2011). Competitive forces and the importance of management control systems in emergingeconomy firms: The moderating effect of international market orientation. Accounting, Organizations and Society, 36(4–5), 246-266.
Perera, S., Harrison, G., & Poole, M. (1997). Customer-focused manufacturing strategy and the use of operations-based non-financial performance measures: A research note.
Accounting, Organizations and Society, 22(6), 557-572.
Pollanen, R., Abdel-Maksoud, A., Elbanna, S., & Mahama, H. (2017). Relationships between strategic performance measures, strategic decision-making, and organizational performance: empirical evidence from Canadian public organizations. Public Management Review, 19(5), 725-746.
Porter, M. E. (1990). The Competitive Advantage of Nations. (cover story). Harvard Business Review, 68(2), 73-93.
Sher, P. J., & Lee, V. C. (2004). Information technology as a facilitator for enhancing dynamic capabilities through knowledge management. Information and Management, 41(8), 933945.
Simons, R. 1995. Levers of control: How managers use innovative control systems to drive strategic renewal. Boston, Massachusetts: Harvard Business School Press.
Smith, D., & Langfield-Smith, K. (2004). Structural equation modeling in management accounting research: critical analysis and opportunity. Journal of Accounting Literature, 23, 49-89.
Tomarken, A. J., and Waller, N. G. (2005). Structural Equation Modeling: Strengths, Limitations, and Misconceptions. Annual Review of Clinical Psychology, 1.
Urbach, N., & Ahlemann, F. (2010). Structural equation modeling in information systems research using partial least squares. Journal of information Technology Theory and Application, 11(2), 5-39.
Webster, E. (2004). Firms’ decisions to innovate and innovation routines. Economics of Innovation and New Technology, 13(8): 733-745.
Wiklund, J., & Shepherd, D. (2003). Knowledgebased resources, entrepreneurial orientation, and the performance of small and medium-sized businesses. Strategic Management Journal, 24(13): 1307-1314.
Yuliansyah, Y., Gurd, B., & Mohamed, N. (2017). The significant of business strategy in improving organizational performance. Humanomics, 33(1): 56-74.
Yuliansyah, Y., & Khan, A. (2015). Interactive use of performance measurement systems and the organization’s customers-focused strategy: the mediating role of organizational learning. Problems and Perspectives in Management, 13(2), 219-229.
Yuliansyah, Y., & Khan, A. (2017). A re-visit of the participative budgeting and employees’ selfefficacy interrelationship–empirical evidence from Indonesia’s public sector. International Review of Public Administration, 22(3), 213–230.
Yuliansyah, Y., & Khan, A. A. (2015b). Strategic Performance Measurement System: A Service Sector And Lower Level Employees Empirical Investigation. Corporate Ownership and Control, 12(3): 304-316.
Yuliansyah, Y., Rammal, H. G., & Rose, E. L. (2016). Business Strategy and Performance in Indonesia’s Service Sector. Journal of Asia Business Studies, 10(2), 164 - 182.
Yuliansyah, Y., & Razimi, M. S. A. (2015). Nonfinancial performance measures and managerial performance: the mediation role of innovation in an Indonesian stock exchange-listed organization. Problems and Perspectives in Management, 13(4), 135-145.
Discussion and feedback