Validation of Method for Determining Alpha- Mangostin Level of Ethyl Acetate Extract of Mangosteen Rind Using TLCSpectrodensitometry
on
> Journal of Health Sciences and Medicine, Vol. 1 No. 1, February 2017 <
1
Validation of Method for Determining Alpha-Mangostin Level of Ethyl Acetate Extract of Mangosteen Rind Using TLC-Spectrodensitometry
N. P. A. D. Wijayanti1, L. P. M. K. Dewi1, and K. W. Astuti1
1Department of Pharmacy, Faculty of Mathematics and Natural Sciences, Udayana University Bali-Indonesia
Email: dewi_wijayanti@unud.ac.id
Abstract
Objective: Mangosteen rind (Garcinia mangostana L.) contains secondary metabolites, namely alpha-mangostin which has antioxidant activity, as well as antibacterial and anti-aging properties. In order to obtain a maximum amount of alpha-mangostin compounds, the maceration method using ethyl acetate was used. To ensure the effectiveness of the mangosteen rind extraction process, all of the processes and methods in preparing the extract should be properly controlled, particularly the analytical method used in determining the alpha-mangostin level of the extract. The method used should be able to determine the alphamangosteen level accurately. This study aimed to test the validation of the analytical method used.
Method: The parameters for the validation of the analytical method tested in this study include accuracy, precision, range and linearity, limit of detection (LOD), limit of quantitation (LOQ) and specificity. In this study, the level of alpha-mangostin in the extract was determined using TLC-Spectrodensitometry with the stationary phase of the silica gel plate GF 254 and the mobile phase of chloroform and methanol (10:0.1 v/v).
Result: The results of the study showed that this method has met the acceptance criteria for validation with the accuracy value in the range of percent recovery, from 93.85 % to 111.16%; precision with KV <2%; specification with spectrum correlation >0.99; linearity with r =0,99372; limit of detection (LOD) of 5.33 ng and limit of quantitation (LOQ) of 11.43 ng.
Index Terms— Alpha-mangostin, Ethyl acetate, TLC-Spectrodensitometry, Validation,
Mangosteen is a functional plant originating from the South-East Asia region, and it has many known benefits for health. Mangosteen rind has anti-aging properties, ability to lower high blood pressure, helps to lose weight, and serves as an antiviral and antibacterial agent [1]. Chemical substances contained in mangosteen rind include saponins, tannins, flavonoids, triterpenoids, steroids, xanthones and yellow dye derived from secondary metabolites namely mangostin, α-mangostin and β-mangostin [2].
Alpha mangostin can be extracted or separated from mangosteen rind through a process called extraction [3]. Factors that can affect the maceration process include the selection of solvent and duration of maceration. Ethyl acetate is used in the process of macerating mangosteen rind since the compound to be extracted is semi-polar alpha-mangostin. Ethyl acetate is a semi-polar solvent with a dielectric constant of 6.
The alpha-mangostin level of mangosteen rind extract can be determined using the TLC-Spectrodensitometry method [4]. In that study, the alpha-mangostin compounds were derived from the mangosteen bark and rind extract. The determination of compound level in an extract is related to the monitoring of the extract quality. In monitoring the quality of the extract, the method used should be validated. The validation of the analytical method was performed to prove that the characteristics of the method performance meet the intended application of analysis [5]. Parameters for method validation include specificity, linearity and range, detection limit (DL) and quantitation limit (QL), precision and accuracy [6].
Therefore, it is necessary to conduct a research on the validation of the method for determining the alpha-mangostin level of ethyl acetate extract of mangosteen rind using TLC-spectrodensitometry.
-
II. METHOD
-
A. Preparation of Mobile Phase
The mobile phase used in this research makes reference to what was used in the research conducted by Dachriyanus et al. (2014), which is a mixture of chloroform and methanol (10:0.1 v/v)
-
B. Preparation of Alpha-mangostin Standard Solution
The alpha-mangostin standard solution was prepared by dissolving the alpha-mangostin standard in the methanol solvent. The solution was prepared in a concentration of 100 ug/mL.
-
C. Determination of Accuracy, Linearity, Specificity,
Precision, DL and QL
Alpha-mangostin standard solution was prepared with a concentration of 100 ug/mL, and a spot of which was applied to TLC plate GF254 that had been cleaned, and the activated solution was as much as 4uL, 8 uL and 16 uL to determine the accuracy. As for the determination of linearity, some spots of the solution were applied on 5 test points as much as 1 uL, 4 uL, 8 uL, 16 uL and 20 uL. The accuracy was determined by analyzing the concentration of the analyte in the standard solution and the results were compared with the level of analyte added. The accuracy rate of a compound in the matrix with a concentration of >0.1% is acceptable if it is in the range of 95%-105% of the actual level [5]. Meanwhile, the LOD and LOQ were determined using the signal to noise method [7]. The specificity was measured by determining the peak purity using cross correlation function. The peak is said to be pure if the spectrum correlation value is greater than 0.95. The precision was determined using 3 variations of spotted solution mass, namely 400 ng, 800 ng and 1,600 ng. The test is considered to be precise if the KV value is less than 2% [5].
The validation method used in this study covers aspects of qualitative and quantitative analysis to guarantee the reliability and validity of the results obtained. The validation performed makes reference to the guideline of the United Nation Office on Drugs and Crime (2009), while the parameters set include the precision, linearity and range, specificity, limit of detection and limit of quantitation and accuracy.
-
A. Specificity
The specificity of the analytical method using TLC was obtained through identification and examination of the purity of the analyte stain. A method can be considered specific if the response generated is only from a single analyte without any matrix interference or influence on the analyte stain. The specificity was assessed based on the measurement of the UV spectrum by analyte in situ in three peak areas namely at the start of the peak (S), peak (M), and
the end of the peak (E). The peak of the chromatograms produced can be considered to be purely derived from one analyte if the spectrum correlation in the three areas mentioned is above 0.95 [8]. The spectrum purity test results can be seen in Table 1.
TABLE I
The alpha-mangostin spectrum purity test results
|
The concentration of alpha-mangostin (ng/spot) |
Rf |
r(S,M)a |
r(M,E)b |
Purity |
|
25 |
0.31 |
0.999896 |
0.999511 |
Fulfilled |
|
50 |
0.3 |
0.999835 |
0.997794 |
Fulfilled |
|
100 |
0.29 |
0.999541 |
0.995732 |
Fulfilled |
|
150 |
0.29 |
0.999037 |
0.992254 |
Fulfilled |
|
200 |
0.3 |
0.998741 |
0.992491 |
Fulfilled |
ar(S,M) = the initial Rf spectrum correlation compared with Rf max; br(M,E) = the Rf max spectrum correlation compared with the final Rf.
Based on the value of the spectrum correlation scanned in three peak areas, namely r(S,M) and r(M,E), the TLC system used has met the requirement of the spectrum correlation value, which is >0.95 [8]. The spectrum purity test results showed that the method used has met the specificity parameter for the analysis of alpha-mangostin.
-
B. Accuracy
Accuracy is the proximity of the measurement results of analyte levels with the actual content in the sample. Accuracy expressed as percent recovery should be defined in a quantitative analysis method. The accuracy of the data obtained can be used as a parameter for assessing the validity of the results obtained. The accuracy value of a compound in the matrix with a concentration of >0.01% is acceptable if it is in the range of 80-120% of the actual level [9], and the percent recovery with a percentage closer to 100% indicates the accuracy of the analysis method and that it is not affected by the presence of matrix or impurities [8]. In this study, the concentrations of the standard solution used to test the accuracy are 400 ng, 800 ng and 1,600 ng. The analyte recovery test results can be seen in table 2.
TABLE II
The analyte recovery test results
|
The actual concentration of alpha-mangostin |
Repetition |
Levels obtained (ng) |
Average levels (ng) |
Percent recovery (%) |
Average (%) |
|
I |
422.87 |
105.72 | |||
|
400 ng |
II |
429.39 |
428.43 |
107.35 |
107.11 |
|
III |
433.02 |
108.25 | |||
|
I |
883.01 |
110.38 | |||
|
800 ng |
II |
891.64 |
889.28 |
111.45 |
111.16 |
|
III |
893.19 |
111.64 | |||
|
I |
1,499 |
93.69 | |||
|
1,600 ng |
II |
1,506 |
1,501.67 |
94.12 |
93.85 |
|
III |
1,500 |
93.75 |
Based on the results obtained, it can be seen that the average recovery of alpha-mangostin at a concentration of 400 was 107.11%, the average recovery of alpha-mangostin at a concentration of 800 ng was 111.16% and the average recovery of alpha-mangostin at a concentration of 1600 ng was 93.85%. Based on the requirements of the accuracy set by the UNODC, the acceptable deviations of the percent recovery of analyte are in the range of ± 20% of the actual level. Therefore, the results obtained have met the requirements of the accuracy, and the TLC-Spectrodensitometry method can be considered valid in determining the alpha-mangostin levels.
-
C. Linearity
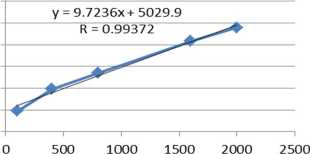
The determination of the linearity range aims to obtain the concentration range of alpha-mangostin which produces a linear relationship with the response of the instrument detector. The range of concentrations was measured using a series of standard solutions with various concentrations, where in this study 5 series of alpha-mangostin standard solutions were used namely 100 ng, 400 ng, 800 ng, 1,600 ng and 2,000 ng. Parameters used for the measurement are the correlation coefficient (r) to determine the linearity of the measured range. The measurement of the concentration range of the standard compound is said to be linear if the correlation coefficient (r) is greater than 0.99 [6]. Based on the results of the measurements performed on five series of standard solutions, the linear regression equation y = 9.7236x + 5,029.9 is obtained with r = 0.9937, and therefore, the range has met the requirement set and can be used for the subsequent analysis. The linearity graph can be seen in fig 1.
Linearity
3∞∞ 250∞ 2∞∞ = 15O∞ 1∞∞ 5∞O O
Consentration
Fig 1. The alpha-mangostin linearity graph
-
D. Precision
Precision test is a test to assess the degree of proximity between the individual test results when the procedure is applied repeatedly on samples derived from a homogeneous mixture. Precision test is performed to determine the repeatability and reproducibility of the analytical method [6]. In this experiment, three concentrations of alpha-mangostin standard solution were used; and they are 400 ng, 800 ng and 1,600 ng. The precision test covers intraday and interday precision tests. Results of the calculation of the precision test can be seen in appendix 1. Intraday and interday precision data are presented in Table
TABLE III
Results of intraday and interday precision test
Precision Concentration (ng)
Test 400 800 1,600
Results x±RSDa x±RSD x±RSD
Intraday 10,151.8±0.2 14,310.7±0.3 19,062.7±0.2
10,154.5±1.7 13,802.7±0.4 18,341.8±0.2
Interday 9,958±1.03 13,759.6±0.7 18,261±0.2
aDescription: x= average AUC; RSD = relative standard deviation
-
E. LOD and LOQ
The limit of detection and limit of quantification in this study were calculated using the signal to noise ratio (S/N). The limit of detection (LOD) and the limit of quantification (LOQ) were calculated using the data obtained in the testing of the linearity and range. The noise obtained in a series of concentration was averaged and the standard deviation of all of which was calculated. The values obtained from the noise were then calculated using the signal to noise ratio (S/N) using the equation (7) and (9). In this research, the value of the detection limit of alpha-mangostin was 5.33 ng and the limit quantification was 11.43 ng.
-
IV. CONCLUSION
The analytical method for determining the alpha-mangostin level of ethyl acetate extract of mangosteen rind using TLC-Spectrodensitometry has fulfilled the acceptance criteria of validation, with the following results obtained: the accuracy with the percent recovery range from 93.85 to 111.16%; precision with KV <2%; specification with the spectrum correlation >0.99; linearity with r =0,99372; the limit of detection (LOD) of 5.33 ng, and the limit of quantification (LOQ) of 11.43 ng.
Acknowledgment
We would like to express our sincere gratitude to the Faculty of Mathematics and Natural Sciences of Udayana University for the Study Program Competitive Grant Fund received by the researchers and to the Department of Pharmacy of Udayana University where the researchers are working, and to the Institute for Research and Community Services which acts as an administrator of the Study Program Competitive Grant.
References
-
[1] M. A. Subroto, Real Food True Health. Jakarta: Agromedia Pustaka, 2008.
-
[2] J. P. Chaverri, C. R. Noemi, O. I. Morisol, M. Jazmin. And R. Perez. (2008). Review Medical Properties of Mangosteen. Food and Chemical Toxicology. 46. pp. 3227-3239.
-
[3] Departemen Kesehatan Republik Indonesia, Sediaan Galenik. Jakarta: Direktorat Jendral Pengawasan Obat dan Makanan, 1986.
-
[4] H. Misra, B. K. Dwivedi, D. Mehta, B. K. Metha and C. Jain. (2009, July). Development and Validation of High Performance Thin-Layer Chromatographic Method for Determination of α-Mangostin in Fruit Pericarp of Mangosteen Plant (Garcinia mangostana L.) using Ultraviolet-Visible Detection. Rec. Nat. Prod. [Online]. 3(4). pp. 178-
186.Available:http://acgpubs.org/RNP/2009/Volume%203/Issue%20 1/26-RNP-0903-92.pdf.
-
[5] Harmita. 2004. Petunjuk Pelaksanaan Validasi Metode dan Cara Perhitungannya. Majalah Ilmu Kefarmasian, 1(3). pp. 117-135.
-
[6] UNODC, Guidance for the Validation of Analytical Methodology and Calibration of Equipment Used for Testing of Illicit Drugs in Seized Material and Biological Specimens. New York: United Nations, 2009, pp. 9-12.
-
[7] C. C. Chan, Y. C. Lee, H. Lam, and X. M. Zhang. Analytical Method Validation and Instrument Performance Verification. Canada: John Wiley and Sons, 2004. pp. 37-39, 43.
-
[8] P.C. Dhandhukia and J. N. Thakker, Quantitative Analysis and Validation of Method Using HPTLC. Heidelberg: Springer, 2011. pp. 11-15.
-
[9] G. H. Gandjar dan A. Rohman. Kimia Farmasi Analisis. Yogyakarta: Pustaka Pelajar, 2007.
Discussion and feedback