Prioritized Mapping in Bali: Multi-View Hierarchical Agglomerative Clustering (MVHAC) Approach
on
pISSN : 2301 – 8968
JEKT ♦ 16 [1] : 67-96
eISSN : 2303 – 0186
Prioritized Mapping in Bali: Multi-View Hierarchical Agglomerative Clustering (MVHAC) Approach
Gede Andika, Lincolin Arsyad
ABSTRACT
This study aims to determine which sectors and areas should be prioritized in development in BalI. The data used is panel data from 2010 – 2022 for all districts/cities in Bali. The data analysis technique for mapping sectors and regions is Multi-View Hierarchical Agglomerative Clustering (MVHAC). The results of the analysis of Location Quotient and Dyanmic Location Quotient show that the SARBAGITA area (Denpasar, Badung, Gianyar, and Tabanan) has potential in the secondary and tertiary sectors, while other areas are in the primary sector. MVHAC analysis shows that in quadrant 1 (cluster 1), namely Badung and Denpasar, the sectors that can be developed are agriculture, forestry and fisheries; real estate; manufacturing industry; water supply, waste management and waste recycling and mining and excavation, the area of quadrant 3 (cluster 2) of Tabanan and Gianyar is almost similar to Badung and Tabanan, but the potential sector is also transportation and warehousing, while quadrant 4 (cluster 2) is more on the information and communication; real estate; educational services; health services and social activities.
Keywords: Prioritized Area, Potential Sector, Area Mapping
JEL Classifications: O21; R11; R58
INTRODUCTION
Economic development as a multidimensional process to accelerate economic growth, reducing inequality, and eliminating absolute poverty (Todaro, 1995:21). The substantive freedoms and strengthening the autonomy of individuals able to fully participate in economic activities must be seen as an interrelated process between the factors that produce economic growth nationally and
regionally (Sen, 1999; Todaro, 1995:24). Economic development is a long-term process related to capacities and capabilities among the individual, firms, or industries to achieve economic growth.
Regional development is the key to a country's development because the goals of national development will be achieved if each region can be carried out properly (Pike et al., 2011; Mahendrayasa, 2021). The objective of
regional development is to improve life and equal opportunities (Bachtler & Yuill, 2001; Mustafa, 2002; Andriyansyah et al., 2021). The regional development growth is expected to give impact to all communities in the development area known as inclusive growth (Kim & Daugherty, 2018).
Decentralization or known as regional autonomy is a manifestation of the government system shifting in Indonesia from centralized government system to localized (Maryanov, 2019; Vidyattama et al., 2020). The local government is demanded to be creative in creating economic opportunities as a responsibility to the region management authority. The changes of the government system are expected to improve government performance in public service, efficiency, and public finance (Permai et al., 2021). Nugroho & Sujarwoto (2021).
Figure 1. The Economic Growth and Gini Ratio in Bali
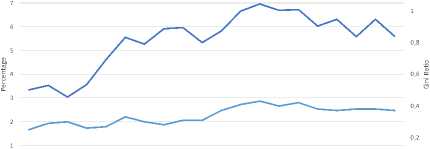
Source:2 2The 2Central 8 Bureau201of3Statistic17 o0f B9ali,
2020
Economics Growth (%) Gini Ratio (%)
The economic structure of Bali has a
unique characteristic when compared to other provinces, whereas the tourism industry is the leading sector that can encourage economic activity (Picard, 1996). Tourism as the main sector does not always support the uncertain situation and needs support from other sectors (Priatmoko et al., 2021; Subadra & Hughes, 2021). Tourism will not always have a direct effect on inclusive growth in Bali’s economic growth, because it is very dependent on regional potential and uncertain situations. Moreover, Bali is unique in terms of culture, customs, and social conditions which also affect the economic activities of the Balinese which are then interesting for discussion. Regional development by optimizing sources used to support economic growth were expected to
solve the problem of exclusiveness (Chong, 2020).
The effect of economic growth to income inequality or gini ratio conducted by many researchers. An empirical study of SDGs in Indonesia by Anwar et al (2021) shows if economic growth has an inverse relationship to gini ratio means if the economic growth increases and gini ratio decreases. In the long run, economic growth harm income equality, so the government need to focus on standard policies rather than selective for poor areas (Sari et al., 2021), while Amri & Nazamuddin (2018) show that in the long run there is a negative and significant relationship between the economic growth and income inequality, but in the short run will be positive and insignificant. Mukhlis et al (2018) argue that economic growth does not have any significant effect on income inequality.
Inequality between regions where one region is the leading area and the other is the lagging areas matter to solved. Handling lagging areas, the government should search for systemic, multisector
opportunities, and create a strategy map (Kaplan et al., 2018). The government commitment at different levels and combining a mix of policy inputs needed to meet territorial development needs and challenges (Bachtler, 2019). According to Farole et al (2018)argue to be rethinking about lagging regions by potential mapping of sector and area, then the government will focus on how leading areas give an impact to lagging regions. Regional prioritized mapping being important because of regional disparities between regions in developing countries (Ramesh Kumar et al., 2020). Region’s inequality records important to rank and analyze the condition of gini coefficient by mapping the development sectors and which areas should be prioritized.
Prioritized mapping areas and sectors that must be developed because it will give an impact on realizing inclusive economic growth. Through ranking the areas or regions, it will spread equal opportunities for underdeveloped regions (Giannakis & Bruggeman, 2020). Mapping on priority areas and sectors
will reduce an unequal development that will serve as a support for the development of surrounding areas that are still largely underdeveloped (Piętak, 2022). The priority areas should have well-established human resources, nature, infrastructure, and an adequate regional growth center. The adequate access will increase the opportunities of underdeveloped areas and grow to reduce regional disparities.
RESEARCH METHODS
This study aims to satisfy the researchers' curiosity and their need for a better understanding and need for additional information related to the integrative growth and mapping process offered in Bali. and explanatory research conducted through hypothesis formation (Blatter & Haberland, 2012).
Documentation techniques are used to collect data for this study by obtaining data from various documents or publications of relevant institutions. Data collection in this study was conducted by observing, recording, and reviewing descriptions of documents
contained in relevant authorities related to this study as previously described.
The development gaps of a region can be identified by using several approaches such as Klassen typology that will divides the economic growth pattern based on the quadrants and LQ can used to measure the base and not base sectors owned by a region (Mo et al., 2020; Soejoto et al., 2016). The four quadrants by Klassen divides as Quadrant 1 shows the advanced sector and it’s rapidly growing, Quadrant 2 shows the advanced sector but depressed to developed, Q3 is the sector which potential to developed, and Q4 show the sectors that relatively underdeveloped (Kuncoro & Idris, 2010). Klassen and LQ methods are used in common to determine the direction of development policy for future regional development. The weaknesses of Klassen and LQ cannot be used to identify the gaps of regional development and to measure the potential sectors (Munandar et al., 2018). Based on that weakness, the proposed method to analyze the development
gaps can be used Multiview Cluster by Hierarchical Agglomerative Clustering or MVHAC (Bickel & Scheffer, 2004; Fernandez & Gomez, 2008; Mirzaei, 2010; Munandar et al., 2018). This is not a new concept, but this concept tried to combine the strengths of Klassen, LQ, DLQ, and HAC methods into a single unit called MVHAC.
This method is usually used to know the direction of regional development based on the sector that is known as potential sector should be developed and it can be used LQ approach. This approach will help to determine which sector should be maintained to support the future development and which sector should be prioritized (Guimarães et al., 2009). LQ classified sectors into three clusters based on the value of GRDP per sector, the sector with a value of LQ>1 categorized as advanced and possibly to export. The sector with value LQ=1 nonbasic with a competitive advantage or the production of goods and services only meet within the region only. The sector with value LQ<1 means that
sector still needs an effort to be developed and it has no competitive advantage (Isserman, 1977). The calculation of LQ values follows:
LQ = ⅛^-Yj/Y
where:
LQ: The value of LQ of each analyzed GRDP sectors
Si: The value of GRDP sectors of district S: The value of GRDP sectors of province
-
Yj: The total GRDP of a district
-
Y: The total GRDP of a province
-
2. Dynamic Location Quotie (1) The dynamic location qu
overcome the static character of the standard of LQ by capturing the changes in sectoral structure over time during the analysis (Goschin, 2021; Pominova et al., 2021). DLQ will be beneficial for identifying the emerging trends in regional specialization and helps estimating future changes in the regional economy (Pribadi & Nurbiyanto, 2021). Combining the information from static and dynamic location quotients helps understanding the relative importance of economic activities, while also identifying future
growth opportunities (Yunus & Paembonan, 2021). If DLQ have score equal to 1 (DLQ = 1) mean the growth of sector i in the region i are same with the national level, if DLQ<1 means the growth is under of national level, and if DLQ>1 means the growth is higher than the national level (Dewi & Yasa, 2018; Jafar & Meilvidiri, 2021). The equation to calculate DLQ is:
(i+22zM1+Zl2i q (1+Rj)/(1 + R)
Where:
rij: average annual growth rate of employment in sector j and region i
ri: average annual growth rate of the overall economy of region i Rj : average annual growth rate of sector j at national level (2)
R: average annual growth rate national economy t: total time span (years)
development achievement (Katti et al., 2019). The weakness of Klassen Typology is that it is only able to classify the four-group based on the growth rate interval value of development.
This method is only able to classify the data of GRDP sectors into four groups based on the interval value of growth rate of development and the contribution rate of development between regions (Andriyani & Wibowo, 2019). The equation to calculate the growth of development is:
Pt - Pt-I
r = —— x 100%
pt-ι
(3)
where:
y: the development contribution of district and province
Pt: GRDP value of sector of the observation year
Pt-1: GRDP value of sector of the previous year
GDRP will be used as the main data to analyze by using Klassen Typology and produce four quadrants based on the group or gap of development. The classification will depend on the values of GRDP that indicate the level of
Pt - Pt-I y = ---— x 100% (4)
-
7I - Tt-I
-
r: Indicates the growth rate of district and province
Tt: shows total GRDP of the year observation
Tt-1: Total GRDP of the previous year
The equation to calculate the contribution rate of development is:
Clustering (HAC)
A bottom-up model developed to clustering development gap known as agglomerative clustering which clustered based on the distance of data object (Sasirekha & Baby, 2013). This method will be started by calculating the distance between data objects in this research and all of each distance will be seen as a singleton cluster to create a new cluster based on the distance classification (Lukasov, 1978). The equation to calculating the distance is follows:
" (5)
Deuc( χ,y) = D(^i- yt)
i=1
where:
Deuc: The euclidean distance between x and y as data object
-
n: The dimension of data number
-
x, y: The data object that will be calculated (first and second data object)
Agglomerative Clustering
(MVHAC)
Muller et al (2012) is proposed the multi view clustering to illustrate the
mapping of sectoral development in a particular area. Each region and sector will initially be clustered in the first phase then each group will be clustered again according to its potential sector and GPD growth (Munandar et al., 2018). Clustering analysis is widely used to see things from various existing perspectives and there are at least three types of multi-view clustering approaches, namely: 1) the multi-view spectral clustering method; 2) multi view subspace clustering method; 3) other multi view clustering methods. The multiview process can be carried out by using various data to evaluate a condition or combining several aspects to make conclusions to be drawn (Zheng et al., 2020). This regional mapping method can also be modified to accommodate matters related to data outliers and other problems, such as research conducted by Xu et al (2016) multi-view clustering methods, termed Weighted Multi-view Clustering with Feature Selection (WMCFS), which simultaneously performs feature selection and multi-view data clustering. The clustering method can
also be used in various cases or problems, not only in the process of mapping potential sectors and regions (Wu et al., 2019).
Different approaches implemented to measure regional mapping and sectors were conducted by Ismanto et al (2018) by adopting the Spearman’s Correlation Coefficient of Garret Ranking to measure the correlation between prioritized areas and the leading sectors and it can be an alternative ranking technique. Yuendi et al (2019) analyzed the specialization of the region by using Regional Specialization Index combined with Klassen Typology in Bali showing that the biggest contribution to GRDP is the tourism sector and not specialized in each region. Munandar et al (2017, 2018) tried to modify agglomerative clustering with location quotient and multiview hierarchical agglomerative cluster argue this method has closeness of development gain of every sector and accommodate the three previous methods into a unity that is LQ, Klassen, and shift share.
RESULTS AND DISCUSSION
Geographically, Bali Province is located at 8 ° 3'40 "- 8 ° 50'48" South Latitude and 114 ° 25'53 "- 115 ° 42'40" East Longitude. Relief and topography of the island of Bali in the middle of a mountain range that extends from west to east. Administratively it’s divided into eight regencies and one city, namely Jembrana, Tabanan, Badung, Gianyar, Karangasem, Klungkung, Bangli, Buleleng, and Denpasar City which are also the provincial capitals. Besides Bali Island, Bali Province also consists of other small islands, namely Nusa Penida Island, Nusa Lembongan, and Nusa Ceningan in Klungkung Regency, Serangan Island in Denpasar City, and Menjangan Island in Buleleng Regency. The total area of Bali Province is 5.634,40 ha with a beach length reaching 529 km (Badan Pusat Statistik Provinsi Bali, 2022).
Based on the results of the population census conducted every ten years, it shows that population growth in Bali continues to increase during the observation year. In 1961, the total population of Bali was 1.782.529 million
people and continued to increase in 1971 to 2.120.091. Population growth continues to increase from 1980, 1990, 2000, 2010, and 2020 to 2.469.724 people 2.777.356 million people, 3.146.999 million people, 3.890.757 million people, and 4.317.404 million people (Badan Pusat Statistik Provinsi Bali, 2022). However, the increase in population has not been followed by an even increase in welfare, this is characterized by a high gini ratio and economic growth that has not been inclusive of inequality. The increase in the population in Bali based on the census results can be seen through the figure below:
Figure 2. The Population Rate in Bali 1961 – 2020
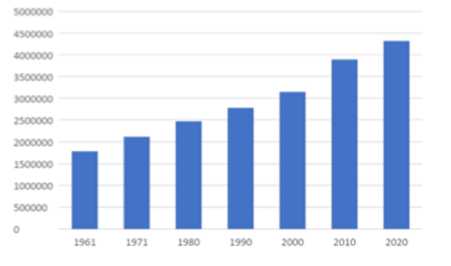
Source: BPS Bali Province, 2021 (data processed)
Mapping potential and area is an important part in realizing the success of development in an area to optimize resources in accordance with the
potential and role of each region in economic activity (Balland & Boschma, 2021).
LQ analysis will provide information about potential sectors to be developed by a region, but LQ measurements are static, so it needs to be combined with DLQ analysis to get more precise results for predictions of future sector and region development.
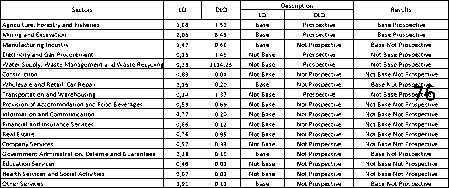
Based on the calculation of the LQ analysis, it is known that the sectors based in Badung Regency are the water supply, waste management and waste recycling sectors; construction; transportation and warehousing; provision of accommodation and food beverages, information and communication. Some sectors that are prospective to be developed in the future are agriculture, forestry, and fisheries; mining and excavation; manufacturing industry; water supply, waste management and waste recycling; transportation and warehousing; provision of accommodation and food
beverages, information and communication; real estate, company service. However, not all base sectors are prospective sectors developed in the future, such as construction, so that the basic and prospective sectors developed by Badung Regency to support its economy are water supply, waste management and waste recycling; construction; transportation and warehousing; provision of accommodation and food beverages, information and communication.
Table 1. LQ and DLQ Analysis of Badung Regency
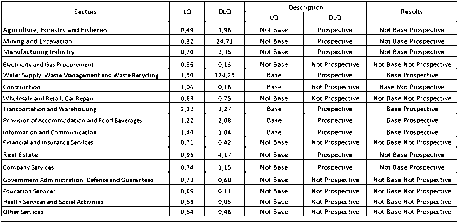
Source: Author’s computation using Excel (2022)
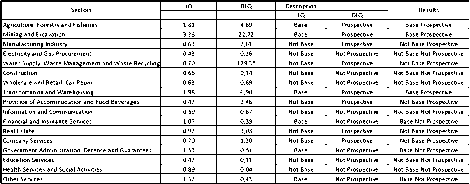
Buleleng Regency has a base in the agriculture, forestry, and fisheries sector; mining and excavation, wholesale and retail, car repair; information and communication; financial and insurance services; real
estate; government administration,
defense and guarantees, education
service; health service and social activities; other services. The sectors that
are basic and prospective to be developed in Buleleng Regency are agriculture, forestry, and fisheries;
mining and excavation; and real estate.
Table 2. LQ and DLQ Analysis of Buleleng Regency
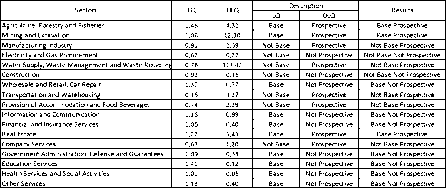
Source: Author’s computation using Excel (2022)
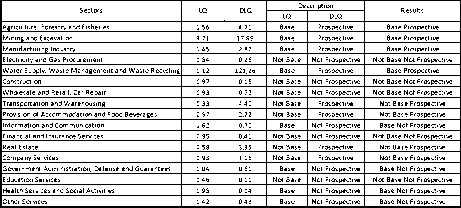
Agriculture, forestry, and fisheries sector; mining and excavation is also the base sector in Bangli. Manufacturing industry; wholesale and retail, car repair; manufacturing industry; government administration, defense and guarantees, and other services are not prospective to be developed in Bangli. The base sectors that are prospectively developed in Bangli Regency are the agriculture, forestry, and fisheries and mining and excavation
sectors.
Table 3. LQ and DLQ Analysis of Bangli Regency
Source: Author’s computation using Excel (2022)
Karangasem Regency has the same characteristics as Bangli Regency and is base and prospective in the agriculture, forestry, and fisheries and mining and excavation sectors, as well as transportation and warehousing. Sector is not based but prospective is manufacturing industry; water supply, waste management and waste recycling; provision of accommodation and food beverages; real estate; company service.
Table 4. LQ and DLQ Analysis of Karangasem Regency
Source: Author’s computation using Excel (2022)
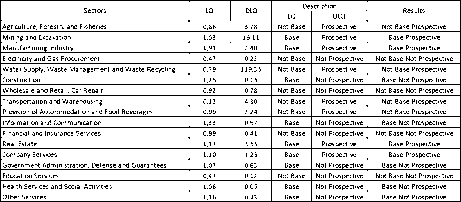
Klungkung Regency has a base and prospective sector to be developed in the agriculture, forestry, and fisheries and mining and excavation sectors; manufacturing industry; water supply,
waste management and waste recycling. Sectors that have the potential to be developed but are not the base sector to support the economy of Klungkung Regency in the future are transportation and warehousing.
Table 5. LQ and DLQ Analysis of Klungkung Regency
Source: Author’s computation using Excel (2022)
Gianyar Regency has a base and prospective sector such as mining and excavation; manufacturing industry; real estate; and company service. Meanwhile, some other base sectors are not prospective to be developed such as the construction sector; information and communication; health services and social activities, as well as other services.
Table 6. LQ and DLQ Analysis of Gianyar Regency
Source: Author’s computation using Excel (2022)
Tabanan Regency has a base sector to develop the agriculture, forestry, and fisheries; mining and excavation and manufacturing industry. The sector that is base but not prospective is construction; wholesale and retail, car repair; information and communication; real estate; government administration, defense and guarantees; health services and social activities, as well as other services. Manufacturing industry; water supply, waste management and waste recycling; transportation and
warehousing; provision of accommodation and food beverages; and company service are not base sectors but prospective.
forestry, and fisheries; transportation and warehousing; and real estate. Sectors that are not based but have the potential to be developed in the future such as mining and excavation, while the base but not prospective sectors are construction; manufacturing industry; water supply, waste management and waste recycling; company service; provision of accommodation and food beverages; and company service. Meanwhile, the sector that is based but not feasible to be developed in the future is the construction sector; wholesale and retail, car repair; information and communication. The agriculture, forestry, and fisheries and real estate sectors are both base and prospective sectors to be developed in Jembrana and Tabanan.
Table 7. LQ and DLQ Analysis of Tabanan Regency
Source: Author’s computation using Excel (2022)
Table 8. LQ and DLQ Analysis of Jembrana Regency
Source: Author’s computation using Excel (2022)
Jembrana Regency has base and prospective sectors such as agriculture,
Denpasar City as an industrial center area of Bali Province has a base and prospective sector in the manufacturing industry; water supply, waste management and waste recycling; provision of accommodation and food beverages; real estate and company services. The base sector but not fit for development is electricity and gas procurement; construction; wholesale and retail, car repair; financial and insurance services; education services; health services and social activities. The other sector is categorized as prospective to develop in the future but not the base sector for current year in Denpasar.
Table 9. LQ and DLQ Analysis of Denpasar Regency
Source: Author’s computation using Excel (2022)
Each district in Bali has its own base and prospective sectors according to the potential of the region it has. The base sector of one region with another region
can be different because each sector in a particular region has a different sector growth rate (Dewi & Yasa, 2018). The sector can also be said to be prospective while for the same sector in other regions it is categorized as non-prospective because it assesses the growth rate of the sector and its contribution to the economy (Setiawan, 2020). Each sector will grow differently from one region to another because the existing potential and resources that support the growth of the sector are different for each region (Naufal & Sumiyarti, 2019).
Badung Regency has a base and prospective sector in the water supply, waste management and waste recycling sectors; construction; transportation and warehousing; provision of accommodation and food beverages, information and communication. The results of this study are in accordance with the findings of Wiguna & Budhi (2019) stating that the base sector that is worth developing in Badung is the construction sector; transportation and warehousing; provision of
accommodation and food beverages. Putra & Yadnya (2018) also stated that the sector that deserves to be developed in Badung is the information and communication sector and provision of accommodation and food beverages. The transportation and warehousing became a base and prospective sector in Badung because of the existence of I Gusti Ngurah Rai International Airport located in Tuban, Badung which provides added value to the economy of Badung Regency. Badung also has several drinking water supply companies that meet the needs of various regions in Bali and is still the center of tourism development in South Bali such as Kuta and Nusa Dua so that the provision of accommodation and food beverages sector is also growing rapidly.
Bangli Regency has a base and prospective sector to encourage regional economic growth is the agriculture, forestry, and fisheries and mining and excavation sector. The results of this finding are in accordance with research conducted by Yuendi et al (2019) that
Bangli Regency has an LQ and DLQ value greater than one in the sector which is supported by the geographical location and topographical conditions of Bangli Regency which is in the highlands with cool air. The potential developed in Bangli is shallots, cabbage, chickpeas, pumpkin, spinach, oranges, bananas, tobacco, and coffee plants that have reached export (Widhianthini & Djelantik, 2019). The findings of Sugiari & Sudarma (2019) that the agricultural sector in a broad sense in Bangli has transformed into agricultural services and towards the agricultural product processing industry to increase the added value of the agricultural sector to the economic growth of Bangli Regency. In addition to Bangli Regency, the agriculture, forestry, and fisheries sector is also a base and prospective in Buleleng, Karangasem, and Klungkung Regencies. The findings of research by Wiwekananda & Utama (2016) show that agriculture contributes positively to the economy of Buleleng, then Helmi et al (2021) discuss in more detail the commodities owned by Buleleng Regency are quite diverse and each
district has its own characteristics. However, Karangasem Regency is the eastern end of Bali and Jembrana Regency at the western end has the potential for transportation and warehousing because it has several ports such as Padang Bai and Gilimanuk. Kesuma & Utama (2015) show that theleading sectors of Klungkung Regency are the agricultural sector, the mining and quarrying sector, the building sector, and the services sector. Based on Shift Share analysis, the total number of service sectors has the greatest positive value, which is then followed by the industrial sector, while the agricultural sector has a negative value. So it can be said that Klungkung Regency has experienced a shift in economic structure, namely from the agricultural sector to the service sector.
Gianyar Regency and Denpasar City have bases and prospects in the manufacturing industry. These two regions have large processing industry activities so that they have a positive
impact on regional economic growth. Gianyar has a huge processing industry potential ranging from handicraft industry products to subsector processing of agricultural products (Bani et al., 2020). The development of MSMEs and tourism villages is also very active in Gianyar Regency to improve the local economy that supports the tourism sector (Dewi et al., 2022). Meanwhile, Denpasar City is the center of economic activity of Bali Province so that it becomes the most populous industrial area and grows very quickly compared to other districts (Putra & Yadnya, 2018). Denpasar City is also designed to be a national strategic area and become an urban area so that the main activities are not in the agricultural sector but rather in the activities of urban settlements, government activities, social and economic activities, so that agricultural activities are only still taking place in non-urban areas in Bali such as Karangasem, Buleleng, Jembrana, Bangli, and Klungkung Regency.
Table 10. Klassen Typology of Regency/City in Bali
|
Bali Regency/City Sectors ------------------------ Description g s gi si |
Quadrant |
|
BadungRegency 0,09 7,11% 0,63 7,13% DeveIopedandFastGrowingArea |
1 |
|
BuIeIengRegency 0,09 7,11% 0,05 5,87% RelativeIyUnderdeveIopedArea |
4 |
|
Bangli Regency 0,09 7,11% 0,34 7,01% Developed but Depressed Area |
2 |
|
KarangasemRegency 0,09 7,11% 0,09 7,01% RelativeIyUnderdeveIopedArea |
4 |
|
KIungkungRegency 0,09 7,11% 0,09 7,06% RelativeIyUnderdeveIopedArea |
4 |
|
GianyarRegency 0,09 7,11% 0,08 7,13% FastGrowingArea |
3 |
|
TabananRegency 0,09 7,11% 0,08 7,15% FastGrowingArea |
3 |
|
JembranaRegency 0,09 7,11% 0,09 7,03% RelativeIyUnderdeveIopedArea |
4 |
|
DenpasarCity 0,09 7,11% 0,09 7,25% DeveIopedandFastGrowingArea |
1 |
Source: Author’s computation using Excel (2022)
Based on the results of the Klassen typology analysis of regencies and cities in Bali, areas that are categorized as developed and fast growing are Badung Regency and Denpasar City which are the centers of economic and government activity in Bali. Badung and Denpasar have high potential for economic growth and are supported by the industrial and tourism sectors as indicated by high economic growth and GDP per capita. This condition is very different from other districts in Bali which experience low growth rates (Raeskyesa et al., 2019).
Bangli Regency is also an area that is growing rapidly in various business
sectors, but the development conditions are categorized as depressed because other than sectoral development problems, there are still many problems of poverty, inequality, unemployment, and efforts to maximize economic growth are still not inclusive. The competitive level of the business sector built in Bangli is also still low compared to the provincial level and its growth is still dominated by the agricultural sector, while the agricultural sector has a low contribution value if it is only built directly without involving processing industries or agrotourism (Suarmanayasa et al., 2019). The dominance of economic growth by the agricultural sector which is still
traditional makes Bangli Regency grow but is not optimal in the development of other sectors to encourage other economic growth.
Gianyar and Tabanan Regencies as areas that can grow quickly compared to other districts in Bali. Geographically, the regency is close to Badung Regency and Denpasar City so that it has a big impact on development in Gianyar and Tabanan Regencies. The construction of the Ida Bagus Mantra Road infrastructure that connects Denpasar and Gianyar also has a connection with the occurrence of mobilization from Gianyar to Denpasar and vice versa, so that economic activity also increases (Suprapto, 2015). The existence of this road infrastructure is very important to move potential resources from Denpasar City to Gianyar so that the area can grow quickly. Tabanan Regency is also a regency that connects Denpasar City and Jembrana Regency with the main Seririt-Gilimanuk road which is a national road. The existence of this connecting road has an indirect impact on development in Tabanan
Regency because the people who will mobilize to Jembrana will pass through Tabanan (Hidayat et al., 2021). Apart from that, dense residential conditions in Denpasar also encourage people to mobilize from Tabanan to Denpasar with a lower cost of living and indirectly this builds economic connectivity between Denpasar City and Tabanan Regency, so that Tabanan has the potential to grow fast as well as follow development that occurred in the city of Denpasar.
The results of the Klassen Typology analysis show that the region that has the fastest growing economy is the SARBAGITA area (Denpasar, Badung, Gianyar, and Tabanan). As the regions of Badung and Denpasar are developed and growing rapidly, the Regencies of Tabanan and Gianyar have great potential to grow rapidly. Regional inequality still occurs if you look at the development that has occurred in Bangli Regency, even though it has quite good growth, but in some economic sectors it does not grow optimally, so that rapid economic growth does not occur. In
addition, areas outside the SARBAGITA Area are still experiencing problems of poverty, inequality, and high unemployment and are classified as underdeveloped areas.
HAC analysis is used to cluster sectors and regions in an area that have the closest resemblance or distance between one region or one sector to other sectors or regions. The HAC analysis carried out will be valid if the amount of data analyzed already has a validity of 100 percent as shown in table 21 that no data is lost when carrying out data analysis.
Table 11. Data Validity of HAC Analysis
Cases
Valid Missing Total
N Percent N Percent N Percent 9 100.0 0 .0 9 100.0
-
a. Average Linkage (Between Groups)
Source: Author’s computation using SPSS 29 (2022)
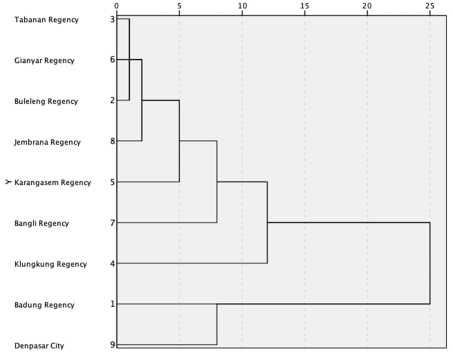
The results of the cluster analysis show that Badung and Denpasar regencies have characteristics and are close to each other compared to other regencies in Bali. Tabanan Regency is closer and
similar to Gianyar Regency because it is still in the strategic area of SARBAGITA and Buleleng Regency because it is directly adjacent geographically so that it has characteristics that tend to be similar in the context of development. Klungkung, Bangli, Karangasem districts tend to be the same because they are in the same area as the East Bali region, but Jembrana Regency, which is on the western tip of Bali Island, has characteristics similar to the three districts. The similarity and close distance between these regencies is determined by the contribution value of the developing sector in the region and the average growth that occurs in that sector to boost the regional economy.
Figure 3. Regency Clusters of Bali Province
Source: Author’s computation using SPSS 29 (2022)
Figure 4. Dendogram of Average Linkage
Source: Author’s computation using SPSS 29 (2022)
The results of the cluster analysis show that Badung and Denpasar regencies have characteristics and are close to each other compared to other regencies in Bali. Tabanan Regency is closer and similar to Gianyar Regency because it is still in the strategic area of SARBAGITA and Buleleng Regency because it is directly adjacent geographically so that it has characteristics that tend to be similar in the context of development. Klungkung, Bangli, Karangasem districts tend to be the same because they are in the same area as the East Bali region, but Jembrana Regency, which is on the western tip of Bali Island, has characteristics similar to the three districts. The similarity and close
distance between these regencies is determined by the contribution value of the developing sector in the region and the average growth that occurs in that sector to boost the regional economy.
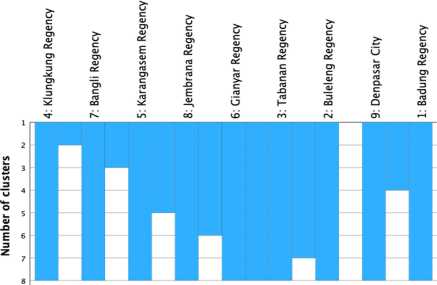
The division of regencies/cities in Bali into three clusters builds three clusters which have their respective members. Cluster 3 has members from the Regencies of Tabanan, Gianyar, Buleleng, and Jembrana, which means that the three regencies have similar characteristics from the development that has taken place in these areas. Geographically, Gianyar and Tabanan Regencies naturally have similar characteristics because both of them received the impact effect of development in Badung and Gianyar Regencies at the same time. In cluster 2 there are Karangasem, Bangli and Klungkung regencies which have the same characteristics because the three regencies are also in the same regional area, thus encouraging the similarity of the development characteristics that occur. Then in cluster 1 there are Badung and Denpasar Regencies which
are members of the cluster with economic growth values and sector contributions that are quite different compared to other regencies or regions in Bali. This is very likely to happen because the two regencies are central areas of economic and governmental activity which are supported by the
Case Nujnber RegencyZCityr Cluster Distance rapid development of the tourism sector
Regency
in Bali. Buleleng 2 3.439
Regency
In an effort to facilitate the analysis to3be Regency
carried out, the researchers groupedD the Regency
regencies/citiesngin Bali only into 6 two σ Regency j
clusters whichW would then be further Regency
analyzed using the analytical 6∙ tools suggested in!' this a study. Based on 7 the results of the^analysis of table 24, it is known that Badung Regency and Denpasar City are included as members of cluster 1, while in cluster 2 there are Buleleng, Tabanan, Gianyar, Bangli, Klungkung, Buleleng, and Jembrana Regencies. The results of this cluster membership analysis show that there are significant differences between the two regencies that are included as capital areas compared to other areas in Bali, so it can be concluded that there is
an imbalance between regencies and
cities in Bali. Development is still only centered on region 1 cluster, while development results are not spread evenly to other areas in cluster 2, so that even though several areas in cluster 2 are close to Badung and Denpasar, they are different clusters.
Table 12. Cluster Membership Results
Source: Author’s computation using SPSS 29 (2022)
Partial development experienced in an area that is not followed by equity will experience inequality due to differences in natural resources, human resources, other supporting factors such as information and communication networks, availability of electricity and supporting infrastructure. These factors will then widen the inequality of a region (Krismaningrung & Marseto,
2020). The development that has taken place in Bali has not encouraged convergence of economic growth, that is, districts that are still lagging compared to other districts should be able to catch up, not to be increasingly left behind. The results of research conducted by found that in Bali Province there is still an increase in disparities and there is no direction towards economic convergence (Juliarta & Setyari, 2022). Efforts to reduce regional inequality must continue to be carried out to reduce the dependence of underdeveloped regions on developed regions so that people's welfare increases (Suryantini et al., 2022).
-
4. Multi View Hierarchical Agglomerative Clustering (MVHAC) Analysis that can be used in mapping potential sectors that can be developed in an area can be done by conducting LQ and DLQ analysis, while to see inequalities that occur between regions can use Klassen and HAC analysis. These analysis tools have their respective weaknesses, so it is necessary to make comparisons to draw conclusions about how sector
development is occurring in an area and which areas should be prioritized in development through programs implemented by local governments. In the MVHAC analysis, the results of regional cluster grouping carried out in the HAC analysis will be followed by comparing regions in the same cluster according to the sectors developed in the region.
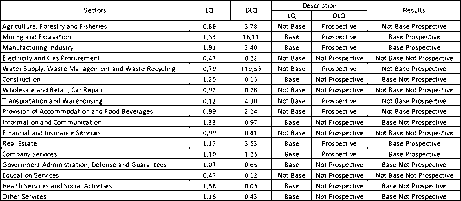
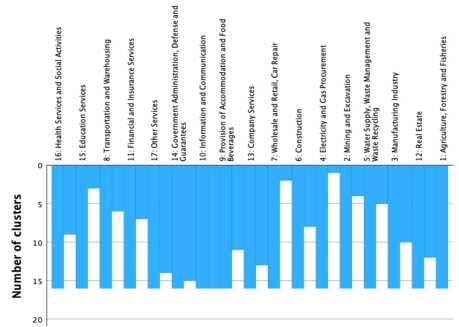
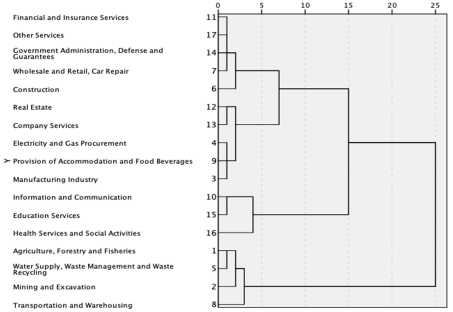
MVHAC analysis will only group areas that are in the same cluster and then look at how each sector is grouped in the cluster. The results of the analysis show that the provision of accommodation and food beverages sector; information and communication; government administration, defense, and guarantees; other services; wholesale and retail, car repair; company service; financial and insurance services; and transportation and warehousing are in one cluster, namely cluster 3, which means that in Badung Regency and Denpasar City these sectors have a similar growth average and still have a fairly low growth rate when compared to sectors
in cluster two, namely education services ; health services and social activities; procurement of electricity and gas; and construction. Then the sectors in cluster 1 are the agriculture, forestry, and fisheries sectors; real estate; manufacturing industry; water supply, waste management, and waste recycling; and mining and excavation.
Figure 5. Quadrant 1 (Cluster 1) MVHAC Results
Source: Author’s computation using SPSS 29 (2022)
The North Badung area and several areas in Denpasar still have activities in agriculture and fisheries, so this sector is still considered an important sector and has the potential to grow in the area. Then the education services sector; health services and social activities;
procurement of electricity and gas; and construction is a very important sector.
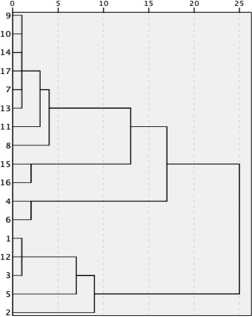
Figure 6. Dendogram of Average Linkage MVHAC Results
Provision OfAccommodation and Food Beverages
Information and Communication
CovernmentAdmInistration, Defense and Guarantees
Other Services
Wholesale and Retail, Car Repair
Company Services
Financial and Insurance Services
Transportation and Warehousing
-
> Education Services
Health Services and Social Activities
Electricity and Gas Procurement
Construction
Agriculture, Forestry and Fisheries
Real Estate
Manufacturing Industry
Water Supply, Waste Management and Waste
Recycling
Mining and Excavation
Source: Author’s computation using SPSS 29 (2022)
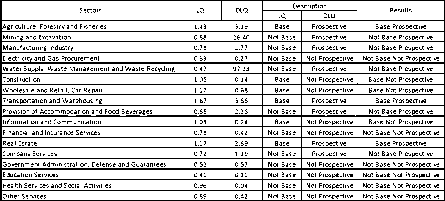
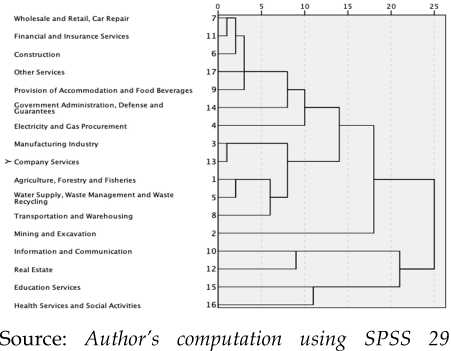
The regencies that are included in quadrant 3 and cluster 2 are Gianyar and Tabanan Regencies which have the same characteristics and are close to each other compared to other regencies. The results of the analysis in table show that the financial and insurance services sector; other services; government administration, defense and guarantees; wholesale and retail, car repair; construction; real estate; company service; electricity and gas procurement is included in cluster 3 which has a relatively low contribution and growth in Gianyar and Tabanan Regencies. Provision of accommodation and food
beverages sector; manufacturing industry; information and communication; educational services; health services and social activities are in cluster 2, while other sectors are in sector 3 which have the potential to grow rapidly in the two districts, namely the agriculture, forestry and fisheries sectors; real estate; manufacturing industry; water supply, waste management, and waste recycling; mining and excavation; and transportation and warehousing.
Figure 7. Quadrant 3 (Cluster 2) MVHAC Results
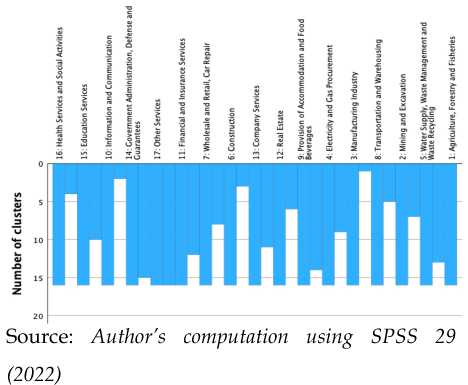
Figure 8. Dendogram of Average Linkage MVHAC Results
Source: Author’s computation using SPSS 29 (2022)
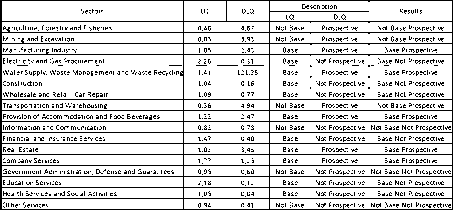
Bangli, Jembrana, Buleleng, Karangasem, and Tabanan districts are in quadrant 4 and cluster 2 which shows that the five districts have similar characteristics. Based on the results of figure 13, districts outside the SARBAGITA area have different sector divisions in clusters compared to the SARBAGITA area which indicates that these five districts must receive treatment according to their potential because the economic structure and economic growth are already different so that the district can maximize its development potential.
The results of the analysis of figure above show that the wholesale and retail sector, car repair; financial and insurance services; construction; other services; provision of accommodation and food beverages; government administration, defense, and guarantees; and manufacturing industry is a sector
that is included in cluster 3 which has a relatively low contribution and growth in the five regencies. Company service sector; agriculture, forestry and fisheries; water supply, waste management, and waste recycling; transportation and warehousing; and mining and excavation were able to grow better and become members of cluster 2. Sectors with maximum growth potential for the region are information and communication; real estate; educational services; health services and social activities in cluster 1 for the five districts in quadrant 4.
Figure 9. Quadrant 4 (Cluster 2) MVHAC Results
Source: Author’s computation using SPSS 29 (2022)
Figure 10. Dendogram of Average Linkage MVHAC Results
(2022)
Research conducted by Kurniawan & Huda (2020) found that Badung and Denpasar Regencies are in the same quadrant and cluster because they are developed and fast-growing regions in the Province of Bali. In quadrant III there is only Gianyar Regency, but in this study there are Gianyar and Tabanan Regencies, while other districts are included in quadrant IV as areas that are still lagging behind. Efforts to equalize economic growth cannot be carried out solely through the tourism sector, even though every region in Bali has tourism potential, each region has potential characteristics that should be further developed (Krismiyanti & Utama, 2022). The results of the analysis show that the regions in quadrants I and
III in clusters I and II have the same potential characteristics for development because they are included in the same area, but are different from the others.
CONCLUSION
The sectors that should be prioritized in Bali based on the LQ and DLQ analysis are the primary sectors for the Karangasem, Klungkung, Bangli, Jembrana and Buleleng Regencies because they are the basis and prospective sectors to be developed in the future for each region. Then, if it is to be developed based on regional progress, then in the quadrant 1 region (cluster 1), namely Badung and Denpasar, the sectors that can be developed are agriculture, forestry and fisheries; real estate; manufacturing industry; water supply, waste management and waste recycling and mining and excavation. Quadrant 3 area (tabanan and Gianyar clusters agriculture, forestry and fisheries; real estate; manufacturing industry; water supply, waste management and waste recycling, and transportation and
warehousing. Quadrant 4 area (cluster 2) is more in the information and communication sector; real estate ; education services; health services and social activities. Based on Klassen's analysis, areas that should be prioritized are development outside the SARBAGITA area, such as Bangli Regency, which has grown well but is not yet optimal, then Buleleng, Jembrana, Karangasem, and Klungkung regencies which are still relatively lagging.
The development of the sectors of each region in Bali should pay attention to the developing potential and characteristics of the region, so that not all regions have to develop the tourism sector if the region does not have a basis and prospects for that sector which then results in suboptimal economic growth. Development must begin to be directed outside the SARBAGITA area to increase the economic growth of areas that are still lagging, such as Karangasem, Buleleng, Jembrana and Klungkung.
REFERENCES
Agung Tri Sugiari, A., & Sudarma, M. (2019). Relative Potential of Agricultural Sector in Economic Development of Bangli Regency. E-Jurnal Agribisnis Udayana.
Andriyansyah, Nurwanda, A., & Rifai, B. 2021. Structural Change and Regional Economic Growth in Indonesia. Bulletin of Indonesian Economic Studies.
Amri, K., & Nazamuddin. (2018). Is There Causality Relationship Between Economic Growth and Income Inequality?: Panel Data Evidence From Indonesia. Eurasian Journal of Economics and Finance, 6(2), 8–20.
https://doi.org/10.15604/ejef.2018. 06.02.002
Anwar, A. F., Asnun, A. P., & Wahab, A. (2021). A new decade for social changes Measuring the Impact of Inclusive Economic Growth; Empirical Study of SDGs in Indonesia. Technium Social Sciences Journal, 25, 192–218.
Bachtler, John. (2019). Towards Cohesion Policy 4.0: structural transformation and inclusive growth. ROUTLEDGE.
Bachtler, John., & Yuill, Douglas. (2001). Policies and strategies for regional development: a shift in paradigm? (No. 46). University of Strathclyde, European Policies Research Centre.
Badan Pusat Statistik Provinsi Bali. (2022). Provinsi Bali Dalam Angka 2022 “Bali Province in Figures.” Badan Pusat Statistik Provinsi Bali.
Balland, P. A., & Boschma, R. (2021). Mapping the potentials of regions in Europe to contribute to new knowledge production in Industry
-
4.0 technologies. Regional Studies, 55(10–11), 1652–1666.
Bani, Y. F., Budiasa, I. W., & Widyantara, I. W. (2020). Tipologi dan Potensi Sub Sektor Pertanian di Kabupaten Gianyar. Jurnal Agribisnis Dan Agrowisata, 9(1), 49– 58.
Bickel, S., & Scheffer, T. (2004). MultiView Clustering. Universitat zu Berlin.
Chong, K. L. (2020). The side effects of mass tourism: the voices of Bali islanders. Asia Pasific Journal of Tourism Research by Taylor, 25(2).
Dewi, L. K. C., Yuni, L. K. H. K., & Antari, N. L. S. (2022). Pengembangan UMKM dan Desa Wisata di Kabupaten Gianyar. www.mitrawacanamedia.com
Dewi, N. M. W. S., & Yasa, I. N. M. (2018). Analisis Sektor Potensial dalam Menetapkan Perencanaan Pembangunan di Kabupaten Karangasem. E-Jurnal EP Udayana, 7(1), 152–183.
Farole, T., Goga, S., & Heroiu, M. L. (2018). Rethinking Lagging Regions.
Fernandez, A., & Gomez, S. (2008). Solving non- uniqueness in agglomerative hierarchical
clustering using multidendrograms. Journal of Classification, 25, 43–65.
Giannakis, E., & Bruggeman, A. (2020). Regional disparities in economic resilience in the European Union across the urban–rural divide. Regional Studies, 54(9), 1200–1213. https://doi.org/10.1080/00343404. 2019.1698720
Goschin, Z. (2021). Economic Specialization of Romanian Regions and Counties. Insights Drawn from
Static and Dynamic Location Quotients. Economic Specialization of Romanian Regions and Counties, 83– 111.
Guimarães, P., Figueiredo, O., & Woodward, D. (2009). Dartboard tests for the location quotient. Regional Science and Urban Economics, 39(3), 360–364.
Helmi, M., Putu Sriartha, I., & Made Sarmita, I. (2021). Strategi Pengembangan Komoditas
Unggulan Subsektor Tanaman Perkebunan di Kabupaten Buleleng. Jurnal Pendidikan Geografi Undiksha, 9(1), 26–35.
Hidayat, D. W., Mardikawati, B., Oktopianto, Y., & Shofiah, S. (2021). Analisis Lalu Lintas Ruas Jalan Denpasar-Gilimanuk Tabanan Bali Masa Pendemi Covid 19. Jurnal Keselamatan Transportasi Jalan (Indonesian Journal of Road Safety), 8(2), 137–144.
Ismanto, H., Azhari, S., & Arsyad, L. (2018). Ranking Method in Group Decision Support to Determine the Regional Prioritized Areas and Leading Sectors using Garrett Score. IJACSA) International Journal of Advanced Computer Science and Applications, 9(11).
Isserman, A. M. (1977). The Location Quotient Approach to Estimating Regional Economic Impacts. Journal of the American Planning Association, 43(1), 33–41.
Jafar, R., & Meilvidiri, W. (2021). Analisa Location Quotient (LQ), Dynamic Location Quotient (DLQ), dan Klasifikasi Carvalho dalam Menentukan Potensi Ekonomi
Kabupaten Takalar. Journal of Regional Economics, 2(3), 30–40.
Juliarta, I. M. G., & Setyari, N. P. W. (2022). Analisis Disparitas Wilayah Dilihat dari Perekonomian Kabupaten/Kota Provinsi Bali: Pendekatan Sigma dan Beta Konvergen. Buletin Studi Ekonomi, 27(1), 43–52.
https://ojs.unud.ac.id/index.php/ bse/
Kaplan, R. S., Serafeim, G., &
Tugendhat, E. (2018). Inclusive Growth: Profitable Strategies for Tackling Poverty and Inequality. Harvard Business Review, 96(1), 127– 133.
Kesuma, N.L.A. & Utama, I.M.S. 2015. Analisis Sektor Unggulan dan Pergeseran Pangsa Sektor-sektor Ekonomi Kabupaten Klungkung. JEKT, 8(1), 100-107.
Krismaningrung, N. M. P., & Marseto. (2020). Analisis Ketimpangan Ekonomi dan Potensi Pertumbuhan Ekonomi Daerah Wisata Laut dan Daerah Wisata Gunung Di Provinsi Bali. Journals of Economics Development Issues (JEDI), 3(1), 61– 69.
Krismiyanti, N. M. E., & Utama, M. S. (2022). Pengaruh Sektor Pariwisata dan Kualitas Sumber Daya Manusia Terhadap Kesempatan Kerja dan Ketimpangan Distribusi
Pendapatan. E-Jurnal EP Udayana, 9(6), 1261–1289.
Kuncoro, M., & Idris, A. N. (2010). Mengapa terjadi growth without development di provinsi kalimantan timur. Jurnal Ekonomi Pembangunan, 11, 172–190.
Kurniawan, R., & Huda, S. (2020).
Analisis Pertumbuhan Ekonomi dan Ketimpangan Distribusi Pendapatan Provinsi Bali. Jurnal Dinamika Ekonomi Pembangunan, 3(2), 335–344.
https://doi.org/10.33005/jdep.v3i2 .115
Lukasov, A. (1978). Hierarchical Agglomerative Clustering
Procedure. Pattern Recognition, 11, 365–381.
Mahendrayasa, I.N. 2021. The Relationship Among Economic Structure, Sectoral Workforce, and Community Welfare in Bali Province. JEKT, 14(2), 401-425.
Maryanov, G. S. (2019). Decentralization in Indonesia as a Political Problem (1st ed.). Cornell University Press.
Mirzaei, H. (2010). A Novel Multi-View Agglomerative Clustering
Algorithm Based on Ensemble of Partitions on Different Views. International Conference on Pattern Recognition.
Mo, S. W., Lee, K. B., Lee, Y. J., & Park, H. G. (2020). Analysis of import changes through shift-share,
location quotient and BCG
techniques: Gwangyang Port in Asia. Asian Journal of Shipping and Logistics, 36(3), 145–156.
Mukhlis, I., Hidayah, I., & Sariyani, S. (2018). Economic agglomeration, economic growth, and income inequality in regional economy. Economic Journal of Emerging Markets, 10(2), 205–212.
Muller, E., Gunnemann, S., Farber, I., & Seidl, T. (2012). Discovering multiple clustering solutions:
Grouping objects in different views of the data. 28th International Conference on Data Engineering.
Munandar, T. A., Azhari, Musdholifah, A., & Arsyad, L. (2018). Multiview hierarchical agglomerative
clustering for identification of development gap and regional potential sector. Journal of Computer Science, 14(1), 81–91.
Munandar, T. A., Musdholifah, A., Arsyad, L., & Gadjah Mada, U. (2017). Modified Agglomerative Clustering with Location Quotient for Identification of Regional Potential Sector. Journal of Theoretical and Applied Information Technology, 15(5).
Mustafa, D. (2002). Regional and Local Economic Analysis Tools.
Naufal, D. P. T., & Sumiyarti. (2019). Potensi Ekonomi Wilayah Cepat Maju dan Cepat Tumbuh di Provinsi Jawa Barat. Jurnal Ekonomi KIAT, 30(1), 64–69.
Nugroho, Y., & Sujarwoto. (2021). Institutions, Outputs and Outcomes: Two Decades of Decentralization and State Capacity in Indonesia. Journal of Southeast Asian Economies (JSEAE), 38(3), 296– 319.
Park, C.-Y., & Claveria, R. (2018). Does Regional Integration Matter for Inclusive Growth? Evidence from the Multidimensional Regional Integration Index (No. 559).
Piętak, Ł. (2022). Regional disparities, transmission channels and country’s economic growth. Journal of Regional Science, 62(1), 270–306.
Pike, A., Rodriguez-Pose, A., &
Tomaney, J. (2011). Handbook of
Local and Regional Development (First Edition). Routledge Economics.
Pominova, M., Gabe, T., & Crawley, A. (2021). The Pitfalls of Using Location Quotients to Identify Clusters and Represent Industry Specialization in Small Regions. International Finance Discussion Paper, 2021(1329), 1–25.
https://doi.org/10.17016/IFDP.202 1.1329
Priatmoko, S., Kabil, M., Magda, R., Pallas, E., & David, L. D. (2021). Bali and The Next Proposed Tourism Development Model in Indonesia. Regional Science Inquiry, XIII(2), 161–180.
https://www.researchgate.net/pu blication/356839146
Pribadi, Y., & Nurbiyanto. (2021).
Central Lampung Regency Competitiveness Measurement: Location Quotient and Shift-Share Analysis. Jurnal Kelitbangan, 9(3), 299–310.
Putra, P. I. P., & Yadnya, I. P. (2018). Analisis Sektor Unggulan Perekonomian di Kabupaten/Kota Denpasar, Badung, Gianyar, dan Tabanan. E-Jurnal Manajemen Universitas Udayana, 7(10), 5657– 5685.
Raeskyesa, D. G. S., Suryandaru, R. A., & Kadarusman, Y. B. (2019). Analysis on Growth Pattern. Jurnal Ilmu Manajemen & Ekonomika, 11(2), 45–56.
Ramesh Kumar, K., Sivakumar, I., Saravanakumar, N., &
Sathishkumar, R. (2020). Regional disparities and indian states: A macro level study. Journal of Critical Reviews, 7(13), 87–92.
Sari, Y. M., Aliasuddin, & Silvia, V.
(2021). Economic Growth and Income Inequality in ASEAN-5 Countries. International Journal of Advanced Research in Economics and Finance, 3(4), 34–44.
https://doi.org/10.55057/ijaref.202 1.3.4.4
Sasirekha, K., & Baby, P. (2013). Agglomerative Hierarchical Clustering Algorithm-A Review. International Journal of Scientific and Research Publications, 3(3).
Sen, A. (1999). Development as Freedom.
Setiawan, F. (2020). Analisis Potensi Sektor Basis Dan Non-Basis Kota Sabang Tahun 2013-2019. International Journal of Government and Social Science, 6(1), 89–104.
Soejoto, A., Fitrayati, D., Rachmawati, L., & Sholikhah, matush. (2016). Typology of Regional Economic Development Pattern. IJABER, 14(13), 9493–9505.
Suarmanayasa, I. N., Susila, G. P. A. J., & Bagia, I. W. (2019). Determination of Potential Economic Sectors to Support Economic Development Planning. Advances in Economics, Business and Management Research, 69, 69–74.
Subadra, I. N., & Hughes, H. (2021). Pandemic in paradise: Tourism pauses in Bali. Tourism and Hospitality Research by SAGE Journals, 22(1), 122–128.
Sukirno, S. (2010). Makro Ekonomi Teori Pengantar. (Edisi Kelima). STIE YKPN.
Suprapto, P. A. (2015). Dampak Pembangunan Bypass Ida Bagus Mantra Terhadapalih Fungsi Lahan
Pertanian Di Provinsi Bali. Jurnal Komunikasi Hukum, 1 (1), 95–107.
Suryantini, N. P. S., Darmayanti, N. P. A., Wibawa, I. M. A., & Gede, I. G. K. (2022). Analisis Pertumbuhan Ekonomi dan Ketimpangan Regional Di Propinsi Bali. Jurnal Bisnis & Kewirausahaan, 18(1), 2022.
Todaro, M. P. (1995). Ekonomi Untuk Negara Berkembang (Edisi Ke-3). Bumi Aksara.
Vidyattama, Y., Sugiyarto, Sutiyono, W.2020. Budget Delay: between Local Capacity, Bargaining or Political Interaction in Three Study Cases. Bulletin of Indonesian Economic Studies.
Widhianthini, W., & Djelantik, A. A. A. W. S. (2019). Model Perencanaan Kawasan Pertanian di Kabupaten Karangasem, Provinsi Bali Pasca Erupsi Gunung Agung. Journal of Regional and Rural Development Planning, 3(1), 11.
Wiguna, I. M. G. S., & Budhi, M. K. S. (2019). Analisis Sektor Unggulan dan Potensi Pertumbuhan Ekonomi di Kabupaten Badungtahun 20122016. E-Jurnal EP Udayana, 8(4), 810–841.
Wiwekananda, I. B. P., & Utama, I. M. S. (2016).
Transformasi Struktur Ekonomi d an Sektor Unggulan di Kabupate n Buleleng Periode 2008-2013. Jurnal Ekonomi Kuantitatif Terapan, 9(1), 37–45.
Wu, W., Bang, S., Bleecker, E. R., Castro, M., Denlinger, L., Erzurum, S. C., Fahy, J. v., Fitzpatrick, A. M., Gaston, B. M., Hastie, A. T., Israel, E., Jarjour, N. N., Levy, B. D., Mauger, D. T., Meyers, D. A.,
Moore, W. C., Peters, M., Phillips, B. R., Phipatanakul, W., … Wenzel, S. E. (2019). Multiview cluster analysis identifies variable corticosteroid response phenotypes in severe asthma. American Journal of Respiratory and Critical Care Medicine, 199(11), 1358–1367.
Xu, Y. M., Wang, C. D., & Lai, J. H. (2016). Weighted Multi-view Clustering with Feature Selection. Pattern Recognition, 53, 25–35.
Yuendi, E. P., Rachmi, I. N., Puspitasari, N. N. A., Harini, R., & Alfana, M. A. F. (2019). Analisis Potensi Ekonomi Sektor Pertanian dan Sektor Pariwisata di Provinsi Bali Menggunakan Teknik Analisis Regional. Jurnal Geografi, 16(2), 128– 136.
Yunus, S., & Paembonan, L. (2021). Using Location Quotient to Analyze Post-Disaster Economic Potential in The Pasigala Region, Central Sulawesi, Indonesia. International Journal of Entrepreneurship, 25(6), 2021.
Zheng, Q., Zhu, J., & Ma, S. (2020). Multi-view Hierarchical Clustering. Journal of Latex, 1–21.
96
Discussion and feedback