The Effect of Travel Vlogs as Electronic Word of Mouth and Destination Image on the Satisfaction and Loyalty of Millennial Tourists Visiting Nusa Penida Island
on
pISSN : 2301 – 8968
JEKT ♦ 16 [2] : 344-361
eISSN : 2303 – 0186
The Effect of Travel Vlogs as Electronic Word of Mouth and Destination Image on the Satisfaction and Loyalty of Millennial Tourists Visiting Nusa Penida Island
Clara Lintang Sistiyo Andari, Agung Suryawan Wiranatha, I Gusti Ayu Oka Suryawardani
ABSTRACT
Satisfaction and loyalty become a measure of the success of a tourist destination. Electronic word of mouth and destination image are two factors that can affect the satisfaction and loyalty of millennial tourists who visit a tourist destination. The purposes of this study were 1) To analyze the effect of travel vlogs as electronic word of mouth on satisfaction and loyalty of millennial tourists visiting Nusa Penida Island, 2) To analyze the effect of destination image on satisfaction and loyalty of millennial tourists visiting Nusa Penida Island, 3) to analyze the effect of satisfaction on the loyalty of millennial tourists who visit Nusa Penida Island. This research was used quantitative method involving 100 respondents who are millennial tourists visiting Nusa Penida Island. Sampling was done by purposive sampling method and analysis using Structural Equation Model (SEM) with SmartPLS 3.0 software. The results showed that 1) travel vlog as electronic word of mouth had significant effect on satisfaction and destination image had significant effect on satisfaction 2) travel vlog as an electronic word of mouth had significant effect on loyalty and destination image had not significant effect on loyalty, 3) Satisfaction had significant effect on loyalty. Other results showed that 81% of millennial tourists use social media as a source of information about Nusa Penida Island.
Keywords: Travel Vlog, Electronic word of mouth, Destination Image, Satisfaction, Millennial Tourist
JEL Classification: Z30, Z33, Z30, Z39, Z31
INTRODUCTION
The Nusa Penida Island area is known to have marine tourism potential with the uniqueness of white sand beaches, very blue and clear sea conditions, the beauty of coral reefs, and there are various types of colorful fish. Nusa Penida Island is one of the tourist destinations that millennial tourists are ogling through social media. Starting
with the attractiveness of beauty that is shared through social media in the form of visual photos and videos, Nusa Penida Island is starting to be known by millennial tourists. Ali and Purwandani (2017) mention that the millennial generation are those born between 1980 and 2000, the millennial generation is known as a generation that follows trends in social media, including tourism trends that are developing.
The millennial generation grew up in an environment that tends to travel as a social lifestyle trend, when compared to the previous generation, the millennial generation is known as a generation that is active in traveling and adventuring. In line with this rapid technological development, destinations cannot rely solely on traditional marketing approaches (Pitana and Pitanatri, 2016). The millennial generation, which is often referred to as the digital native generation, is closely related to the use of social media to share information by word of mouth or often known as electronic word of mouth. In contrast to Traditional Word of Mouth which is usually delivered directly or face-to-face, E-WOM uses internet media which is usually delivered through social media (Charo et al., 2015).
One of the most frequently accessed social media is Youtube, quoted from Katadata (2019), the "We Are Social" survey states that Youtube is the most accessed social media, namely 88% of the number of social media users
in Indonesia in 2019. Tourists Millennials access Youtube to watch video content uploaded by travel vloggers, the video content is commonly known as a travel vlog. Through travel vlogs, millennial tourists get information related to tourist destinations, from the information obtained it will form the expectations or expectations of millennial tourists which will affect the level of satisfaction with a tourist destination.
The image of a tourism destination is a combination of tourist perceptions and efforts to prepare destinations that have advantages compared to other destinations and meet tourist expectations (Sudiarta, 2012). Realizing a positive destination image is always associated with how to meet the needs and desires of tourists. The growth of a positive destination image certainly affects the satisfaction and loyalty of tourists to a tourist destination.
In this case, tourist satisfaction has a big role in building tourist loyalty, where tourists who feel satisfied after
coming to visit will tend to have the possibility to return to visit these destinations in the future and are willing to provide recommendations to others to visit. to Nusa Penida Island.
LITERATURE REVIEW
Previous Research
Previous research by Wiranatha, Suryawardani, and Bendesa (2016) entitled "Model of Foreign Tourist Loyalty on Marine Tourism to Vision Bali". The research sample amounted to 204 people and the sampling technique used accidental sampling. The results of the study were analyzed using Structural Equation Model analysis with the help of the Amos Version 21 software program. The results showed that there was a significant relationship between intrinsic motivational variables and tourist trust, there was a significant relationship between extrinsic motivational variables and tourist satisfaction, satisfaction variables had a significant effect on the loyalty variable, there is a significant relationship between the satisfaction and tourist loyalty variables, there is no significant
relationship between the trust and tourist loyalty variables, and there is a strong correlation between the intrinsic and extrinsic motivation of foreign tourists in diving tourism attractions in Bali.
Research by Rizal, Rachma and Priyono (2019) entitled "Analysis of the Effect of Electronic word of mouth on Destination Loyalty Mediated by Destination Image and Tourist Satisfaction (Case Study on Paragliding Tourism in Batu City)". Research respondents are tourists who visit Batu City para-gliding tour with a research sample of 100 people. The results of the study stated: 1) E-Wom has a direct effect on destination image, 2) E-Wom has a direct effect on satisfaction, 3) E-Wom, destination image, and tourist satisfaction have a direct effect on loyalty, 4) E-Wom influence on tourist loyalty by mediating destination image, 5) E-Wom affects tourist loyalty with mediation of satisfaction.
Research by Chi and Qu (2008) entitled "Examining the structural relationships of Destination Image,
tourist satisfaction and destination loyalty: An integrated approach". The research respondents were 345 people and the results of the research data were analyzed using Confirmatory factor analysis (CFA) and Structural Equation Model analysis. The results showed that the image of the destination influenced tourist attributes, the image of the destination and tourist attribute influenced satisfaction, tourist at-tribute and satisfaction influenced tourist loyalty.
Millennial Generation
According to Ali and Purwandani (2017), the millennial generation are those born between 1980 and 2000. This generation is a generation that involves technology in all aspects of life. The millennial generation is good friends with technology, where they tend to use social media to find information related to tourist destinations.
Electronic Word of Mouth
According to Charo et al. (2015), electronic word of mouth (e-WOM) is a
form of online exchange of information and knowledge on social media. The effectiveness of electronic word of mouth is more effective than word of mouth communication in the offline world, because it is easier to use and has a very wide range.
Destination Image
Pitana and Diarta (2009) define the image of a destination as an idea or belief that tourists have about a tourist destination. The image of a tourism destination is a combination of consumer perceptions and businesses from tourist destinations to prepare tourist products that have advantages compared to competitors and can meet the needs and expectations of tourists (Sudiarta, 2012).
Tourist Satisfaction
According to Day in Tjiptono (2004) consumer satisfaction is a response to the perceived evaluation of expectations and actual performance or perceived benefits after using a product or service. In this study, the value can be
in the form of feelings felt by tourists when visiting tourist destinations. If the value felt by tourists has reached or exceeded expectations, it can be said that the tourists are satisfied.
Loyalty
Loyalty is a consumer's commitment to a brand, store, or supplier based on a positive attitude and is reflected in consistent purchases (Tjiptono, 2004). Meanwhile, according to Kotler and Keller (2012) loyalty is a measure of consumer attachment to a product that is manifested in the desire to recommend it to others.
RESEARCH METHODS
This study applies a quantitative approach, the study was conducted to analyze and test the causal relationship between constructs. The cause of the causal relationship is called the exogenous latent variable which in this study is electronic word of mouth (X1) and destination image (X2). The constructs that are affected are called endogenous latent variables which in
this study are tourist satisfaction (Y1) and tourist loyalty (Y2).
The research was conducted in October-November 2020. The research was carried out by distributing questionnaires to respondents, with a research sample of 100 people. The sampling technique in this study was purposive sampling with the criteria of respondents being millennial tourists visiting Nusa Penida Island. To test the causal relationship between constructs using Structural Equation Modeling (SEM) analysis with SmartPLS software. In addition, this study also describes the characteristics of the respondents, and the assessment of each indicator of the research variables.
RESULT AND DISCUSSION
Respondent Characteristic
The results of the study showed that several characteristics of millennial tourists visiting Nusa Penida Island, millennial tourists are dominated by women with a percentage of 57%, domestic millennial tourists with the percentage of 21% are tourists from the
|
Province of Jakarta and foreign millennial tourists with the percentage of 22%, are tourists from Australia, millennial tourists with the percentage of, 33%, are tourists with type of work as private employees, millennial tourists with the percentage of 50%, are millennial tourists who come to visit with friends, millennial tourists with percentage of 46% are tourists who visit Nusa Penida Island for 2 days, millennial tourists with percentage of 81% are millennial tourists who get EWO1 |
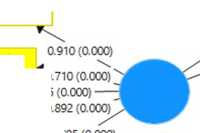
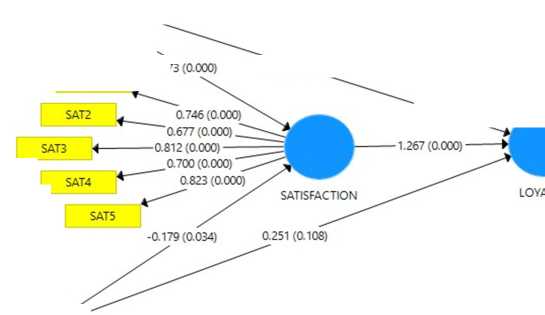
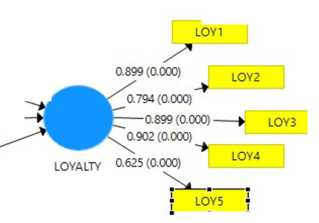
information related to Nusa Penida Island destinations from social media. Structural Equation Modelling (SEM) Analysis The influence of electronic word of mouth and destination image variables on tourist satisfaction which can affect tourist loyalty is modeled into a structural equation model which is analyzed using Structural Equation Modeling analysis. The structural model in this research is as shown in Figure 1 as follows. |
|
0.872 (O-(X)O) EWO2 I ∖ 0.792 (O.CCO) EWO3 4-0.773 (0.CCO)— 0.635 (0.00^^B EWO4 o.8O8 (0.0∞) EWOM EWO5 SA SAT3 SA IMA1 ima2 , α9ιo(αooo> 0.710 (C.CCC) IMA3 4—0.655 (O.CCC)--- 0.892 IMA4 _ J 0705 (O-(X)O) ∣mage IMA5 |
----------1 1.073 (O-(X)O) -0.746(0.008) LOY1 f∖ 0.899 (0.0∞) loy2 T2 . 0.746(0.000) ∕ -⅜ 0.677 (0.000) ∖≥^^ ^-^^^^0.794 (0.0∞) 4---------0.812 (0.000) ------1-267 (0.0∞)------—0.899 (0.0∞)----> LOY3 0.700 (0.000) ^^^^^^^^√O.9O2 (0.000) T4 * 0823(0 ∞0) √ L0Y4 ^^ SATISFACTION LOYALTY 0.625 (0.00Q) SAT5 ^^^ ι-"--" -0.179(0.034) 0.251(0.108) ZI Figure 1: Structural Equation Modeling |

Source: Primary
Validity and Reliability Testing Result
The Fornell-Larcker provision in Ghozali (2014) states that for research in the early stages of developing a measurement scale for the outer loading’s indicator value of 0.50 to 0.60 is considered valid. Based on these provisions, it can be said that all research indicators can be declared valid, this is evidenced by all the indicators listed in table 1 having a value of outer loadings > 0.50.
Meanwhile, to assess discriminant validity is to compare the value of the square root of average variance extracted (AVE) of each
Data, 2021.
construct with the correlations between other constructs in the model. If the AVE root value of each construct > the correlation value among constructs in AVE model it can be said that it has valid discriminant validity value. Fornell and Lacker in Ghozali (2014) state that AVE value should greater than 0,50. Based on these provisions, it can be said that all research variables can be declared valid. This is evidenced in table 1 which shows that the entire value of AVE > AVE and the value of AVE is greater than 0.50.
Table 1: Validity Testing Result
|
Variable |
Indicator |
Validity | ||
|
Convergent |
√AVE |
AVE | ||
|
EWO1 |
0.872 | |||
|
EWO2 |
0.792 | |||
|
Ewom |
EWO3 |
0.773 |
0.780 |
0.608 |
|
EWO4 |
0.635 | |||
|
EWO5 |
0.808 | |||
|
IMA1 |
0.910 | |||
|
Variable |
Indicator |
Validity | ||
|
Convergent |
√AVE |
AVE | ||
|
IMA2 |
0.710 | |||
|
Destination Image |
IMA3 |
0.655 |
0.781 |
0.611 |
|
IMA4 |
0.892 | |||
|
IMA5 |
0.705 | |||
|
SAT1 |
0.746 | |||
|
SAT2 |
0.677 | |||
|
Tourists’ Satisfaction |
SAT3 |
0.812 |
0.831 |
0.690 |
|
SAT4 |
0.700 | |||
|
SAT5 |
0.823 | |||
|
LOY1 |
0.899 | |||
|
Tourists ‘Loyalty |
LOY2 |
0.794 | ||
|
LOY3 |
0.899 |
0.754 |
0.568 | |
|
LOY4 |
0.902 | |||
|
LOY5 |
0.625 | |||
Source: Primary Data, 2021.
|
The reliability test was conducted to prove the accuracy, consistency, and accuracy of the instrument in measuring the construct. A variable is considered reliable if it has a composite reliability value above 0.6. The reliability test can also be seen from the cronbach alpha value, where the cronbach alpha value is > 0.70. However, according to Chin 1998 in Gozhali (2014) cronbach alpha |
values above 0.60 are still acceptable. Based on Table 2, all research variables have Cronbach's Alpha and Composite Reliability values above 0.60, it can be concluded that all research variables meet the reliable criteria. Table 2: Reliability Testing Result Reliability |
|
Variable |
Cronbach's Alpha |
Composite Reliability |
|
Electronic word of mouth |
0.835 |
0.885 |
|
Destination image |
0.834 |
0.885 |
|
Tourists’ Satisfaction |
0.882 |
0.916 |
|
Tourists’ Loyalty |
0.808 |
0.867 |
Source: Primary data, 2021.
Hypothesis Testing Result
The estimated value is to see the relationship between variables in the
structural model shown through direct effects, indirect effects, and total effects. The influence is seen through the positive path coefficient and a significant level of 5%. Hypothesis testing is done by statistical test t (t-test) with P Value < 0.05 or t statistic > t table then the hypothesis test result is declared significant, whereas if the P Value > 0.05 or t statistic < t table then the hypothesis test result is declared not significant. The results of direct effects, indirect effects, and totals are described as follows.
Table 3: Direct Effect
|
Exogen Variable -> Endogen |
Original Sample |
Standard Deviation |
P Values |
|
EWO -> SAT |
1.073 |
0.074 |
0.000 |
|
IMA -> SAT |
-0.179 |
0.084 |
0.034 |
|
SAT -> LOY |
1.267 |
0.245 |
0.000 |
|
EWO -> LOY |
-0.746 |
0.281 |
0.008 |
|
IMA -> LOY |
0.251 |
0.156 |
0.108 |
|
Source: Primary |
data |
(processed), |
2021. |
The following describes the direct effect of exogenous variables on endogenous variables based on Table 3 above: (1) Based on the results of data processing, the path coefficient value is
1.073 and the P Value is 0.000, then H0 is rejected and H1 is accepted. It can be concluded that electronic word of
mouth has a significant positive effect on tourist satisfaction; (2) Based on the
results of data processing, the path coefficient value is -0.179 and the P Value is 0.034, then H0 is rejected and H2 is accepted. It can be concluded that the image of the destination has a significant negative effect on tourist satisfaction; (3) Based on the results of data processing, the path coefficient value is 1.267 and the P Value is 0.000, then H0 is rejected and H3 is accepted. It can be concluded that tourist satisfaction has a significant positive effect on tourist loyalty; (4) Based on the
results of data processing, the path coefficient value is -0.746 and the P Value is 0.008, then H0 is rejected and H4 is accepted. It can be concluded that electronic word of mouth has a significant negative effect on tourist loyalty; and (5) Based on the results of data processing, the path coefficient value is 0.251 and the P Value is 0.108, then H0 is accepted and H5 is rejected. It can be concluded that the image of the destination has no effect on tourist loyalty.
Table 4: Indirect Effect
|
Exogen Variable -> Mediasi -> Endogen |
Original Sample |
Standard Deviation |
P Values |
|
EWO -> SAT -> LOY |
1.359 |
0.292 |
0.000 |
|
IMA -> SAT -> LOY |
-0,227 |
0.115 |
0.049 |
|
Source: Primary |
Data |
(processed), |
2021. |
The following describes the indirect effect of exogenous variables on endogenous variables related to mediating variables based on Table 4 above: (1) The electronic word of mouth variable has a significant positive effect on tourist loyalty by mediating the tourist satisfaction variable with an
original sample value of 1.359 and a P Value of 0.000; (2) The destination image variable has a significant negative effect on tourist loyalty by mediating the tourist satisfaction variable with an original sample value of -0.227 and a P Value of 0.049.
Table 5: Total Effect
|
Exogen -> Endogen Variable |
Original Sample |
Standard Deviation |
P Values |
|
EWO -> SAT |
1.073 |
0.074 |
0.000 |
|
IMA -> SAT |
-0.179 |
0.084 |
0.034 |
|
SAT -> LOY |
1.267 |
0.245 |
0.000 |
|
EWO -> LOY |
0.613 |
0.209 |
0.004 |
|
IMA -> LOY |
0.024 |
0.233 |
0.918 |
Source: Primary Data
(processed), 2021.
The following is direct impact of description of exogen variable toward endogen variable based on Table 5 above: (1) Electronic word of mouth variable gives positive impact and significant toward the tourist satisfaction with value of original sample 1.073 and P Value 0.000; (2) The destination image variable has negative influence and significant toward tourists’ satisfaction with the value of original sample -0.179 and P Value 0.034; (3) The variable of tourist satisfaction has a positive and significant effect on tourist loyalty with an original sample value of 1.267 and a P Value of 0.000; (4) The electronic word of mouth variable has a positive and significant effect on tourist loyalty with an original sample value of 0.613 and a P Value of 0.004;
and (5) The destination image variable has no significant effect on tourist loyalty with an original sample value of 0.24 and a P Value of 0.918.
The Effect of Travel Vlogs as Electronic Word of Mouth Media on Satisfaction
The results of testing the effect of travel vlogs as electronic word of mouth on tourist satisfaction with the original sample value of 1.073 and the P Value of 0.000 <0.05. Based on the test results, it can be stated that the first hypothesis is accepted, which means that travel vlogs as electronic word of mouth have a positive and significant effect on the satisfaction of millennial tourists visiting Nusa Penida Island. This is in line with research conducted by Kurniawan and Maftukhah (2020)
which states that electronic word of mouth has a positive and significant effect on tourist satisfaction, with experiences shared on Instagram affecting tourist satisfaction in Banjarrejo tourist villages.
In this research, the use of Youtube social media with travel vlog content helps millennial tourists in getting information and recommendations related to Nusa Penida destinations. In addition, social media also tells someone's experience during a visit to help millennial tourists to reduce their dissatisfaction
The Effect of Destination Image on Satisfaction
Based on the results of testing the influence of destination image on tourist satisfaction with the original sample value of -0.179 and the P Value of 0.034 <0.050. Based on the results of these tests, it can be stated that the second hypothesis is accepted, which means that the image of the destination has a significant negative effect on the satisfaction of millennial tourists
visiting Nusa Penida Island (opposite direction).
The results of the study are not relevant to the results of previous research conducted by Chiu, Zeng and Cheng (2016) which states that the image of the destination has a positive influence on tourist satisfaction. But unfortunately, this is not in line with the results of this study where the image of the destination has a significant negative effect on the satisfaction of millennial tourists visiting Nusa Penida Island, this shows that the better the image of the destination, the satisfaction of tourists will decrease.
The Effect of Satisfaction on Loyalty
Based on the results of testing the influence of tourist satisfaction on tourist loyalty with the original sample value of 1,267 and the P Value of 0.000 < 0.050. Based on the results of these tests, it can be stated that the third hypothesis is accepted, which means that satisfaction has a positive and significant effect on the loyalty of millennial tourists visiting Nusa Penida Island. The results of the study are in
line with research conducted by Wiranatha, Suryawardani and Bendesa (2016) which shows that tourist satisfaction has a significant and positive influence on marine tourism loyalty. Satisfaction is the key to tourist loyalty, where satisfied tourists will come to visit again and recommend the tourist destination to others.
The Effect of Travel Vlog as Electronic Word of Mouth on the Loyalty
Based on the testing of influence of travel vlog as electronic word of mouth on tourists’ loyalty with original sample value of -0.746 and P Value for 0.008 < 0,050.
Based on the testing it can be declared that the fourth hypothesis can be accepted which mean that travel vlog as electronic mouth has negative impact on millennial tourist loyalty who make visit to Nusa Penida island; it means that the increase of the usage of electronic word of mouth does not give influence on millennial tourist loyalty
Video as a visual communication medium is important in the reality of
tourism, where detailed video capabilities can present the real reality and description of tourist destinations. Problems will arise when the video does not present information accurately, so that the video as a visual communication medium for tourism becomes a mis-representation (Machin, 2014). But unfortunately, there are still many travel vlogs that have not shown the facts of the overall condition of the destination, such as damaged roads and damaged access to tourist destinations on Nusa Penida Island. Where in this case the travel vloggers should be able to explain the reality of tourist destinations not only regarding the attractiveness of the destination but also must tell the reality of the shortcomings that are still related to the tourist destination.
The Effect of Destination Image on Tourist Loyalty
Based on the results of testing the influence of destination image on tourist loyalty, the original sample value is 0.251 and the P Value is 0.108 > 0.050. Based on the test results, it can be stated
that the fifth hypothesis is rejected, which means that the image of the destination has no significant effect on the loyalty of millennial tourists visiting Nusa Penida Island.
The results of the study are not in line with previous research conducted by Zhang et al. (2014) showing that affective image has a significant effect on tourist loyalty. The results showed that the mean value of the IMA3 indicator of 4.30 was the lowest value, which means that tourists have not fully felt comfortable while on the island of Nusa Penida (affective image). Sudiarta (2012) also explained that the image of a destination is always associated with how to understand tourists, how to meet the needs and desires of tourists. Therefore, in realizing a positive destination image, it is necessary to make efforts to build infrastructure that will support tourist comfort.
The results of testing the effect of travel vlogs as electronic word of mouth on loyalty through mediation of satisfaction with the original sample value of 1.359 and the P Value of 0.000 <0.05. Based on the results of these tests, it can be stated that travel vlogs as electronic word of mouth have a positive and significant effect on the loyalty of millennial tourists visiting Nusa Penida Island through mediation of satisfaction. The results of this research are in line with research conducted by Putra (2017) which shows the results of electronic word of mouth have a significant positive effect on tourist loyalty through mediation of satisfaction. Travel vlogs as electronic word of mouth can play a role in stimulating millennial tourists to come back to visit Nusa Penida Island if the tourists feel satisfied on their previous visits (loyal).
The Influence of Travel Vlog as Electronic Word of mouth on the Loyalty with Satisfactory Mediation
The Effect of Destination Image on Loyalty with Satisfaction Mediation
The results of testing the effect of destination image on loyalty through mediation of satisfaction with the original sample value of -0.227 and the P Value of 0.049 <0.05. Based on the results of these tests, it can be stated that the image of the destination has a negative and significant effect on the loyalty of millennial tourists visiting Nusa Penida Island through mediation of satisfaction. Sudiarta (2012) explained that the image of a destination is always associated with how to understand, fulfill the needs and desires of tourists. In essence, in building a positive image is to build a strategy to achieve tourist satisfaction and have an impact on tourist loyalty. But unfortunately, the theory is not in line with the results of the study, where the results of the study show a significant negative effect, which means that a good image will decrease tourist loyalty (opposite direction).
The image of the Nusa Penida Island destination has a very good average score of 4.52, but considering the lifestyle of the millennial generation is a generation of productive age who
likes adventure exploring new destinations. Therefore, after the bucket list to visit Nusa Penida Island has been realized, millennial tourists tend to want to visit other tourist destinations that have never been visited.
CONCLUSION
Based on the results of research and discussion on the Effect of Travel Vlogs as Electronic Word of Mouth and Destination Image on the Satisfaction and Loyalty of Millennial Tourists Who Visit Nusa Penida Island, it can be concluded as follows: (1) The results show that travel vlogs as electronic word of mouth has a significant effect on the satisfaction of millennial tourists visiting Nusa Penida Island and the image of the destination also has a significant effect on the satisfaction of millennial tourists visiting Nusa Penida Island; (2) The results show that travel vlogs as electronic word of mouth has a significant effect on the loyalty of millennial tourists who visit Nusa Penida Island and the image of the destination does not significantly affect the loyalty of millennial tourists who
visit Nusa Penida Island; and (3) The results show that millennial tourist satisfaction has a significant effect on the loyalty of millennial tourists visiting Nusa Penida Island.
Seeing the importance of the role of social media in the tourism industry, it is recommended to the Klungkung Tourism Office to develop the social media Youtube as a digital marketing media in introducing the tourist attraction of Nusa Penida Island. In addition, the Klungkung Tourism Office can also collaborate with Travel Vloggers to create travel vlog video content related to introducing the attractiveness of Nusa Penida Island to attract more attention from tourists to visit.
Based on the results of the study, it shows that the image of the destination has a significant negative effect on millennial tourist satisfaction and the image of the destination has no significant effect on the loyalty of millennial tourists. When viewed from the lowest mean value on the destination image variables, namely the
IMA3 indicator (I feel comfortable while in Nusa Penida) with a value of 4.30, the comfort of millennial tourists has not been met. As well as the lowest mean value on the tourist satisfaction variable, namely the SAT4 indicator (I am satisfied with the tourist facilities offered) with a value of 3.85, it appears that millennial tourist satisfaction related to facilities or infrastructure has not been achieved.
Further research needs to look at other aspects that can affect the satisfaction and loyalty of millennial tourists visiting Nusa Penida Island, such aspects as the attractiveness of tourist attractions, facilities, services, and tourist trust. In addition, considering that millennial tourists are always synonymous with the use of social media, further research can also expand the role of electronic word of mouth on the satisfaction and loyalty of millennial tourists visiting Nusa Penida Island as seen from the role of using other social media such as Instagram. and Tiktok.
REFERENCES
Ali, H. and Purwandani, L. (2017) The Urban Middle-Class Millenials Indonesia: Financial and Online Behavior. Jakarta: PT. Alvara
Strategi Indonesia.
Charo, N. et al. (2015) ‘Determining the Impact of Ewom on Brand Image and Purchase Intention through Adoption of Online Opinions’, International Journal of Humanities and Management Sciences, 3(1), pp. 41–46.
Chi, C.G.-Q. and Qu, H. (2008) ‘Examining the structural relationships of destination image, tourist satisfaction and destination loyalty: An integrated approach’, Tourism management, 29(4), pp. 624–636.
Chiu, W., Zeng, S. and Cheng, P.S.-T. (2016) ‘The influence of destination image and tourist satisfaction on tourist loyalty: a case study of Chinese tourists in Korea’, International Journal of Culture, Tourism and Hospitality Research [Preprint].
Ghozali, I. (2014) Structural Eeuation Model Metode Alternatif dengan Patrial Least Square Aplikasi. Cetakan ke empat. Semarang: Universitas Diponegoro.
Katadata (2019) Youtube Medsos No 1 di Indonesia, https://katadata.co.id/infografik/2019/
03/06/Youtube-medsos-no-1-di-indonesia.
Kotler, P. and Keller, K.L. (2012) Marketing Management. Amerika Serikat: Prentice Hall.
Kurniawan, M.A. and Maftukhah, I. (2020) ‘The Analysis of Electronic Word of Mouth, Destination Image, and Visiting Decision on Satisfaction’, Management Analysis Journal, 9(1), pp. 72–80.
Machin, D. (2014) Visual Communication. De Gruyter Mouton Handbook of Communication Science Volume 4.
Pitana, I.G. and Diarta, I.K.S. (2009) Pengantar Ilmu Pariwisata. Yogyakarta: Penerbit Andi.
Pitana, I.G. and Pitanatri, P.D.S. (2016) ‘Digital marketing in tourism: the more global, the more personal’, in International Tourism Conference: Promoting Cultural and Heritage Tourism. Bali: Udayana University, pp. 1–3.
Putra, S.P.A.M. (2017) ‘Pengaruh Electronic Word of Mouth Terhadap Citra Destinasi, Kepuasan, dan Loyalitas’, Modus, 29(2), pp. 210–218.
Rizal, M., Rachma, N. and Priyono, A.A. (2019) ‘Analisis Pengaruh Electronic Word of Mouth
Terhadap Loyalitas Destinasi
Dimediasi Citra Destinasi Dan Kepuasan Wisatawan (Studi Kasus Pada Wisata Paralayang Kota
Batu)’, Jurnal Ilmiah Riset Manajemen, 8(16).
Sudiarta, I.N. (2012) ‘Membangun Citra Destinasi Pariwisata Seberapa Pentingkah’, Jurnal Ekonomi dan Pariwisata, 7(31), pp. 1–13.
Tjiptono, F. (2004) Strategi Pemasaran. Edisi Kedua. Yogyakarta: Penerbit ANDI Yogyakarta.
Wiranatha, A.S., Suryawardani, I.G.A.O. and Bendesa, I.K.G. (2016) ‘Model of Foreign Tourist Loyalty on Marine Tourism to Visit Bali’, Journal of Global Stochastics Analysis, 5(8).
Zhang, H. et al. (2014) ‘Destination image and tourist loyalty: A metaanalysis’, Tourism management, 40, pp. 213–223.
361
Discussion and feedback