Food or Non-Food? Family Hope Program (PKH) Impact Evaluation during Covid-19 Outbreak: Evidence from Bali
on
ISSN : 2301-8968
Vol. 14 No.2, Agustus 2021
EKONOMI
KUANTITATIF
TERAPAN
Volume 14
Nomor 2
JEKT
ISSN 2301-8968
Halaman
243-405
Denpasar Agustus 2021
PROVINCE Analysis of Financial Institutions Credit Impact on MSE Income in Bali Province Ksama Putra, Ni Putu Wiwin Setyari
The Dynamics of Credit Procyclicality and Stability of Macroeconomics in Indonesia Ni Putu Nina Eka Lestari, Made Kembar Sri Budhi, I Ketut Sudama, Ni Nyoman Reni Suasih, I Nyoman taun
The Dynamics of Exchange Rate, Inflation, and Trade Balance in Indonesia Nayaka Artha Wicesa
Planning Consistency and the Political Budget Cycle in Indonesia Khoirunurrofik
Food or Non-Food? Family Hope Program (PKH) Impact Evaluation during Covid-19 Outbreak: Evidence from Bali
I Gede Heprin Prayasta, Made Kembar Sri Budhi, I Ketut Sudibia, Ni Nyoman Yuliarmi
Volatilitas inflasi sebagai fenomena kombinasi moneter-fiskal di Indonesia Eli Marnia Henira, Raja Masbar, Chenny Seftarita
The The Impact of COVID-19 on FinTech Lending in Indonesia: Evidence From Interrupted Time Series Analysis
Abdul Khaliq
The Analysis of Willingness to Pay (WTP) Visitors to The Development of Rafting Toutism in Serayu Watershed
Nobel Sudrajad
Relatiomships Between Characteristic of Local Government and Website Based Financial
Gabriela Amanda Widyastuti, Dena Natalia Damayanti, Marwata
The Relationship Among Economic Structure, Sectoral Workforce, and Community Welfare in Bali Province I Nyoman Mahendrayasa

pISSN : 2301 - 8968
JEKT ♦ 14 [2] : 381-405
eISSN : 2303 - 0186
Food or Non-Food?
Family Hope Program (PKH) Impact Evaluation during Covid-19 Outbreak: Evidence from Bali
I Gede Heprin Prayasta Made Kembar Sri Budhi
I Ketut Sudibia
Ni Nyoman Yuliarmi
Universitas Udayana
ABSTRAK
Program Keluarga Harapan (PKH) adalah salah satu program bantuan sosial bersyarat untuk mengentaskan kemiskinan di Indonesia. Kemiskinan makro di Indonesia diestimasi dengan pendekatan basic needs approach melalui konsumsi rumah tangga untuk bahan makanan dan bahan bukan makanan. Penyebaran pandemi Covid-19 mengakibatkan kontraksi yang sangat dalam pada perekonomian Bali yang pada akhirnya berdampak pada tingkat kesejahteraan rumah tangga. Penelitian ini bertujuan untuk menganalisis karakteristik penerima PKH, mengevaluasi ketepatan sasaran serta dampak PKH terhadap konsumsi bahan makanan dan bukan makanan rumah tangga. Data yang dianalisis adalah data sekunder hasil SUSENAS Maret 2020 dan data primer hasil wawancara mendalam serta Focus Group Discussion (FGD). Metode analisis dalam penelitian ini adalah Benefit and Incidence Analysis (BIA) dan Propensity Score Matching (PSM). Hasil penelitian menunjukkan PKH diterima paling banyak oleh kelompok pengeluaran terendah. PKH signifikan berdampak pada konsumsi bahan makanan namun belum cukup kuat menyatakan pengaruh terhadap bahan bukan makanan pada masa pandemi.
Kata kunci: bantuan sosial, Covid-19, rumah tangga, makanan, bukan makanan Klasifikasi JEL: H55, I19, I30, L66, L67
Food or Non-Food?
Family Hope Program (PKH) Impact Evaluation during Covid-19 Outbreak: Evidence from Bali
ABSTRACT
The Family Hope Program (PKH) is a conditional cash transfer for alleviating poverty in Indonesia. The macro poverty is measured with basic needs approach through household consumption for food and non-food. The outbreak of the Covid-19 leads a deep contraction on the
Bali’s economy which affect the level of household welfare. This study aimed to analyze the characteristics of PKH recipients, evaluate targeting accuracy and the impact of PKH on household consumption. The data analyzed were secondary data from SUSENAS March 2020 and primary data from in-depth interviews and FGD. The analytical methods in this study were Benefit and Incidence Analysis (BIA) and Propensity Score Matching (PSM). The results of the study found PKH mostly benefited by those among the lowest income group. PKH has a significant impact on the consumption of foodstuffs, but there is not strong enough to indicate an effect on non-food consumption during the pandemic outbreak.
Kata kunci: social-assistance, Covid-19, household, food, non-food
Klasifikasi JEL: H55, I19, I30, L66, L67
INTRODUCTION
Indonesia’s government always strives to provide social protection in order to prevent the risks experienced by the poor and or vulnerable groups. It is expected to address the burden and avoid to pass the condition to the next generation (Bappenas,2014). The International Labor Organization (ILO) (1984) in the Social Extension Center of the Ministry of Social Affairs of the Republic of Indonesia defines social protection as a policy design to minimize the impact of economic and social shocks resulting in reduced or even loss of income. The foundation of a country's social protection includes at least four important points called the Social Floor Initiative (SPF-I): health care insurance, education, and other social services, such as basic income
security guarantees for children, the population of productive age and the elderly (United Nations (2009) in Bappenas (2014)).
Social protection in Indonesia is carried out in accordance with the mandate of the 1945 Constitution as the goal of the state to achieve social welfare for all Indonesian. It is divided into two schemes: social assistance (noncontribution) and social security (with contribution). Social assistance is an assistance which financed by the state through certain procedures with funding sources fully from the state budget. Meanwhile, social security is regulated in Law Number 24 of 2011 which includes health insurance programs, work accident insurance, old-age insurance, pension benefits, and death benefits which are implemented
through the Social Security Administering Body (BPJS) for Health and Employment.
Program Keluarga Harapan (PKH) is one of the social assistances directed to be the epicenter and center of excellence for poverty reduction that synergizes various national social protection and empowerment programs (Kemensos RI). It has the most accurate data and sustainable assistance which is a pioneer in synergizing social protection and empowerment programs compared to various other social protection programs. A similar program to PKH or Conditional Cash Transfer (CCT) in Brazil is known as Bolza Familia succeeded in increasing the beneficiary income up to 47 percent for food and groceries (Kamakura and Mazzon,2015). Initial evaluations of Mas Familiasen Accion in Colombia showed positive effects on household consumption. During the first two years of program implementation, the household consumption increased by 13-15 percent (Attanasio et al., 2005, 2006 and 2009; Attanasio and Mesnard, 2005 in Javier
and Adriana, 2011). Cruces et.al, (2011) evaluated the significant impact of Juntos CCT in Peru on household consumption though in a short-term period. Juntos recipient households got the opportunity to enjoy a better life due to additional income that can be used to meet basic needs (Secanella, 2017).
The outbreak of Covid-19 leads to the global economic downturn. Bali’s economy was reported contracted to -9,31 percent in 2020 and one the largest among other provinces in Indonesia. This unprecedented pandemic has led to 98,18 million people losing their jobs due to the huge shock both in demandsupply side. Thereby, household income is predicted to be declined as the impact of this unpredictable shock.
The integration of PKH is organized as one of the social protections with the largest coverage at the national level at 36,81 percent (TNP2K,2017) but until March 2020 the coverage of households receiving PKH in Bali Province was estimated to reach 5,49 percent (BPS Province of Bali, 2019). The highest coverage is shown in the complement of
PKH, the BPNT program that reached 8,19 percent. The contradiction between the national projection and the estimated number of PKH beneficiary households in Bali Province is one of the underlying reasons why evaluating the impact of PKH during the Covid-19 pandemic is urgently needed. The complementarity among social assistance programs in targeting eligible groups is still low although at the design level all PKH beneficiaries receive poverty reduction and social protection programs was integrated (Habibulah, 2017).
Todaro (2006) defined that welfare of the lower middle class can be represented by the level of people's lives. The standard of living of a prosperous society is characterized by lower poverty, better health, higher education, and increased community productivity. In order to address the poverty through basic needs fulfillment, this research underlying to two popular theories by Ragnar Nurkse and Ernest Engle. The theory of the Vicious Cycle of Poverty (VCP) or the Poverty Circle
was formulated by Nurkse in 1953 was referred to describe the situation of poor households where the head of the household is unable to provide basic household needs such as food, clothing, shelter, education, health, and other necessities (Bass, 2009 in Hashim et al., 2016). This theory is explained by underlining that in developing countries most of the population will experience the same poverty problems. Low income will lead to low purchasing power of the poor. In the end, their income will be low and their ability to save and invest will be low because they are trapped to only be able to meet their basic daily needs both food and nonfood. This situation will repeat itself as a cycle in the economic capacity of the poor (Bass, 2009a in Hashim et al., 2016a). As the income rise the portion of non-food consumption will be increased (Engle’s Law) where implicitly noted that the poor burdened by the food consumption as priority. Thereby the cycle will viciously repeat and pass the poor to their next
generation as they struggle to meet minimum daily basic needs.
The problem of poverty alleviation does not only depend on the effectiveness of the impact created. PKH has to be channeled on target to the groups that needed the most or the lowest income group. The Smeru Research Institute by Hastuti et.al.,(2020) reported that there were indications of invalid DTKS due to poor or vulnerable families not being covered by the program during the pandemic due to varying updating and updating results were not always accommodated whilst PKH are expected to become KPM's safety net during the pandemic. There were also found those who passed away and address changed were remain listed.
Thus, this study began by examining the characteristics of PKH recipients, evaluating targeting accuracy, then evaluating the impact of PKH on food and non-food consumption during the outbreak of Covid-19 pandemic in Bali Province. PKH is expected to be able to become a buffer for the poor at least to survive on funding their basic needs.
The evaluation of the Family Hope Program (PKH) policy is carried out by analyzing the impact of program on household consumption of food and non-food. This study was conducted during the Covid-19 pandemic, March 2020 to March 2021. The outcome studied was the household consumption for food and or non-food so this study did not identify the cumulative impact created by PKH since 2007 where the program first launched. The impact evaluation analysis is also equipped with an analysis of the results of indepth interviews and Focus Group Discussions (FGD) with relevant stakeholders and beneficiaries in order to minimize the source of bias with consideration on the unobservable variables.
RESEARCH METHODS
This research conducted with both quantitative and qualitative approaches. The quantitative analysis began with descriptive analysis utilizing CrossTabulation and Benefit Incidence
Analysis (BIA). Cross-Tabulation and used to describe the KPM characteristics. KPM or Keluarga Penerima Manfaat refers to the family who received the PKH and listed in Data Terpadu Kesejahteraan Social (DTKS) managed by Ministry of Social Affairs Republic of Indonesia. Cross -Tabulation is a statistical method that describes two or more variables simultaneously and the results are displayed in a table that reflects the joint distribution of two or more variables with a limited number of categories (Agresti, 2002).
In order to evaluate the accuracy of program delivery, this research applied BIA. This technique is traditionally used to assess the impact of the distribution of government spending to assess the extent to which different socio-economic groups benefit from government subsidies or assistance. The World Bank has conducted most BIA studies in low to middle-income countries and has focused primarily on the distribution of benefits (or subsidies) from funding for education and public health services
(Demery et al. 1995; Castro-Leal 1996; Castro-Leal et al. 1999; Castro-Leal et al. 2000; Sahn and Younger 2000; van de Walle 2003 in McIntyre and Ataguba 2010).
The estimation of PKH impact on food and nonfood consumption was identified through Propensity Score Matching (PSM) method. It is an alternative method to estimate the impact of a treatment on a particular subject. The observation was divided into two groups, namely treatment and control group. The PSM estimate is formulated as follows (Rosenbaum and Rubin, 1983).
ATT = E (∆∣P(X)),D = 1)
ATT = E(T1∣ P(X)),D = 1) - E(⅛∣ P(X)),D = 0)
in which ATT is the average treatment on treated (the impact of PKH), D = 1 for the treatment group, D = 0 for the control group. There are some steps to estimate the PSM Model as follows:
-
1. T-test for examining equal mean
The test was used to conduct a simple comparison study whether the mean
value of both group control and treatment are equal by applying a t-test on the outcome interest. Once the assumption on equal average rejected then it can proceed to estimate the Propensity Score in order to identify the cause of the difference.
-
2. Estimate Propensity Score
According to Caliendo and Kopeinig (2008), there are two steps that have to be taken when estimating the Propensity Score, such as selecting the model and the variables to be included in the model. This study utilized a logit model and identified the balancing process until satisfying the minimum requirement for matching. The variables that led to unbalance were dropped from the logit model.
-
3. Select Matching Algorithm
There are 5 popular matching techniques: Nearest Neighbour (NN); Caliper and Radius; Stratification and Intervals; Kernel and Local Linear; and Weighting. No method is superior to all matching methods. This is due to a trade-off between bias
and variance that will affect the estimated value of ATT (Caliendo and Kopeinig, 2008). This research used the NN, NN(m=1), Kernel, and Stratification matching.
-
4. Evaluate Common Support
Common Support is one of the important assumptions when applying PSM. This step is very important in matching estimates to ensure there is an overlap between the treatment and control groups. As a result, it can be ensured that the match for the group that was intervened and the group that was not intervened could be found (Khanker, 2010). The common support area is analyzed by visual analysis using the propensity of kdensity score chart analysis.
-
5. Asses the Matching Quality
This step should be taken to assess the quality of the matches. The test carried out with different test before and after matching (t-test). If there is no difference (receiving H0), it means that the sample used has good quality
matching. Hereby we expect to result not to reject H0.
-
6. Sensitivity Analysis
According to Rosenbaum (2005), a sensitivity analysis should be carried out to see the sensitivity of the findings to hidden bias due to unobservable characteristics. The sensitivity test was performed using rbounds within Stata. This study used Hodges-Lehmann point
estimation performed by analyzing the rbounds output.
This study considered three variables to analyze, such as treatment, outcome, and control variables or covariates. The treatment variables included was 0: not received PKH and 1: received PKH. The outcome variables considered were household consumption particularly on food or non-food. Meanwhile, the covariates variables considered were socio-economics household characteristics including the prerequisites for PKH’s program eligibility (see Table 1 and Table 2).
Table 1: Outcome Variables
|
Variable |
Scale |
Details |
|
Food |
Ratio |
Monthly average (Rp) |
|
Non-food |
Ratio |
Monthly average (Rp) |
|
Source: BPS, 2020 (processed) | ||
Table 2: Covariates or Control Variables
|
Covariates |
Scale |
Details |
|
Head of household marital status |
Nominal |
0: Unmarried1: Married |
|
Head of householdon productive age |
Nominal |
0: No & 1: Yes |
|
Head of household education attainment |
Ordinal |
0: No school1: Primary2: Junior 3: Senior |
|
Head of household industry category |
Ordinal |
0: Unemployed1: Primary 2: Secondary3: Tertiary |
|
Head of household occupation |
Ordinal |
0: Unemployed1: Employment 2: Entrepreneur |
|
Pregnant motherhousehold member |
Nominal |
0: No & 1: Yes |
|
Toddler household member |
Ratio |
Toddler in household |
|
Elderly household member |
Ratio |
Household member 60 years old and older |
|
Category of fuel |
Nominal |
0: Traditional & 1: Modern |
|
Categoryof wall |
Nominal |
0: Others & 1: Concrete/plastering |
|
Categoryof roof |
Nominal |
0: Others & 1: Concrete |
|
Clean water availability |
Nominal |
0: No & 1: Yes |
|
Source of household lighting |
Nominal |
0: Not Electricity & 1: Electricity |
|
Toilet facilities |
Nominal |
0: No facility1: Shared 2: Private |
|
House ownership |
Nominal |
0: No & 1: Yes |
|
Category of floor |
Nominal |
0: No & 1: Yes |
|
Micro-preneurship credit status |
Nominal |
0: No & 1: Yes |
|
Land ownership |
Nominal |
0: No & 1: Yes |
|
Refrigeratorownership |
Nominal |
0: No & 1: Yes |
|
Jewellery > 10 gr ownership |
Nominal |
0: No & 1: Yes |
|
Car ownership |
Nominal |
0: No & 1: Yes |
|
BPNTbeneficiary status |
Nominal |
0: No & 1: Yes |
|
Regional Gov. assistancebeneficiary status |
Nominal |
0: No & 1: Yes |
|
JKN/Jamkesda beneficiary status |
Nominal |
0: No & 1: Yes |
|
Member of household with visual disability |
Nominal |
0: No & 1: Yes |
|
Member of household with walks disability |
Nominal |
0: No & 1: Yes |
|
Member of household with disability on hand |
Nominal |
0: No & 1: Yes |
|
Member of household with concentrationdis. |
Nominal |
0: No & 1: Yes |
|
Member of household with emotionaldis. |
Nominal |
0: No & 1: Yes |
|
Member of household with communicationdis. |
Nominal |
0: No & 1: Yes |
|
Member of household with self-care dissability |
Nominal |
0: No & 1: Yes |
|
Source: BPS, 2020 (processed) |
RESULT AND DISCUSSION
The different characteristics were revealed between a household that received PKH (KPM) and the other that did not receive the program (Non-KPM). On average, Non-KPM spent higher to consume food and, or nonfood in both urban and rural area. The wider gap to those living in an urban was predicted due to the higher inequality that existed. The diverse source of income and job availability in most of the city resulted in a higher
difference between KPM and Non-KPM household income in the urban regions. Further, the pattern can be concluded that the Non-KPM have more higher welfare level as compared to the KPM because they can afford higher basket commodities monthly. It is also noticed that PKH already managed to benefited the most for those classified in the lower income group.
Consumption patterns of PKH recipient tent to be greater for food consumption than non-food consumption. The same
structure was obtained for both recipient and non-PKH recipient groups in rural and urban areas. In contrast to the consumption of non-PKH recipient households in urban area mostly used for food consumption. This pattern is in accordance with Engel's theory which defined that the higher the income, the portion of expenditure on foodstuffs tends to decrease or be less than nonfood (see Table 3).
According to the nutrition consumed, KPM living the rural on average eat lower protein, fat, and carbohydrate as compared to the Non-KPM (see Table 4). In other words, they also consumed
lower calories in total. Protein consumed by KPM in rural area were lower than the minimum standard noted this opportunity to wider the assistance provides through fulfillment on the source of protein such as eggs, fish, dairy products and etc.
Meanwhile, an interesting finding revealed in the urban area. The Non-KPM consumed lower carbohydrates than KPM. Food prevalence might lead this behavior such as a carbo diet. The people working as remote labor in the city probably took more carbohydrate than others who work in office-based.
Table 3: The Household’s Monthly Average Expenditure in Bali, 2020
|
Type of Expenditure |
Category |
|
(Indonesia’s Rupiah (IDR)) |
KPM Non-KPM |
Rural
|
Food |
2.092.277,49 2.146.321,37 |
|
Non-food |
1.597.288,64 2.043.922,09 |
|
Total |
3.689.566,13 4.190.243,46 |
Urban
|
Food |
2.176.304,05 2.671.455,88 |
|
Non-food |
1.698.137,99 3.623.968,34 |
|
Total |
3.874.442,04 6.295.424,22 |
Source: BPS, 2020 (processed)
Table 4: Household Nutrition per Capita Consumption in Bali, 2020
|
Type of Nutrition |
Minimum Standard |
Category | |
|
KPM |
Non-KPM | ||
|
Rural | |||
|
Calori (kkal) |
2.101,5 |
2.235 |
2.449 |
|
Protein (gr) |
61,23 |
60 |
68 |
|
Fat(gr) |
67 |
51 |
60 |
|
Carbohydrate(gr) |
300-400 |
352 |
373 |
|
Urban | |||
|
Calori (kkal) |
2.101,5 |
2.335 |
2.347 |
|
Protein (gr) |
61,23 |
64 |
71 |
|
Fat (gr) |
67 |
54 |
62 |
|
Carbohydrate(gr) |
300-400 |
362 |
340 |
|
Source: BPS, 2020 (processed) | |||
|
Overall, the household nutrition Moving on |
the comparison of the KPM | ||
|
consumption during |
the Covid-19 characteristics, most |
of the household | |
|
pandemic in Bali met |
the minimum was headed by a man for both KPM and | ||
|
healthy standard except the protein for Non-KPM. |
It was |
influenced by a | |
|
KPM in rural and |
fat among all patrilineal system believed by most of | ||
categories. This positive finding showed a shred of evidence that pandemic was arguably impacted to the household minimum diet nutrition. On the other hand, this finding answered the doubt on how the fulfillment of minimum
calories within the difficult times. The result of in-depth interview supported that most of the KPM put a priority on food instead of non-food consumption so that they were able to work and make money to fund their needs.
the region in Indonesia, including Bali. A head of household was the one that most responsible for the household expenses always put on a man instead of a woman. The characteristics of KPM revealed on the head of household
education attainment. Mostly KPM head of household only graduated from junior high school whereas the Non-KPM completed higher level with senior high school graduated. The gap continues to the household occupation
|
where KPM head of household |
m2) and it was suggested to minimum |
|
dominantly worked as employee or |
10 m2 per capita, also most of them still |
|
labour with lower income. Other |
had no proper access to clean water and |
|
characteristics described that the KPM |
not owned asset, such as refrigerator but |
|
housing amenities revealed lower |
most of them were identified received |
|
quality in which the place to live found |
other social assistance like BPNT, JKN, |
|
with lower floor percapita (8 until 15 |
and KKS. |
|
Table 5: Mode Analysis of the Household Characteristics in Bali 2020 | |
|
Variables |
KPM |
Non-KPM |
|
HH Sex |
Man |
Man |
|
HH education |
Junior High School |
Senior High School |
|
HH occupation |
Employee or labour |
Entrepreneur |
|
Floor per capita (m2) |
8 < floor ≤ 15 |
>15 |
|
Clean water |
No |
Yes |
|
Refrigerator |
No |
Yes |
|
Health insurance |
Yes |
Yes |
|
BPNT |
Yes |
No |
|
KKS |
Yes |
No |
|
Source: BPS, 2020 (processed) |
Figure 1: Household Spending Prevalence on PKH Benefit
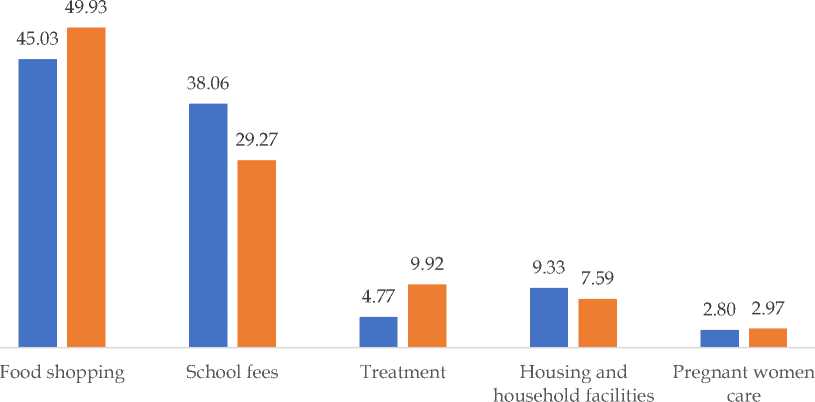
■ Urban ■ Rural
Source: BPS, 2020 (processed)
The utilization of PKH benefit mostly for food spending in both urban and rural areas. It is nearly 45,03 percent of the total KPM who live in urban areas and 49,93 percent of the total KPM in rural areas use PKH to buy food. The following household needed that became the second priority after food were school fee, health treatment, then housing and facilities, and financing for pregnant women.
The majority of PKH recipients were the lowest-income household group. The benefits provided by PKH were optimized for meeting basic needs,
especially food. KPM in Bangli Regency said that their lives got harder during the Covid-19 pandemic. Since they lost their job,they had no source of income. PKH social assistance was used for funding their daily basic needs.
“PKH helps me a lot because I haven't worked for a long time because the airport is quiet and I don't have a job. I can use PKH benefits to buy rice”, (KPM).
The findings clearly highlighted the most priority spending during pandemic was put on food consumption. Food, health treatment, and pregnant women care were burdened for PKH living in the rural
area. It was predicted due to the availability and affordability of health amenities was lower compared to those in urban region. On the other hand, school fee and housing were considered most for those living in urban in which most of them probably paid higher for both of the commodities.
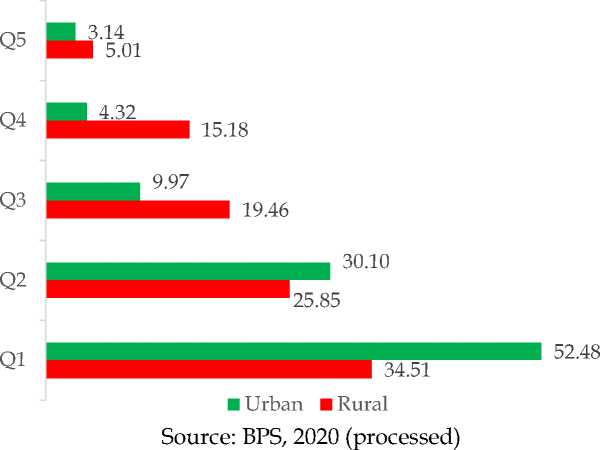
PKH was designed to reduce the burden of households that were grouped as the lowest income group or the poorest in a short term. According to the BIA (see Figure 2), it is described that most of the program recipients come from the Q1 (the poorest group). By contrast, there are some of the higher groups of income found received the programs whilst not all the poor do.
There are some underlying arguments to explain the phenomena. First, there is some of the lowest were excluded from PKH because they already graduated from the program due to no longer having the program prerequisites (maternal household members, toddler, primary until the senior high student, people with diffability, and elderly). PKH is conditional cash transfer
assistance that requires their beneficiaries to meet the condition to be eligible for the program. The household who are no longer listed as PKH beneficiaries is eligible to other
complementary programs such as
BPNT, PIP, KIS, and National Economic Recovery Program provided by the country amidst the Covid-19 pandemic. “If there are PKH recipients who are not able to afford but have had a natural graduation, they can be proposed to receive other social assistance. For example, when their children go to college after graduating from high school, they will be assisted to take care of other social assistance such as KIP Lectures or Bidikmisi Scholarships," (Village Coordinator, PKH)
Second, the static database and long stages to be updated caused the dynamic household characteristics cannot be directly captured and included in a real-time coverage as the program implemented. In addition, the KPM graduation (the exclusion process of the ineligible household for the programs) mechanism struggled with the lack of willingness from KPM to avoid assistance. However, the Government of Indonesia (GoI) already
strengthening the effort by SIKS-NG, a digital platform with bottom-up approaches to minimize the exclusion error. The responsibility was monitored by multistage stakeholders in order to increase the database reliability for a wider impact. This effort invited the society to propose the eligible candidate and reduce the inclusion error. Third, during the pandemic, KPM received an
amount of money that may higher as their neighbors that lost jobs so had no income which consequently transformed the KPM rank to the higher class of income. In addition, some of the graduations which already planned a year before had to be postponed as the candidate sources of income declined or fired due to the shock led by the Covid-19 pandemic.
Figure 2 : KPM Distribution based on Quintile and Type Place of Living in Bali 2020
The impact of PKH further investigated through Propensity Score Matching (PSM). Before estimating the impact there was prerequisites test to estimate propensity score. First, this study applied a simple comparison to check whether the means value of both groups
was equal. The t-test conducted concluded that there are significant difference outcomes (p-value = 0,0018 < 5%) among control and treatment group, thereby it is allowed to study the program effect with propensity score. Second, model logit was utilized to
estimate propensity score and Likelihood Ratio Test (prob-chi-square =0,00 < 5%) concluded that overall test significant. Further, the Goodness of Fit checked the model sufficient to explain the research data. The (prob-chi-square =1,00 > 5%) so the prerequisite test has passed and continued to the impact evaluation. The next stage was choosing
the matching methods that applied to this research is Nearest Neighbour (NN) matching, NN(m=1), Kernel Matching, and Stratification. The matching method applied more than one in order to conduct the robustness check as well so the bias sources could be minimized to predict the program impact.
Table4: PKH’s Impact Evaluation in Bali 2020
|
Statistics |
Matching Methods | |||
|
NN |
NN (m=1) |
Kernel |
Stratification | |
|
Food | ||||
|
ATT /SATT |
0,13 |
0,19 |
0,11 |
0,11 |
|
Standard Error |
0,05 |
0,04 |
0,04 |
0,04 |
|
t / z |
2,53 |
4,34 |
2,81 |
2,94 |
|
NonFood | ||||
|
ATT /SATT |
0,10 |
0,19 |
0,06 |
0,08 |
|
Standard Error |
0,08 |
0,06 |
0,05 |
0,05 |
|
t / z |
1,37 |
3,30 |
1,04 |
1,60 |
Source: BPS, 2020 (processed)
Table 4 provides an information on how PKH impacts to the household consumption. It is clear that PKH significantly boosting the food consumption using all the matching method shown by the t-obs> 2. On the other hand, there is not sufficient evidence to reject the null hyphotesis on non-food consumption. PKH beneficiary
spending on food consumption is expected to increase by aroud 11 to 19 percent compared to those who are not receiving the program. Then, the matching quality should be managed. There is a good common support area to explain the distribution of the propensity score so that matching can be done properly (Figure 3). The
common support area is marked by the coinciding part of the propensity score curve between the control and treatment
groups. It is reliable to conclude that the difference caused by the program mpact as the more similar the distribution.
Figure 3. Common Support Assessment
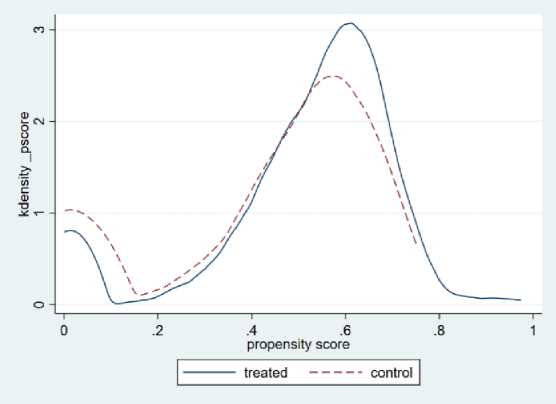
Source: BPS, 2020 (processed)
The matching quality also assessed with t-test after matching to check whether the comparison among control and treatment group. This research found there was a failure to reject the null hypothesis so both control and treatment had equal means. In other words, the matching was sufficient. The last step was to check the selection bias with Rosenbaum’s sensitivity analysis. Selection bias can occur when there are two individuals who have the same observed characteristics but have different probabilities of getting
treatment (Rosenbaum, 2002). Table 5 and Table 6 show the results of the test. The estimation results from Rosenbaum do not differ much from the impact estimation results using the PSM model approach. In addition, the table shows an increase in p-value along with an increase in the gamma ratio. This suggests that selection bias also influenced differences in outcomes between the treatment and control groups. Therefore, it can be concluded that this study is sensitive to selection bias. In other words, the assumption of
the sensitivity of the PSM model fulfils model analysis can be conducted to
the requirements to estimate the impact study the impact lead by PKH.
of PKH on the related outcome. After
the prerequisites fulfilled the PSM
Table 5 : Rosenbaum’s Sensitivity Analysis for PSM Impact Analysis on Food Consumption in Bali 2020
|
Gamma |
significance level |
Hodges-Lehmann point estimate | ||
|
sig+ |
sig- |
lower bound |
upper bound | |
|
1,00 |
0,00 |
0,00 |
0,10 |
0,10 |
|
1,05 |
0,01 |
0,00 |
0,08 |
0,11 |
|
1,10 |
0,03 |
0,00 |
0,07 |
0,12 |
|
1,15 |
0,06 |
0,00 |
0,06 |
0,13 |
|
1,20 |
0,11 |
0,00 |
0,05 |
0,15 |
|
1,25 |
0,18 |
0,00 |
0,03 |
0,16 |
|
1,30 |
0,28 |
0,00 |
0,02 |
0,17 |
|
1,35 |
0,39 |
0,00 |
0,01 |
0,18 |
|
1,40 |
0,50 |
0,00 |
0,00 |
0,19 |
|
1,45 |
0,61 |
0,00 |
-0,01 |
0,20 |
|
1,50 |
0,71 |
0,00 |
-0,02 |
0,21 |
Source: BPS, 2020 (processed)
Table 6 : Rosenbaum’s Sensitivity Analysis for PSM Impact Analysis on Non-Food
Consumption in Bali 2020
|
Gamma |
Significance level |
Hodges-Lehmann point estimate | ||
|
sig+ |
sig- |
lower bound |
upper bound | |
|
1,00 |
0,02 |
0,02 |
0,10 |
0,10 |
|
1,05 |
0,05 |
0,01 |
0,08 |
0,12 |
|
1,10 |
0,10 |
0,00 |
0,07 |
0,14 |
|
1,15 |
0,18 |
0,00 |
0,05 |
0,16 |
|
1,20 |
0,28 |
0,00 |
0,03 |
0,18 |
|
1,25 |
0,40 |
0,00 |
0,01 |
0,19 |
|
1,30 |
0,52 |
0,00 |
0,00 |
0,21 |
|
1,35 |
0,64 |
0,00 |
-0,02 |
0,22 |
|
1,40 |
0,74 |
0,00 |
-0,03 |
0,24 |
|
1,45 |
0,82 |
0,00 |
-0,05 |
0,25 |
|
1,50 |
0,88 |
0,00 |
-0,06 |
0,27 |
Source: BPS, 2020 (processed)
The impact of PKH on household consumption to food is positively significant. By contrast, there is no sufficient evidence to convince that statistically positive effect led to nonfood consumption. There are some arguments to support the phenomena. During the Covid-19 pandemic the household prioritizing their spending on enough food before non-food. The uncertainty of the economic downturn led by the global pandemic caused the household to extra carefully allocated their source of income. PKH provided the beneficiaries to access nutrition through financial assistance. It is increased the household spending on food by 11-19 percent as compared to those that do not receive the program. The findings aligned with the national survey conducted by BPS which resulted in food as the most consumed commodities during the pandemic. The social distancing policies are assumed to cause the rise in food consumption as most of the activities conducted from home such as school from home, work from home, and so on. They preferred to
boost the body immune by cooking their meals rather than going outside where may increase the risk to be suspected by the virus.
KPM mentioned they would rather to eat smaller amount of food but enable them to get job than to buy non-food commodities. The priority absolutely put on food over non-food consumption except for occasional spending, such as holiday, religious ceremony, and local event-related. They avoided to get sick and hoped the sufficient nutrition would enable them to stay fit. Another consideration, it does not matter how the pandemic shock hit the economy, all they had to do was getting a job and making money as some of KPM said they could not rely totally upon benefited from the program only.
Meanwhile, the findings on non-food consumption can be explained as PKH may not the silver bullet to address the non-food basket commodities. First, the household consumption behaviour transformed to less movement during the Covid-19 pandemic. In addition, there is an increasing fear to visit the
health amenities due to the possibility to injured by the virus during the Covid-19 pandemic period. The lack of knowledge at the beginning widespread of this virus causes people are worried too much about visiting public spaces or to stay in-crowd. This is also because of the government instruction to stay at home as an effort to alleviate the virus outbreak chain. Consequently, it reduces the spending on the household non-food expenditure.
“I'm getting older and sick, I'm worried about visiting the Puskesmas unless I have to. I chose to self-medicate with loloh (traditional herb) or boreh (traditional medicine). I am afraid of crowds during the Covid pandemic season”(KPM).
For example, the health expenditure was said substitute by self-medication, the online school that one mentioned supported by local initiatives to provides a free wifi at the public meetings spaces named Bale Banjar but surely with tight health protocol and physical distancing, reducing fuel expenses since no travel are allowed and some activities adjustment especially regarding the social event
which frequently conducted before the pandemic. One KPM said that they had at least five to ten weddings (nganten), religion ceremonies (odalan), and some others village meetings (patedunan, sangkep, ngayah and so on) throughout the year before pandemic. However, due to the pandemic, the event then reduced around two until four times attended by limited participants.
“Before the pandemic season, cremation events and weddings cost quite a lot. But now it is limited and adjusted without reducing the meaning of the implementation of the yadnya ceremony. Piodalan events are limited to only being celebrated by the board but over time it is adjusted according to the health protocol” (KPM).
The services on health facilities are not limited but applied with additional health protocol as explained by PKH’s facilitator during the pandemic. Rapid test and or PCR Swab test applied to minimize the suspected patient. This is also reasoning the KPM afraid of being tested. The overwhelming symptoms diseases similar to Covid-19 even worsening the lack of knowledge society of how this ill actually spread. Thereby, there may statistically not significant
changes found to the household nonfood consumption.
Regarding the program delivery, program monitoring was adjusted and transformed to an online platform using social media. It may ineffective but the best way to handle the needed during this hard time. It is also not possible to conduct group meetings as the outbreak of the pandemic is full of risk and is prohibited by the authorities. On the other hand, the program was said to have been delivered as scheduled. There is no postponement as the program already organized. The beneficiaries can cash out their benefits by January, April, July, and October. The program impacts the improvement in the longer term both for education and health. One KPM mentioned that their children couldn’t afford the school stationaries though most of the public schools are funded. However, PKH changed their lives, and their child is able to graduate from senior high school then soon accepted to a job in the city. Again, by contrast during this pandemic, the shock was impacted on the household
welfare unprecedentedly. The poor once classified as vulnerable may fall even deeper from living under the poverty line. Therefore, they all need assistance to reduce the burden.
The implementation of PKH has been improved and shows a positive trend to alleviate the poverty through impact on household food consumption. During the outbreak of the Covid-19 pandemic, the household consumption behaviour may be changed as the unprecedented pandemic shock against the decline of the source of income experienced. Thereby, a careful decision should be prioritized in order to survive amidst the difficult times. The effort to improve the database quality has been conducted with the utilization of ICT to optimize the updating process. It surely needs commitment from all related actors: stakeholders, KPM, and facilitator as the successor of the program.
Despite all the aforementioned findings above, this study left some room for further works regarding data and methodology. The panel data should be
able to describe the whole picture of the impact of the program on the longer terms impact and consider particular outcomes on education and health. PKH particularly also immensely aim to address poverty through the improvement on education and health access. In addition, an improvement on utilizing the Double Difference (DD) or Instrumental Variable (IV) on experimental design enables the study to reduce bias caused by the unobservable characteristics.
CONCLUSION
The characteristics of KPM and non-KPM during the Covid-19 pandemic in Bali can be identified through several characteristics such as household education, access to clean water, ownership of refrigerator assets, and the accuracy of PKH targeting in Bali is already benefited the most for a those living within the lowest income group. PKH is a conditional cash transfer with prerequisites should be meet. To those among the lowest group may not receive the program since they have no
longer components required in PKH but they are eligible to others social assistance such as KIS, KIP, Program Sembako, Kartu Pra-Kerja and etc.
It is an urgent need to update the household database for PKH recipients on a regular basis to accommodate the dynamics of change on household socioeconomic situations in Bali Province moreover during the Covid-19 pandemic where a rapid change existed. The improvements on the database quality have been conducted with ICT optimization with SIKS-NG until the village level. It is one of the important to increase the quality of the program database which is expected to expand the program accuracy and benefited the most needed groups.
PKH significantly increased the consumption of household foodstuffs in Bali Province during the Covid-19 pandemic by 11-19 percent as compared to those who are not received the program. On the other hand, there is not enough evidence to conclude that PKH has an impact on the consumption of non-food household consumption in
Bali Province during the Covid-19 pandemic outbreak. Most of the KPM placed food as the priority amidst the outbreak of the Covid-19 pandemic.
REFERENCE
Agresti, Alan.(2002). Categorical Data Analysis. New York: Inc. John Wiley and Sons.
Bappenas.(2014). Perlindungan Sosial di Indonesia: Tantangan dan Arah ke Depan. Direktorat Perlindungan dan Kesejahteraan Masyarakat. Jakarta :Bappenas. Available at: https://www.bappenas.go.id/file s/5114/2889/4558/Perlindungan_ Sosial_di_Indonesia-Tantangan_dan_Arah_ke_Depan.p df. [Accessed 15 March 2021]
Badan Pusat Statistik. (2019). Penghitungan dan Analisis Kemiskinan Makro
Indonesia.Jakarta: Subdit Statistik Kerawanan Sosial. BPS.
Badan Pusat Statistik Provinsi Bali. (2021).Pertumbuhan Ekonomi
Triwulan IV Tahun 2020. Berita Resmi Statistik No.14/02/51/TH.XV, 5 Februari 2021. Available at: https://bali.bps.go.id/backend/m ateri_ind/materiBrsInd-20210205083 36.pdf.[Accessed 6 February 2021].
Baez, Javier & Camacho, Adriana. (2011). Assessing the Long-Term
Effects of Conditional Cash Transfers on Human Capital: Evidence from Colombia.
Available at:
https://www.researchgate.net/pu blication/228135655_Assessing_th e_Long-Term_Effects_of_Conditional_Cas h_Transfers_on_Human_Capital_E vidence_from_Colombia/citation/ download. [Accessed 21 February 2021].
Bass, H.(2009). Ragnar Nurkse's Development Theory: Influences and Perceptions. In R. Kattel, J. Kregel, & E. Reinert (Eds.), Ragnar Nurkse (1907–2007): Classical
Development Economics and its Relevance for Today ,pp: 183-202.
Anthem Press. Available at:
https://www.researchgate.net/pu blication/256545464_Ragnar_Nurk se's_Development_Theory_Influen ces_and_Perceptions. Accessed 21 February 2021].
Caliendo, M. and Kopeinig, S.(2008). Some Practical Guidence for the Implementation of Propensity Score Matching. Journal of Economic Surveys, Vol.22, No.1:
pp.31–72.
Cruces, Guillermo &Lanjouw, Peter & Lucchetti, Leonardo &Perova, Elizaveta &Vakis, Renos &Viollaz, Mariana, 2011. Intra-generational mobility and repeated cross-sections : a three-countryvalidation exercise," Policy Research Working Paper Series 5916, The World Bank. Under review – Journal of Economic Inequality.
Available at:
https://openknowledge.worldban k.org/handle/10986/3686.[Access ed 11 March 2021].
Festa Secanela, Patricia. (2017). Conditional Cash Transfer
Programs and Inequality of Opportunity A case study Juntos in Peru. Master Thesis
Department of Economic History : Lund University. Available at: http://lup.lub.lu.se/student-papers/record/8915919.[ Accessed 10 October 2020].
Habibullah.(2017). Perlindungan Sosial Komprehensif di Indonesia Social Protection Comprehensive in
Indonesia. Sosio Informa Vol.3 No.01, Januari-April, Tahun 2017.
KesejahteraanSosial. Available at: https://ejournal.kemsos.go.id/ind ex.php/Sosioinforma/article/dow nload/492/458. [Accessed 15 March 2021].
Hastuti; Ruhmaniyati; Widyaningsih, Dian. (2020). Program Keluarga Harapan (PKH) dan Program Sembako dalam Kerangka Mitigasi Dampak Covid-19. The SMERU Research Institute. Available at: https://smeru.or.id/sites/default /files/events/covidwebinar3_2020 0717_hastuti.pdf. [Accessed 29 June 2021].
Kamakura, Wagner A., Mazzon, Jose Afonso.(2015). Measuring the Impact of a Conditional Cash Transfer on Consumption
Behavior with Propensity Scoring, Research Article 2, pp: 302-316 24
Februari 2015. Available at: https://link.springer.com/article/ 10.1007/s40547-015-0037-0. [Accessed 15 February 2021].
Kementerian Sosial RI. (2018). Pedoman Umum Keluarga Harapan (PKH) Tahun 2019.Jakarta: Kementerian Sosial RI.
Khandker.(2010). Handbook on Impat Evaluation Quantitative Methods and Practices. Washington DC: The World Bank.
McIntyre, Di &Ataguba, John. (2011). How to do (or not to do) ... a benefit incidence analysis. Health policy and planning. 26.pp:174-82. Available at:
https://pubmed.ncbi.nlm.nih.gov /20688764/. [Accessed 27
February 2021].
Olfindo, R. and Fernandez, L. (2011). Overview of the Philippines’ Conditional Cash Transfer Program: The Pantawid Pamilyang Pilipino Program (Pantawid Pamilya), The World Bank. Available at: http://documents.worldbank.org /curated/en/313851468092968987 /pdf/628790BRI0Phil0me0abstract 0as0no010.pdf .[Accessed 20 Desember 2020]
Rosenbaum, P. R., dan Rubin, D.(1983).
The Central Role of the
Propensity Score in
Observational Studies for Causal
Effects. Biometrica, Vol.70, No.1: , pp: 41-45. Available at:
http://nrs.harvard.edu/urn-3:HUL.InstRepos:3382855. [Accessed 21 February 2021].
Rosenbaum, P.R.(2005). Sensitivity analysis in observational studies. Encyslopedia of Statistics in Behavioral Science, Vol.4, pp :1809-1814. Available at: http://www-stat.wharton.upenn.edu/~rosenb ap/BehStatSen.pdf. [Accessed 17 April 2021].
TNP2K.(2017). Basis Data Terpadu 2015: to Choose the Beneficiaries of Social Programs for Poor Based on the Desire Parameters. Jakarta: The National Team for the Acceleration of Poverty Reduction (TNP2K). Available at:
http://www.tnp2k.go.id/downloa ds/2015-integrated-database:-to-eliminate-beneficiaries-of-poor-handling-programs-based-on-desired-parameters. [Accessed 15 May 2021].
405
Discussion and feedback