TAPPING BOX APPLICATION, QUALITY SERVICE, TAX KNOWLEDGE, TAX PAYER’S OBEDIENCE WITH TAX PENALTY AS MODERATING VARIABLE
on
pISSN : 2301 – 8968
JEKT ♦ 14 [1] : 219-241 eISSN : 2303 – 0186
TAPPING BOX APPLICATION, QUALITY SERVICE, TAX KNOWLEDGE, TAX PAYER’S OBEDIENCE WITH TAX PENALTY AS MODERATING VARIABLE
Ni Ketut Rasmini
Ni Putu Sri Harta Mimba
Universitas Udayana
ABSTRAK
Penelitian ini bertujuan untuk menguji pengaruh penerapan tapping box, kualitas pelayanan, dan pengetahuan perpajakan terhadap kepatuhan Wajib Pajak Hotel dan Restoran dengan variabel pemoderasi sanksi pajak pada Badan Pendapatan Daerah Denpasar. Penelitian ini dilakukan pada seluruh Hotel dan Restoran yang memiliki aplikasi tapping box di Denpasar (141 unit). Pengumpulan data dilakukan dengan metode survei dan hanya 100 kuesioner yang digunakan dalam penelitian ini. Data diuji dengan menggunakan analisis regresi yang dimoderasi. Hasil penelitian menunjukkan bahwa penerapan tapping box, kualitas pelayanan, dan pengetahuan perpajakan berpengaruh positif terhadap kepatuhan Wajib Pajak Hotel dan Restoran. Sanksi pajak semakin memperkuat dampak penerapan kotak sadap, kualitas pelayanan, dan pengetahuan perpajakan terhadap kepatuhan Wajib Pajak Hotel dan Restoran. Penelitian ini memberikan kontribusi tentang pentingnya penerapan kotak sadap, memberikan pelayanan yang baik, pengetahuan tentang pajak daerah, dan sanksi perpajakan yang dapat meningkatkan kepatuhan wajib pajak.
Kata kunci: tapping box, kepatuhan, penalti, pengetahuan perpajakan, pelayanan
ABSTRACT
This Research aims to test the impact of tapping box application, service quality, and tax knowledge on the obedience of Hotel and Restaurant tax payer with tax penalty as moderating variable at Badan Pendapatan Daerah in Denpasar. This research conducted on all Hotels and Restaurants that have tapping box application in Denpasar (141 units). Data was collected using survey method and only 100 questioners used in this research. Data was tested using moderated regression analysis. The result showed that the application of tapping box, service quality, and tax knowledge have positive impact on the obedience of Hotel and Restaurant Tax payer. Tax penalty stronger the impact of the application of tapping box, service quality, and tax knowledge on the obedience of Hotel and Restaurant Tax payer. This research give contribution about the importance of tapping box application, provided good services, knowledge about local tax, and tax penalty that could improve obedience of tax payer.
Key words: tapping box, obedience, penalty, tax knowledge, service
INTRODUCTION
Local taxes are collected based on the provisions of Law Number 28 of 2009 concerning Regional Taxes and Regional Levies. Local taxes are taxes that are
managed by local governments whose proceeds are used to finance regional expenditures. Hotel and Restaurant Tax (PHR) is part of local taxes. Hotel tax is collected based on the Regional Regulation of the City
of Denpasar No. 5 of 2011. Hotels are buildings specifically provided for people to be able to stay / rest, get services, and / or other facilities for a fee, including supporting services as hotel accessories which provide convenience and comfort. sports and entertainment facilities, as well as other integrated buildings, are managed and owned by the same party, except for shops and offices.
Restaurant tax in the city of Denpasar is regulated in the restaurant tax of Denpasar City Regulation No. 3 of 2011, is a tax on services provided by restaurants. Restaurant is a food and / or beverage provider facility for free, which includes restaurants, cafeterias, canteens, stalls, bars, and the like, including catering services. The services provided by the restaurant in question include services for the sale of food and / or drinks that are consumed by the buyer, whether consumed at the service place or elsewhere.
PHR as a source of financing has increased quite significantly so that it remains one of the main sources to finance regional expenditure in Denpasar City. The results of observations for five years from 2012 to 2016 shows the contribution of PHR to Denpasar City Regional Tax revenue respectively; 27.5% 22.5%, 23.3%, 21%, 29.7%, or an average in that period of 25%. PHR is a type of regional tax that has the same characteristics, where the
taxpayer is an individual or entity that has a business in the hotel and restaurant sector, which is subject to tax objects or any services provided to customers.
Hotel and Restaurant taxpayers (WPHR) have the right to collect taxes on services provided to consumers and have the obligation to report and pay this tax to the Regional Government. PHR uses a self-assessment system where WPHR is entrusted with calculating the amount of tax owed by itself, which is reported through a Regional Tax Return (SPTPD), so that taxpayer obedience in exercising their rights and obligations greatly determines the amount of PHR revenue for the City government. Taxpayer obedience can be seen from various perspectives and is influenced by several factors; their tendency towards public institutions (in this case the Directorate General of Taxes), the justice felt by taxpayers from the existing system, and the opportunity for the possibility of a violation to be detected and punished in accordance with existing laws and regulations Marziana et al., (2010). Phenomena that occur include the uncovering of taxpayers regarding the total sales received, taxpayers tend to reduce the amount of tax paid, taxpayers do not have adequate knowledge regarding applicable regulations, calculation of regional taxes that are not in accordance with applicable regulations, and lack of awareness. in paying taxes (in arrears) so that tax revenue is not optimal.
Service quality is a measure of how well the level of service provided is able to match customer expectations. So the quality of service is realized through fulfilling the needs and desires of customers and the accuracy of the delivery of these customers to share customer expectations.
The results of observations show that PHR arrears have continued to increase over the past five years, namely from 129.8 million in 2012 to around 4.2 billion in 2016. One of the efforts of the City Regional Revenue Agency to increase taxpayer obedience is by installing application tapping box as an online monitoring of the acceptance of PHR for WPHR in Denpasar City. Tapping Box is a machine or tool that will capture data sent from the cashier to the printer of each WP Hotel and Restaurant (WPHR) and then send it via the GSM network to the Regional Revenue Agency server as an online monitoring mechanism to prevent leakage of PHR receipts. The use of this application is regulated in Denpasar Mayor Regulation Number 18 of 2016.
Attribution theory (Heider, 1958) states that there are 2 (two) basic factors that can influence individual behavior. These factors are internal factors that are within the individual himself such as knowledge, as well as external factors that are outside of the individual such as the monitoring system (in this study, tapping boxes), the quality of tax 221
services, and the existence of sanctions. James and Nobes (1997) state that no tax system can function effectively without the participation of taxpayers. Empirical evidence from several studies shows that service quality and tax knowledge affect taxpayer obedience (Kusuma, 2016; Halim and Ratnawati, 2014; Mareta et al., 2014; Komala, 2014; Murti et al., 2014; Syahril, 2013; Susilawati and Budiartha, 2013; Muarifah, 2013;). Different results were obtained from several studies which showed that the quality of tax services and tax knowledge had no effect on taxpayer obedience (Setiyoningrum et al., 2014; Rukmana, 2014; Pranadata, 2014). When taxpayers perceive that tax sanctions will be more detrimental to them, the level of obedience in tax payments will increase (Jutopurmono, 2014). Taxpayers' obedience in paying taxes can be improved by the presence of firm sanctions (Webley et al., 1991). The inconsistencies in the results of this study prompted a re-examination of the effect of the application tapping box, service quality and tax knowledge on taxpayer obedience by including the tax sanction variable as a moderating variable.
The main theory study used to answer the problem formulation in this study is the Attribution Theory developed by Heider (1958). Heider (1958) explained that the behavior of each individual is determined by
internal and external factors. Apart from the theory of attribution, the supporting theory studies are Theory of Planned Behavior (TPB) and the theory of legitimacy. TPB was developed from Theory of Reasoned Action
the City of Denpasar No. 5 of 2011, and No. 3 of 2011.
Control Beliefs is an individual's belief about the existence of things that support or hinder his behavior and his perception of how
(TRA), which was sparked by Martin strongly these things influence his behavior.
Fishbein and Ajzen in 1975. TBP states that Responsibility for tax payment obligations as
in addition to attitudes towards behavior and a reflection of state obligations in the field of
subjective norms, individuals also consider taxation lies with members of the community
behavioral control they perceive through themselves (Rahmany, 2014). This is in
their ability to perform these actions. In this accordance with the self-assessment system
theory, the behavior carried out by individuals arises because of the intention that drives them to take these actions. The appearance of intention to behave is determined by three determining factors, namely normative beliefs, behavioral beliefs, and control beliefs. The individual's intention
adopted in the taxation system in Indonesia, but often results in unwanted actions, so that the collection system self-assessment needs to be supported by system online monitoring. The use of system online monitoring will make it easier for the Denpasar City Regional Revenue Agency to get an
to behave in obedience or disobedience is overview of the potential hotel and restaurant
influenced by several of these factors.
Legitimacy Theory is a condition or status that exists when a company value system is in line with the value system of a larger social system of which the company is a part (Ghozali and Chairiri, 2007: 411). If it is related to the obedience of hotel and restaurant taxpayers, the theory of legitimacy is closely related to the obedience of restaurant taxpayers in following policies issued by local governments which are a larger social system. This policy is regulated in the Regional Government Regulation of
tax revenue. The System online monitoring used at the Denpasar City Regional Revenue Agency is called a transaction monitoring device known as a Tapping Box. The existence of tax sanctions is expected to make taxpayers more obedient in paying taxes, so the following hypothesis is formulated:
H1: Tax sanctions strengthen the influence of the application tapping box on taxpayer obedience in paying hotel and restaurant taxes
Behavioral beliefs are individual about the results of behavior and evaluation. for these
results (Mustikasari, 2007). Confidence in the results and evaluation of a taxpayer's behavior can be influenced by the quality of service. The willingness of taxpayers to pay taxes is largely influenced by the quality of services provided by the government. service quality was found to have a positive effect on WP obedience (Kusuma, 2016; Halim and Ratnawati, 2014; Mareta et al., 2014; Komala, 2014; Murti et al., 2014; Syahril, 2013; Susilawati and Budiartha, 2013; Muarifah, 2013). The better the quality of service provided by the tax authorities in serving taxpayers, the more comfortable the taxpayers will be in fulfilling their tax obligations. The existence of tax sanctions is expected to increase the willingness of taxpayers to fulfill their tax obligations in accordance with applicable regulations, so it is proposed:
H2: Tax sanctions strengthen the effect of service quality on taxpayer obedience in paying hotel and restaurant taxes.
Normative beliefs are beliefs about the normative expectations of others and motivation to fulfill these expectations (Mustikasari, 2007). Palil (2005) found that good taxpayer knowledge about taxes will minimize tax evasion. Taxpayer's motivation to behave obediently can be increased by the knowledge of taxes. Knowledge of public tax regulations through formal and non-formal
education will have a positive impact on the awareness of taxpayers to pay taxes (Susilawati and Budiartha, 2013). Romandana (2012) proves that tax knowledge has a positive effect on the level of obedience of individual taxpayers at the Surabaya Tax Office (KPP). Susilawati and Budiartha (2013) found that tax knowledge has a positive effect on taxpayer obedience, as well as Kusuma (2016); Halim and Ratnawati (2014); Mareta et al. (2014); Komala 2014; Muarifah (2013), can formulate the following hypothesis:
H3: Tax sanctions strengthen the effect of tax knowledge on taxpayer obedience in paying hotel and restaurant taxes.
RESEARCH METHODOLOGY
This research uses a quantitative approach in an associative form. Research locations are hotels and restaurants that have been installed with a tapping box application by the Denpasar City Regional Revenue Agency. Denpasar is the object of research because PHR arrears in the Regional Revenue Agency of Denpasar have continued to increase over the past five years, from around 3.3 billion in 2012 to around 4.2 billion in 2016.
Operational Definition of Variables
-
1) Taxpayer Obedience in Paying Hotel and Restaurant Taxes
(Y), is the fulfillment of Hotel and Restaurant tax obligations by taxpayers in accordance with statutory regulations. To measure taxpayer obedience in paying hotel taxes, 3 indicators are used: Taxpayers understand or try to understand the provisions of hotel tax laws and regulations; Taxpayers pay hotel taxes due on time; Taxpayers pay hotel tax in an amount according to regulations.
-
2) The Tapping Box application (X1) is a transaction recording tool as an online tax monitoring system related to business transaction data related to hotel and restaurant tax payments. To measure perceptions about the application of the Tapping Box application, 3 indicators are used (Dispenda, 2016), namely: knowledge of the taxpayer about the Tapping Box application; the role of Tapping Box; taxpayer trust in the Tapping Box.
-
3) Service quality (X2), is a comparison between the expectations desired by taxpayers with their assessment of the actual performance of a service provider, in this case the Denpasar City Revenue Agency. Quality service is measured with 4 indicators (Rangkuti,2006) include:
reliability, responsiveness, empathy, appearance officer (tangible).
-
4) Tax Knowledge (X3) is the level of understanding of taxpayers regarding taxation as measured by 3 indicators (Romandana, 2012), including: Knowledge of Taxpayers about Hotel and Restaurant Taxes, Knowledge of the benefits of paying taxes; Taxpayers understand the procedures for paying Hotel and Restaurant taxes.
-
5) Tax Sanctions (X4), are actions and penalties to force taxpayers to obey the provisions of the applicable tax laws. Tax sanctions that can be imposed on violators are in the form of administrative sanctions and criminal sanctions. The indicator of tax sanctions in this study refers to Zahidah (2010) which is modified according to research needs which include: the importance of tax sanctions, the suitability of the size of the sanctions, the suitability of the length of sanctions, the need for sanctions elimination with the number of statement items 6.
Measurement of each of the above variables is carried out using a scale questionnaire Likert with a scale of 1-4. The reason for using a scale modification Likert with a score range of 1 to 4 is to avoid the tendency for
the effect of respondents to choose the middle answer or doubtful answers that can affect the reliability of the data generated (Efferin, et al, 2008: 109). Respondents were asked to fill out questions on a scale Likert with a number of certain categories as follows:
-
1) Strongly Agree Category (SS)
with a score of 4
-
2) Agree Category (S) with a
score of 3
-
3) Category Disagree (TS) with
a score of 2
-
4) Category Strongly Disagree
(STS) with a score of 1
This study uses primary data in the form of the results of filling out questionnaires by respondents related to the application variable tapping Box, service quality, tax knowledge, and taxpayer obedience in paying PHR at the Denpasar City Regional Revenue Agency; and secondary data in the form of the number of hotel taxpayers at the Denpasar City Regional Revenue Agency, hotel tax receipts, hotel tax arrears at the Denpasar City Regional Revenue Agency.
The population in this study were all WPHR registered in the Denpasar City Data Collection Agency until 2018, namely 460 taxpayers (Bappenda, 2017). The sample in this study was taken using purposive sampling method with criteria WPHR registered with the Denpasar City Regional 225
Revenue Agency until 2018 and is a WPHR that has been installed with tapping box tool. Methods of data collection using a questionnaire by delivering directly to the research location and given to respondents. The instrument used has been discussed through a focus group discussion. Besides, the data were also collected by non
participant observation.
Analysis Techniques
Data Were tested for validity and reliability beforehand. In addition, descriptive statistical analysis was carried out and all variables were described with their minimum, maximum, average (values mean) and standard deviation (standard deviation). The hypothesis was tested using Moderated Regression Analysis (MRA). There are two requirements that must be fulfilled in this analysis, namely: classic assumption test and model feasibility test (goodness of fit). MRA is a multiple linear analysis in which the regression equation contains an element of interaction (Ghozali, 2016). The interaction test aims to examine the effect of tax service quality and tax knowledge on Taxpayer obedience behavior moderated by the Taxpayer's intention. The moderated regression equation used is as follows:
Y = α + β1 X1 + β2 X2 + β3 X3 + β4 X4 + β5 X1* X4 + β6 X2* X4 + β7 X3* X4 + e.… (1) Notation:
Y = Obedience of hotel and restaurant
taxpayers α = constant
β1 = regression coefficient of tapping
box application (X1)
β2 = regression coefficient of service
quality (X2)
β3 = Regression coefficient of tax
knowledge (X3)
β4 = Regression coefficient of tax
sanctions (X4)
-
X1 = application of tapping box
-
X2 = quality of service
-
X3 = knowledge of tax
-
X4 = tax sanctions
-
X1 * X4 = Tapping box application interaction with tax sanctions
X2 * X4 = Interaction of service quality with tax sanctions
X3 * X4 = Interaction of tax knowledge with tax sanctions
e = error
Model feasibility test (F test) is a test conducted to determine whether all independent variables affect the variable dependent (Ghozali, 2016). The model can be said to be feasible if the Sig F value of the P value is smaller or equal to 0.05.
Test The coefficient of determination (R2) measuring the strength of the model to explain variations in the dependent variable
(Main, 2011: 78). The value of R has the disadvantage that the bias on the number of independent variables included in the model, 2
so as to cope use the value of Adjusted R
2
where the increase or decrease in adjusted R
can be determined by adding the independent variable in the model (Ghozali, 2016).
Hypothesis testing is done using the t statistical test (significance test of individual parameters). The t test results are seen by comparing the significance level of each independent variable with α = 0.05. If the level of significance of t <α = 0.05, Ho rejected that hypothesis is accepted.
Conversely, if t ≥ α = 0.05, Ho accepted (Ghozali, 2016).
RESULTS AND DISCUSSION
The number of hotel and restaurant taxpayers whose tapping box application has been installed is 141. The research was carried out on the entire population but not all of the questionnaires could be used because they did not return and were not filled in completely as presented in Table 1 below
Table 1:Details of the Rate of Return and the use of questionnaire
|
Description |
Total Questionnaires |
|
Total Questionnaires distributed |
141 |
|
questionnaires were not returned |
30 |
|
questionnaires were unusable |
11 |
|
questionnaire used |
100 |
|
response rate = 30/141 x 100% |
21.28% |
|
usable response rate = 100/141 x 100% |
70.92% |
Source: processed data, 2018
List of Respondents and their addresses are presented in Appendix 1. The results
of the Respondent Description Tabulation are presented in Table 2 as follows.
Table 2 : Description of Respondents
|
No. |
Characteristics of Respondents |
Total | |
|
(Person) |
Percentage (%) | ||
|
1 |
Gender | ||
|
Female |
44 |
44.00 | |
|
Male |
56 |
56.00 | |
|
Total |
30 |
100 | |
|
2 |
Education | ||
|
High School / Vocational |
5 |
5.00 | |
|
Diploma |
27 |
27.00 | |
|
S1 |
68 |
68.00 | |
|
Total |
100 |
100 | |
Source: Data processed, 2018
Table 2 shows that the dominant respondents are male and their education level is predominantly undergraduate (strata 1). The results of the validity test show that all variables have a correlation coefficient value with a total score of all statement items greater than 0.30. This shows that the statement items in the research instrument
are all valid. Reliability test results show that all research instruments have a coefficient Cronbach's Alpha of more than 0.60. This shows that all instruments are reliable so that they can be used to conduct research. The results of the descriptive statistical test are presented in Table 3 as follows.
Table 3 : Descriptive Statistics
|
N |
Minimum |
Maximum |
Mean |
Std. Deviation | |
|
X1 |
100 |
18.00 |
24.00 |
21.8700 |
2.04324 |
|
X2 |
100 |
9.00 |
12.00 |
10.6100 |
1.27837 |
|
X3 |
100 |
7.00 |
16.00 |
12.8800 |
2.27982 |
|
X4 |
100 |
5.00 |
12.00 |
10.3500 |
1.62912 |
|
Y |
100 |
9.00 |
12.00 |
11.3900 |
0.88643 |
|
X1X4 |
100 |
90.00 |
288.00 |
228.6700 |
51.39883 |
|
X2X4 |
100 |
45.00 |
144.00 |
111.1900 |
27. 67002 |
|
X3X4 |
100 |
35.00 |
192.00 |
135.4400 |
36.46288 |
|
Valid N (listwise) |
100 |
Source: processed data
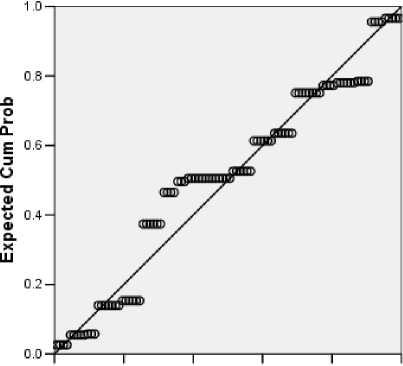
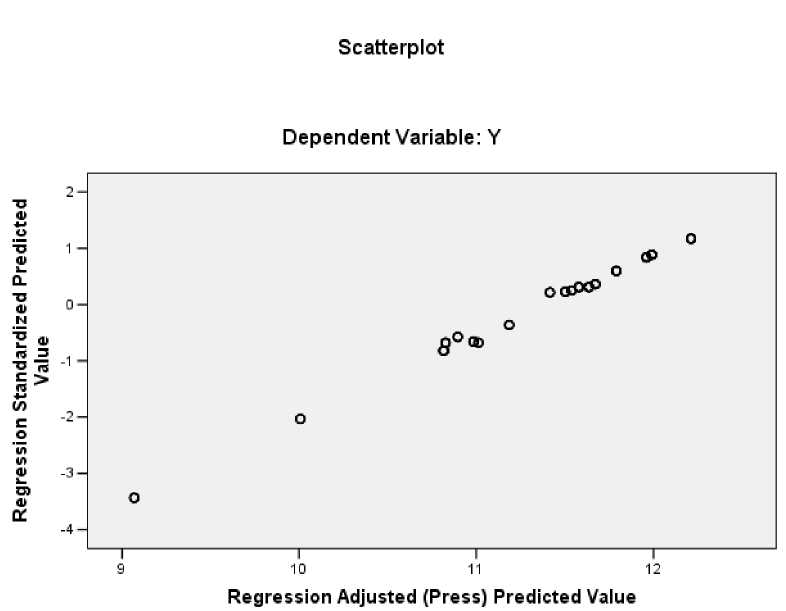
The results of the classical assumption tests carried out in this study are the normality test, multicollinearity test, and
heteroscedasticity test. The normality test aims to determine whether the residuals of the regression models are normally
distributed or not. The test results using the Scatter plot show that the data is scattered on a diagonal line and follows the direction of the diagonal line which indicates that the data is normally distributed. Heteroscedasticity test is performed to determine whether the regression model has an inequality of variants. This test was analyzed by means of a scatter plot and it appears that the dotted image pattern is quite spread out so that it is free from heteroscedasticity symptoms. The results of the Moderated Regression test are presented in Table 4.
|
Table 4 :Results of Multiple Linear Regression Analysis | |||||||
|
Model |
Unstandardized Coefficients |
Standardized Coefficients |
Sig. |
95% Confidence Interval for B | |||
|
B |
Std. Error |
Beta |
t |
Lower Bound |
Upper Bound | ||
|
(Constant) |
8.158 |
5.788 |
1.409 |
0.162 |
3.338 |
19.654 | |
|
X1 |
1.933 |
0.698 |
4.456 |
2.771 |
0.007 |
3.319 |
8.547 |
|
X2 |
2.895 |
1.177 |
4.175 |
2.459 |
0.016 |
0.557 |
5.232 |
|
X3 |
1.214 |
0.229 |
3.123 |
5.294 |
0.000 |
0.759 |
1.67 |
|
X4 |
0.194 |
0.545 |
0.357 |
0.356 |
0.723 |
1.276 |
0.888 |
|
X1X4 |
0.208 |
0.073 |
12.052 |
2.856 |
0.005 |
0.063 |
0.352 |
|
X2X4 |
0.284 |
0.121 |
8.858 |
2.336 |
0.022 |
0.525 |
0.042 |
|
X3X4 |
0.109 |
0.022 |
4.497 |
-4.942 |
0.000 |
0.153 |
0.065 |
|
Source: Data processed | |||||||
|
Based on the results of multiple linear 1) regression analysis as presented in Table 4.9, the regression equation is as follows: Y = 8.158 +1.933 X1 + 2.895 X2 + 1.214 X3 +0.194 X4 + 0.208 X1 * X4 + 0.284X2 * X4 + 0.109 x3 * X4 |
Constant value of 8.158 indicates Tapping box application (X1), service quality (X2), tax knowledge ( X3), and tax sanctions (X4) are worth 0, then taxpayer obedience in paying hotel and restaurant taxes tends to increase. | ||||||
-
2) The regression coefficient value of the tapping box application (X1) is 1.933, meaning that the tapping box 7)
application is positively related to
taxpayer obedience to pay hotel and
restaurant taxes. This indicates that the tapping box application tends to
increase taxpayer obedience in paying 8) hotel and restaurant taxes.
-
3) The regression coefficient value of service quality (X2) is 2.895, indicating that tax knowledge has a positive relationship with taxpayer obedience in paying hotel and restaurant taxes.
-
4) The regression coefficient value of tax
tapping box application on taxpayer obedience.
The interaction coefficient of tax sanctions with service quality is 0.284 indicating that tax sanctions strengthen the effect of service quality on taxpayer obedience.
The coefficient of interaction between tax sanctions and knowledge of taxation is 0.109, indicating that tax sanctions strengthen the influence of Taxpayers' knowledge of taxation on their obedience in carrying out their tax obligations.
Before testing the hypothesis, it is
knowledge (X3) of 1.214 indicates that necessary to test the feasibility of the research tax knowledge tends to increase model carried out with the F test. ANOVA taxpayer obedience in paying hotel and table shows the magnitude of the probability restaurant taxes. or significance number in the ANOVA
-
5) The regression coefficient value of calculation. Table 5 shows the significance of taxation sanctions (X4) is 0.194, which 0.05, so the Analysis Model is considered means that tax sanctions tend to cause feasible. If Sig. ≥ 0.05, then the Analysis taxpayers to comply with their tax Model is considered not feasible.
obligations.
-
6) The interaction coefficient of tax sanctions with the tapping box application is 0.208, indicating that tax sanctions strengthen the effect of the
Table 5: Model Feasibility Test Results (F test)
Std. Error
R Adjusted Change Statistics DurbinSquare R Square Eostimaete R F df1 df2 Sig. F Watson
|
Square Change |
Change |
Change | ||||||
|
1.000 |
.769a |
0.591 |
0.560 |
0.58798 0.591 |
19.001 |
7 |
92 0.000 |
2.366 |
a. Predictors : (Constant), X3X4, X1,X4, X2,X3, X2X4, X1X4
b. Dependent Variable : Y
Source: Processed data
Anova test results or F test in Table 5
shows the calculated F value of 19.001 with
a significance of 0.000, which has a significance probability smaller than alpha 0.05. This shows that the model used in this
study is feasible. Based on Table 5, the Adjusted R Square of 0.560 means that 56 percent of the variation in taxpayer obedience to pay hotel and restaurant taxes in the Denpasar City Regional Revenue Agency is influenced by variations in
Table 6: Results of statistical test analysis t
tapping box applications, service quality, tax knowledge, and tax sanctions, while the remaining 44 percent is explained by other factors not included in the model.
The t statistical test shows how far the
influence of one independent variable individually in explaining the dependent variable. The statistical test was carried out
by comparing the results of the significance value with α = 0.05. The results of the t test
in Table 6 are as follows.
|
Variable |
Coeff. Regression |
t |
Sig |
|
Tapping box application (X1) |
1.933 |
2.271 |
0.007 |
|
Service quality (X2) |
2.895 |
2.459 |
0.016 |
|
Tax knowledge (X3) |
1.895 |
5.294 |
0.000 |
|
Tax sanctions (X4) |
1.214 |
0.356 |
0.723 |
|
X1*X4 |
0.208 |
2.856 |
0.005 |
|
X2*X4 |
0.284 |
2.336 |
0.022 |
|
X3*X4 |
0.109 |
4.942 |
0.000 |
Source: Data processed
Table 6 shows the
effect of each
independent variable on variable. The results show
knowledge have an effect on WPPHR obedience because the significance is less than 0.005. The results of the interaction of
the dependent that the tapping
box application, service quality and tax
tax sanctions with the tapping box
application variables, service quality and tax knowledge also show a significance (smaller than 0.005). This indicates that tax sanctions strengthen the effect of tapping box applications, service quality and tax knowledge on WPPHR obedience. The results of the t test of tax sanctions on WPPHR obedience show insignificant results which indicate that tax sanctions are a pure moderator.
The test results of this research support for hypotheses 1, 2 and 3 that indicates support for the theory of attribution theory developed by Heider (1958). Heider (1958) explained that the behavior of each individual is determined by internal and external factors. The obedience of WPHR in paying taxes is influenced by their knowledge of taxation, the good quality of service from the Regional Revenue Agency officials and the existence of tax sanctions. In addition, this research also supports Theory of Planned Behavior (TPB) and the theory of legitimacy. Theory of Planned Behavior (TPB) was developed from Theory of Reasoned Action (TRA) which was initiated by Martin Fishbein and Icek Ajzen in 1975. TBP states that in addition to attitudes towards behavior and subjective norms, individuals also consider behavioral
control they perceive through their ability to perform these actions. In this theory, the behavior carried out by individuals arises because of the intention that drives them to take these actions. The appearance of intention to behave is determined by three determining factors, namely normative beliefs, behavioral beliefs, and control beliefs. The individual's intention to behave in obedience or disobedience is influenced by several of these factors.
Hotel and restaurant taxpayer obedience also shows support for the legitimacy theory. Legitimacy Theory is a condition or status that exists when a company value system is in line with the value system of a larger social system of which the company is a part (Ghozali and Chairiri, 2007: 411). The obedience of hotel and restaurant taxpayers in following the policies issued by the local government which is a larger social system because they do not want to violate the prevailing value system.
The test results also support the results of previous research by Rahmany (2014) which shows that the responsibility for tax payment obligations as a reflection of state obligations in the field of taxation lies with members of the community themselves.
Related to the quality of service, the results of this study also support the results of previous research from Kusuma (2016); Halim and Ratnawati (2014); Mareta et al. (2014). (2014); Komala 2014; Murti et al. (2014); Syahril (2013); Susilawati and Budiartha (2013); and Muarifah (2013) The results of their research show that the willingness of taxpayers to pay taxes is largely influenced by the quality of services provided by the government. service quality was found to have a positive effect on WP obedience.
CONCLUSIONS AND RECOMMENDATIONS Conclusion
Based on the test results, it can be concluded:
-
1) tax sanctions strengthen the effect of tapping box applications on taxpayer obedience in paying hotel and restaurant taxes.
-
2) tax sanctions strengthen the effect of service quality on taxpayer obedience in paying hotel and restaurant taxes.
-
3) Tax sanctions strengthen the influence of tax knowledge on
Taxpayer's motivation to behave obediently can be increased by the knowledge of taxes. The research results also support the results of previous research related to the role of tax knowledge on taxpayer obedience. Susilawati and Budiartha (2013), Romandana (2012) show that knowledge of public tax regulations through formal and non-formal education will have a positive impact on the awareness of taxpayers to pay taxes (Susilawati and Budiartha, 2013; Romandana, 2012).
taxpayer obedience in paying Hotel and Restaurant Taxes.
Implications and Limitations of Research This research has implications related to the policy of the Denpasar City Regional Revenue Agency by conducting periodic counseling in order to increase insight on the benefits of paying hotel and restaurant taxes for regional development. In addition, this agency is expected to improve the quality of services to WPHR so that they feel comfortable paying taxes. Also increasing the number of tapping box applications in stages to monitor WPHR obedience in meeting its tax obligations according to regional financial capabilities.
The usable rate in this study is not 100%
and this research was conducted only in one city due to limited funds and research time, so that to strengthen the research results, further research can be carried out on a wider object, adding other variables in this study such as culture in the form of wisdom. local Tri hita Karana, understanding taxpayers related to norms and ethics so as to enrich insight in this field.
REFERENCES
Ajzen, I. (1991) ‘The Theory of Planned Behavior’, Organizational Behaviour and Human Decision Processes, 50, pp. 179–211.
Ghozali, I. (2016) Application of Multivariate Analysis with the SPSS Program. Semarang: BP UNDIP.
James, S. and Nobes, C. (1997) The Economics of Taxation, Principle, Policy and Practice. Europe: Prentice Hall.
Komala, K. C. (2014) ‘The Influence of Tax Service Quality on Corporate Taxpayer Compliance’, Taxation Student Journal, 2(1), pp. 1–9.
Kusuma, K. C. (2016) The Effect of Tax Service Quality, Understanding of Taxation Regulations and Tax Sanctions on Individual Taxpayer Compliance in Paying Taxes. Yogyakarta State University.
Mareta, E., Handayani, S. R. and Husaini, A. (2014) ‘Pengaruh Pelaksanaan Sensus Pajak Nasional, Kualitas Pelayanan dan Pengetahuan Pajak Terhadap Kepatuhan Wajib Pajak’,
Jurnal Mahasiswa Perpajakan, 3(1).
Mustikasari, E. (2007) ‘Empirical Study on Corporate Taxpayer Compliance in Processing Industry Companies in Surabaya’, in Empirical Study on Corporate Taxpayer Compliance in Processing Industry Companies in Surabaya. Accounting X Nationa lSymposium.
Palil, M. R. (2005) ‘Does Tax Knowledge Mater in Self Assessment System Evidence from Malaysia Tax Administrative’, The Journal of the American Academy of Business, 6(2), pp. 80–84.
Romandana, A. (2012) Pengaruh Pengetahuan Pajak, Persepsi tentang Petugas Pajak dan Sistem Administrasi Pajak terhadap Tingkat Kepatuhan Wajib Pajak Orang Pribadi. STIE Perbanas Surabaya.
Service, D. C. R. (2016) Final Report on Capital Expenditure Activities for Procurement of Tapping Box Tool. Jakarta.
Susilawati, K. E. and Budiartha, K. (2013) ‘Pengaruh kesadaran wajib pajak, pengetahuan pajak, sanksi perpajakan dan akuntabilitas pelayanan publik pada kepatuhan wajib pajak kendaraan bermotor’, E Jurnal Akuntansi Univeristas Udayana, 4(2), pp. 345–357.
Webley, P. et al. (1991) Tax Evasion: An Experimental Approach. United
Kingdom: Cambridge University
Press.
pISSN : 2301 – 8968
JEKT ♦ 14 [1] : 219-241
eISSN : 2303 – 0186
RESEARCH QUESTIONNAIRE
Denpasar, …………………………….
To:
Dear. Mr / Ms .......................
in
place
With Regards,
Herewith I submit this letter to Mr / Mrs/ Ms that I am the undersigned:
Name: Dr. Ni Ketut Rasmini, SE., MSi., Ak, CA
Institution : Faculty of Economics and Business, Udayana University
Rank / Objective: Lector / IIId
NIP : 19661008 1993 03 2001
conducted research on:
THE EFFECT OFAPPLICATIONS TAPPING BOX, SERVICE QUALITY, AND TAX KNOWLEDGE OBEDIENCE WITH HOTEL AND RESTAURANT TAXES WITH TAXATION SANCTIONS AS A MODERATE
In this regard, I ask for help from Mr /Mrs/ Ms to be willing to fill out this questionnaire properly. For the willingness and attention from Mr /Mrs/ Ms, I thank you.
Sincerely,
Ni Ketut Rasmini
Please Mr. / Mrs / Ms willing to fill in the statement below by providing a checklist (√) on
the available options
Name of Hotel / Restaurant
Name of Respondent :
Position
Gender
Male
Female
Last Education
SMA / SMK
Diploma
S1
S2
S3
Do you use a transaction recording device (Tapping Box)?
Yes
No
Instructions for Filling
Mr / Mrs / Brother / i, please provide a response according to the choice of Mr / Mrs / Ms by providing a check list (√) on the answer to each question below.
Information:
STS = Strongly Disagree
S = Agree
SS = Strongly Agree
TS = Disagree
I. TAX OBEDIENCE
|
N o. |
Description of Statement |
TSS |
TS |
S |
SS |
|
1. |
I understand and try to understand the laws and regulations regarding hotel and restaurant taxes | ||||
|
2. |
I am willing to pay Hotel and Restaurant taxes owed on time | ||||
|
3. |
I pay Hotel and Restaurant taxes in an amount that is in accordance with regulation |
II. TAX SANCTION
|
N o. |
Description of Statement |
TSS |
TS |
S |
SS |
|
1. |
I understand that tax sanctions need to be carried out by the government | ||||
|
2. |
The amount of taxation sanctions is appropriate | ||||
|
3. |
I know that taxes are determined by law and can be enforced | ||||
|
4. |
I know that if paying taxes is not what it should be paid penalized | ||||
|
5. |
Penalties very burden some taxation taxpayers | ||||
|
6. |
tax penalty a deterrent effect for taxpayers |
III. KNOWLEDGE OF TAX
|
No. |
Statement Explanation |
STS |
TS |
S |
SS |
|
1. |
I know that Hotel and Restaurant Tax is included in local taxes | ||||
|
2. |
I know that Taxes are used for general and development expenditures. | ||||
|
3. |
I understand the procedures for paying taxes for hotels and restaurants. |
IV. SERVICE QUALITY
|
No. |
Statement of |
STS |
TS |
S |
SS |
|
1. |
I feel that the services provided by the tax authorities provide accurate and reliable services | ||||
|
2. |
I feel that the services provided by the tax authorities are responsive. | ||||
|
3. |
I feel that the services provided by the tax authorities have the ability and courtesy of employees as well as the trustworthiness of employees | ||||
|
4. |
appearance of officers (tangible), to measure physical appearance, equipment, employees, and means of communication supports the |
-
V. APPLICATION OF TRANSACTIONTOOLS (RECORDINGTAPPING) BOX)
No.
Statement of Statement
STS
TS
S
SS
1.
I know about the application of a transaction recording device (Tapping Box)
2.
I know that the application of a transaction recording device (Tapping Box) is able to provide convenience for taxpayers.
I am willing to voluntarily install a transaction recording device (Tapping Box) for the success of online tax monitoring activities,
-
Appendix 3
Regression
Descriptive Statistics
|
Mean |
Std. Deviation |
N | |
|
Y |
11,3900 |
,88643 |
100 |
|
X1 |
21,8700 |
2,04324 |
100 |
|
X2 |
10,6100 |
1,27837 |
100 |
|
X3 |
12,8800 |
2,27982 |
100 |
|
X4 |
10,3500 |
1,62912 |
100 |
|
X1X4 |
228,6700 |
51,39883 |
100 |
|
X2X4 |
111,1900 |
27,67002 |
100 |
|
X3X4 |
135,4400 |
36,46288 |
100 |
Correlations
|
Y |
X1 |
X2 |
X3 |
X4 |
X1X4 |
X2X4 |
X3X4 | |
|
Pearson Correlation Y |
1,000 |
,541 |
,519 |
,568 |
,527 |
,556 |
,553 |
,568 |
|
X1 |
,541 |
1,000 |
,908 |
,554 |
,703 |
,890 |
,876 |
,719 |
|
X2 |
,519 |
,908 |
1,000 |
,563 |
,668 |
,839 |
,902 |
,723 |
|
X3 |
,568 |
,554 |
,563 |
1,000 |
,580 |
,602 |
,612 |
,903 |
|
X4 |
,527 |
,703 |
,668 |
,580 |
1,000 |
,946 |
,921 |
,852 |
|
X1X4 |
,556 |
,890 |
,839 |
,602 |
,946 |
1,000 |
,983 |
,861 |
|
X2X4 |
,553 |
,876 |
,902 |
,612 |
,921 |
,983 |
1,000 |
,862 |
|
X3X4 |
,568 |
,719 |
,723 |
,903 |
,852 |
,861 |
,862 |
1,000 |
|
Sig. (1-tailed) Y |
. |
,000 |
,000 |
,000 |
,000 |
,000 |
,000 |
,000 |
|
X1 |
,000 |
. |
,000 |
,000 |
,000 |
,000 |
,000 |
,000 |
|
X2 |
,000 |
,000 |
. |
,000 |
,000 |
,000 |
,000 |
,000 |
|
X3 |
,000 |
,000 |
,000 |
. |
,000 |
,000 |
,000 |
,000 |
|
X4 |
,000 |
,000 |
,000 |
,000 |
. |
,000 |
,000 |
,000 |
|
X1X4 |
,000 |
,000 |
,000 |
,000 |
,000 |
. |
,000 |
,000 |
|
X2X4 |
,000 |
,000 |
,000 |
,000 |
,000 |
,000 |
. |
,000 |
|
X3X4 |
,000 |
,000 |
,000 |
,000 |
,000 |
,000 |
,000 |
. |
|
NY |
100 |
100 |
100 |
100 |
100 |
100 |
100 |
100 |
|
X1 |
100 |
100 |
100 |
100 |
100 |
100 |
100 |
100 |
|
X2 |
100 |
100 |
100 |
100 |
100 |
100 |
100 |
100 |
|
X3 |
100 |
100 |
100 |
100 |
100 |
100 |
100 |
100 |
|
X4 |
100 |
100 |
100 |
100 |
100 |
100 |
100 |
100 |
|
X1X4 |
100 |
100 |
100 |
100 |
100 |
100 |
100 |
100 |
|
X2X4 |
100 |
100 |
100 |
100 |
100 |
100 |
100 |
100 |
|
X3X4 |
100 |
100 |
100 |
100 |
100 |
100 |
100 |
100 |
Variables Entered/Removedb
|
Model |
Variables Entered |
Variables Removed |
Method |
|
1 |
X3X4, X1, X4, X2, X3, X2X4, a X1X4 |
. |
Enter |
-
a. All requested variables entered.
-
b. Dependent Variable: Y
Model Summaryb
|
Model |
R |
R Square |
Adjusted R Square |
Std. Error of the Estimate |
Change Statistics |
Durbin-Watson | ||||
|
R Square Change |
F Change |
df1 |
df2 |
Sig. F Change | ||||||
|
1 |
,769a |
,591 |
,560 |
,58798 |
,591 |
19,001 |
7 |
92 |
,000 |
2,366 |
a. Predictors: (Constant), X3X4, X1, X4, X2, X3, X2X4, X1X4
b. Dependent Variable: Y
ANOVAb
|
Model |
Sum of Squares |
df |
Mean Square |
F |
Sig. |
|
1 Regression |
45,983 |
7 |
6,569 |
19,001 |
,000a |
|
Residual |
31,807 |
92 |
,346 | ||
|
Total |
77,790 |
99 |
-
a. Predictors: (Constant), X3X4, X1, X4, X2, X3, X2X4, X1X4
-
b. Dependent Variable: Y
Coefficientsa
|
Model |
Unstandardized Coefficients |
Standardized Coefficients |
t |
Sig. |
95% Confidence Interval for B | ||
|
B |
Std. Error |
Beta |
Lower Bound |
Upper Bound | |||
|
1 (Constant) |
8,158 |
5,788 |
1,409 |
,162 |
3,338 |
19,654 | |
|
X1 |
1,933 |
,698 |
4,456 |
2,771 |
,007 |
3,319 |
8,547 |
|
X2 |
2,895 |
1,177 |
4,175 |
2,459 |
,016 |
,557 |
5,232 |
|
X3 |
1,214 |
,229 |
3,123 |
5,294 |
,000 |
,759 |
1,670 |
|
X4 |
,194 |
,545 |
,357 |
,356 |
,723 |
1,276 |
,888 |
|
X1X4 |
,208 |
,073 |
12,052 |
2,856 |
,005 |
,063 |
,352 |
|
X2X4 |
,284 |
,121 |
8,858 |
2,336 |
,022 |
,525 |
,042 |
|
X3X4 |
,109 |
,022 |
4,497 |
4,942 |
,000 |
,153 |
,065 |
a. Dependent Variable: Y
Residuals Statisticsa
|
Minimum |
Maximum |
Mean |
Std. Deviation |
N | |
|
Predicted Value |
9,0513 |
12,1885 |
11,3900 |
,68153 |
100 |
|
Std. Predicted Value |
-3,432 |
1,172 |
,000 |
1,000 |
100 |
|
Standard Error of | |||||
|
Predicted Value |
,100 |
,291 |
,160 |
,045 |
100 |
|
Adjusted Predicted Value |
9,0679 |
12,2122 |
11,3826 |
,68398 |
100 |
|
Residual |
-1,14329 |
1,07342 |
,00000 |
,56681 |
100 |
|
Std. Residual |
-1,944 |
1,826 |
,000 |
,964 |
100 |
|
Stud. Residual |
-1,980 |
1,909 |
,006 |
,999 |
100 |
|
Deleted Residual |
-1,18534 |
1,17350 |
,00745 |
,60957 |
100 |
|
Stud. Deleted Residual |
-2,012 |
1,937 |
,005 |
1,008 |
100 |
|
Mahal. Distance |
1,852 |
23,193 |
6,930 |
5,012 |
100 |
|
Cook's Distance |
,000 |
,042 |
,009 |
,013 |
100 |
|
Centered Leverage Value |
,019 |
,234 |
,070 |
,051 |
100 |
a. Dependent Variable: Y
Charts
Normal P-P Plot OfRegression Standardized Residual
Dependent Variable: Y
0.0 0.2 0.4 0.6 0.S 1.0
Observed Cum Prob
Descriptives
Descriptive Statistics
|
N |
Minimum |
Maximum |
Mean |
Std. Deviation | |
|
X1 |
100 |
18,00 |
24,00 |
21,8700 |
2,04324 |
|
X2 |
100 |
9,00 |
12,00 |
10,6100 |
1,27837 |
|
X3 |
100 |
7,00 |
16,00 |
12,8800 |
2,27982 |
|
X4 |
100 |
5,00 |
12,00 |
10,3500 |
1,62912 |
|
Y |
100 |
9,00 |
12,00 |
11,3900 |
,88643 |
|
X1X4 |
100 |
90,00 |
288,00 |
228,6700 |
51,39883 |
|
X2X4 |
100 |
45,00 |
144,00 |
111,1900 |
27,67002 |
|
X3X4 |
100 |
35,00 |
192,00 |
135,4400 |
36,46288 |
|
Valid N (listwise) |
100 |
241
Discussion and feedback