The Effect of Capital Expenditure on Local Revenue: Study In East Java Indonesia
on
pISSN : 2301 - 8968
eISSN : 2303 - 0186
JEKT ♦ 10 [2] : 137-144
The Effect of Capital Expenditure on Local Own-Source Revenue: Study In East Java Indonesia
Danang Triyanto Setyo Tri Wahyudi Candra Fajri Ananda
ABSTRACT
In the decentralization era, local independence is the logic consequence of the implementation of fiscal decentralization. Further, fiscal decentralization has potentially to increase economic efficiency of the local government if compared with the central government. This research analyzed the effect of capital expenditure through Regional Gross Domestic Product (RGDP) on Local Own-Source Revenue. The sample in this study was 38 districts/ cities in East Java province in Indonesia using path analysis. The results showed some findings, first, capital expenditures which divided into productive capital expenditures and less productive capital expenditures has affect on regional gross domestic product. Second, regional gross domestic product has affects on the forming components of local own-source revenue. Furthermore, less productive capital expenditures and productive capital expenditures have indirect effect on local own-source revenue through regional gross domestic product.
Keywords: fiscal decentralization, capital expenditure, regional gross domestic product, local ownsource revenue
BACKGROUND
Policies of regional autonomy and fiscal decentralization in Indonesia at the level of provincial government and local government in district/city have been implemented since 1999, which outlined in Law No. 22, 1999 concerning “Local Government” and Law No. 25, 1999 concerning “The Fiscal Balance Between the Central Government and the Regions”. Some experts such as Oates (1993), Bird (1993), and Bahl and Linn (1992) believe that fiscal decentralization will increase economic efficiency, so that the handing over of the most of local government authority is expected to improve the efficiency of public services and ultimately will encourage regional economic growth and welfare of local communities. The results of the research from Kusuma (2016) explained that fiscal decentralization in Indonesia have an impact on economic growth.
In addition to improving public services, a logical consequence of the implementation of fiscal decentralization is to realize the region’s autonomy. Independence in the narrow sense is defined as the government’s ability to finance its own development (Sudantoko, 2003), so that local governments is expected to
explore the local financial resources, especially through the local revenue. Local revenue is ideally served as the principal source of local revenue, because other sources of revenue can be volatile and tend to be beyond the control of the regional authority (Bappenas, 2003).
Despite the fact that the decentralization has been implemented more than a decade, the level of fiscal dependency on transfers from the central area remains relatively high. According to Saragih (2003), this condition occurs due to the inability of local government in optimally exploring the local potentials; as a result the implemented decentralization system seems undistinguishable. Khusaini (2006) asserts that the low contribution of the local revenue is due to the very limited local taxing power. It is still difficult for the local government to increase revenue and mainly to optimize local tax and levy although the objects of tax and levy have been expanded as well as the provision of discretion in setting rates based on Law No. 28 of 2009.
The increased local revenue is actually an excess of the increased RGDP (Suparmoko, 2001, Saragih, 2003). It can be an alternative for the local government for increasing revenue by focusing more on increasing RGDP through optimizing local resources
rather than issuing regulations on tax and levy. According to Mardiasmo (2002) and Sidik (2002), the excessive and uncontrolled exploitation of local revenue will give negative impacts on society and business world which lead to a disincentive of the regional economy. Thus, in order to increase the local revenue, local government should formulate public policy by emphasizing on increasing RGDP for instance by allocating the budget on productive expenditures or investment.
Capital expenditure is an investment type of government expenditure which will have a high multiplier effect toward the increase in RGDP (DJPK, 2013). Local capital expenditure is used for the creation of public fixed assets comprising land, equipment and machinery, building and structure, road, irrigation and network as well as other fixed asset, aimed for public services and officers. In this case, capital expenditure used for public services would be more productive than capital expenditure used for regional apparatus.
In fact, the majority of regions in Indonesia allocate capital expenditure in a small portion andevenlowerthantheallocationforpersonnel expenditure. Based on the State Budget in 2013, the nationwide local expenditure reached IDR 707,083 trillion with a portion for capital expenditure of 24.8% which was far below the budget allocation for personnel expenditure of 41.9%. The lowest ratio of capital expenditure to total expenditure was possessed by Yogyakarta province (12.59%) while the highest ratio of capital expenditure was owned by East Kalimantan province (44.08%). Munnell and Cook (1990) argue that public capital investment, especially public infrastructure has a positive influence toward regional output (RGDP), private investment, and employment. Furthermore, Todaro and Smith (2004) specifically mention the three factors that affect the output of society, namely capital accumulation, workforce, and technological advances.
East Java province has a strategic role as a contributor to the Gross Domestic Product (GDP) as the second largest contributor after Jakarta and has a RGDP rate above the rate of national GDP during 2009-2013. However, the
local governments of districts/cities in East Java still largely experience fiscal dependence and have low capital expenditure allocation in which the distribution in each region varies.
Figure 1. The Ratio of Capital Expenditure to the Regional Expenditure and the Ratio of Local Revenue to Local Revenue in 38 Districts/ Cities in East Java in 2013
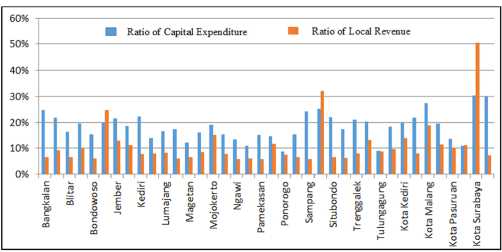
Source: DJPK Ministry of Finance, 2014 (data processed)
Figure 1 above shows the inequality in terms of the allocation of capital expenditure and the ratio of local revenue to the local revenue of Districts/Cities in East Java province. The percentage of capital expenditure allocation in 2013 for each local government both in districts and cities was very diverse. The lowest percentage of capital expenditure allocation was 8.77% (Ponorogo District) and the highest was 30.28% (Surabaya City) and the average percentage of capital expenditure allocation was 18.41%. The ratio of local revenue to local revenue in 2013 for each local government both in districts/ cities in East Java was also diverse. The lowest local revenue was 5.69% (Ngawi District) and the highest was 50.48% (Surabaya City) and the average ratio of local revenue was 11.06%.
Several research on government spending and local revenue has been done in Indonesia. Setiyawati and Hamzah (2007) examined the effect of Local Reveneue, General Allocation Grant , Specific Allocation Fund and development spending to economic growth and also the impact of economic growth on poverty and unemployment in 38 regencies/ cities in East Java in 2001-2005. They found that development spending has a negative relationship and no significant effect on economic growth. Furthermore, Gunantara
and Dwirandra (2014) analyzed the effect of Local Own-Source Reveneue, General Allocation Grant, and capital expenditure on economic growth at 9 districts/municipalities in Bali in 2005-2011. By using regression, they found that the Local Own Source Revenue and General Allocation Grant has positive and significant impact on economic growth, but capital expenditure has negative significantly effect on economic growth.
On the other hand, Santosa and Rahayu (2005) investigated the influence of the GDP, population and government expenditure on Local Own-Source Revenue in Kediri city during the period 1989-2002. By using multiple regression analysis, they concluded that all independent variables has positive and significant impact on local revenues. By using the same analytical tools, Basri (2009) investigated the influence of the GDP and the transfer of funds to the Local Own-Source Revenue in Pekanbaru City. Basri found that the GDP has positive and significant effect on the Local Own-Source Revenue, while the transfer of funds has a negative and significantly impact on revenue.
Furthermore Wakano, Bokiu, and Pakaya (2013) conducted a study to determine which factors are the most dominant influence on Local Own-Source Revenue in Gorontalo Province. They found that the contribution from 15 factors observed amounted to 96.26%, and the GDP factor groups has contributed 16.15% of the effectiveness of Local OwnSource Revenue. From these studies it can be concluded that the GDP has a positive effect on revenue in accordance with the theory of Peacock and Wiseman. However, research conducted by Naz’aina (2013) provides a different conclusion to the theory, namely economic growth and no significant impact on revenue in North Aceh District during 2000-2010.
Due to the relatively high dependency of local government on the central government and the difficulty in optimizing the local resources, this study aims to determine the effect of capital expenditure to regional gross domestic product of Districts/Cities in East Java and determine the influence of regional
gross domestic product to local revenue of Districts/Cities in East Java. In addition, it aims to determine the indirect effect of capital expenditure to local revenue through the regional gross domestic product of Districts/ Cities in East Java.
METHODS AND MATERIALS
This study employed local governments of the entire Districts/Cities in East Java by utilizing saturated sampling. The samples were 29 districts and 9 cities, bringing the total to 38 Districts/Cities during the studied period of 5 years in 2009-2013. Data analysis method used in this research was path analysis. Lantan and Ghozali (2012) stated that if a model is formed by using intervening or moderating variables, in which the variables are observed variables, then the appropriate analytical technique to accomplish this is to use path analysis.
Path analysis is able to identify the direct and indirect effect between variables in a model. The direct effect of exogenous variables on endogenous variables can be measured by looking at the standardized path coefficient, while the magnitude of the effect is not directly obtained in the path analysis but it is calculated by multiplying the path coefficient of the direct influence of exogenous variables on endogenous variables (Riduwan and Kuncoro, 2014).
Figure 2. Operational Path Diagram Model 1
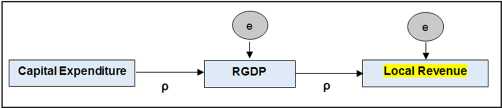
Source: illustration, 2015
It is assumed that capital expenditure can be classified into (1) less productive capital expenditure (LPCE) consisting of land expenditure, expenditures on equipment and machinery, and other fixed asset expenditures, and (2) productive capital expenditure (PCE) which consists of capital expenditures on buildings and structures and capital expenditures on road, irrigation and transportation/transmission network.
The classification of capital expenditures on buildings and structures and capital expenditures on road, irrigation and network as productive capital expenditures is based on the assumption that they are mainly used for public services particularly for the development of infrastructure that serves as the engine driving of the real sector. On the other hand, the less productive capital expenditures are classified based on the assumption that those three expenditures are mostly utilized by regional apparatus. Thus, based on the above path diagram model 2, the path diagram is further developed as follows:
Figure 3. Operational Path Diagram Model 2
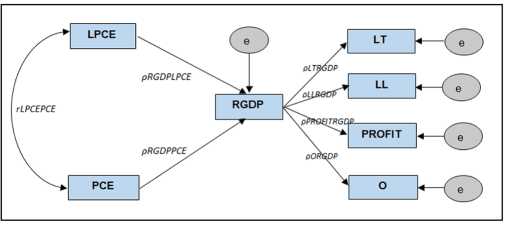
Source: illustration, 2015
Notes: CE= Capital Expenditure; LPCE= Less Productive Capital Expenditure; PCE= Productive Capital Expenditure; RGDP= Regional Gross Domestic Product; LR= Local Revenue; LT= Local Tax; LL= Local Levy; PROFIT= Result of separated regional asset management; O= other legal local revenue; e= residual; ρ= path coefficient;
r= correlation.
FINDINGS
Before we conduct statistical analysis, the first step is to check the linearity test. Linearity test is required for determining the linearity of the relationship between exogenous variable and endogenous variable. The results of linearity test on model 1 and model 2 showed that all relationships of exogenous variables and endogenous variables generated probability (sig.) < level of significance (α=5%). Thus, it can be stated that the relationship of CE to RGDP, PCE to RGDP, RGDP to LT, RGDP to LL, RGDP to PROFIT, and RGDP to O is a linear relationship. Path diagram converted to a measurement model is intended to determine the degree of the direct or indirect
effect on a model.
Figure 4. Conversion of Path Diagram Model 1
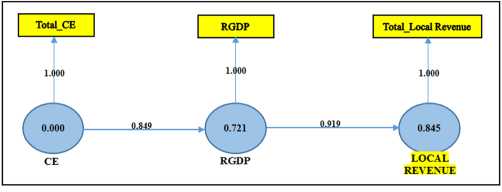
Source: Outputs of SmartPLS 2.0, 2015 (data processed)
The results of path analysis of the first model showed that capital expenditure significantly and positively affects on Regional Gross Domestic Product (RGDP), meaning that the greater capital expenditure will increase RGDP. The effect of capital expenditure on RGDP was 0.849. It indicated that capital expenditure of local government at Districts/ Cities in East Java was determined based on allocative efficiency principle in fiscal federalism theory so that it can effectively increase RGDP. This finding is in line with the results obtained by Aschauer (1989) and Munnell and Cook (1990) which revealed that government’s capital expenditure positively and significantly affects the output of goods and services.
The positive relationship between capital expenditure and RGDP indicates the conformity with the classical and neoclassical growth theory which states that the accumulation of capital is one of the factors for increasing the output of goods and services of a region (Arsyad, 2004). The findings of this study also support Keynes’s hypothesis which states that in short term, the increase in government expenditure leads to an increase in the revenue and the output of goods and services in a greater number because government expenditure has a multiplier effect (Mankiw, 2007).
The results of path analysis of the first model showed that Regional Gross Domestic Product (RGDP) positively and significantly affects local own-source revenue which means that the higher RGDP, the higher the local own-
Figure 5. Conversion of Path Diagram Model 2
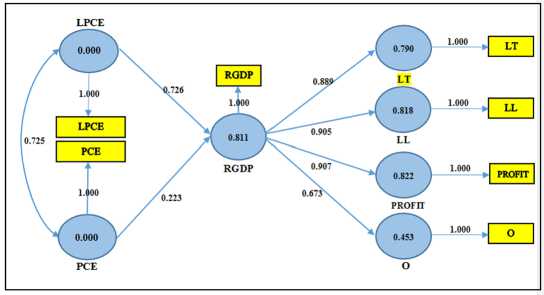
Source: Output of SmartPLS 2.0, 2015 (data processed)
source revenue is. The result showed that the effect of RGDP to local own-source revenue was 0.919. It indicated that increasing RGDP is one of the effective steps for increasing the local own-source revenue of Districts/ Cities in East Java. These findings support the research findings revealed by Santosa and Rahayu (2005), Basri (2009), and Wakano, Bokiu, dan Pakaya (2013) which proved that RGDP has a positive and significant effect on local own-source revenue.
The positive relationship between RGDP and local own-source revenue supports Peacock and Wiseman theory which states that under normal circumstances and fixed tax rate, the increasing RGDP can lead to the increase in regional own-source revenue (Mangkoesoebroto, 2013). The findings of this study are also in line with Suparmoko (2001) and Saragih (2003) who asserted that the increased local own-source revenue is actually the excess of the increased RGDP.
The next result of the path analysis of the first model indicated indirect and positive effect of capital expenditure on Local OwnSource Revenue through Regional Gross Domestic Product (RGDP) which means that the increasing RGDP due to the higher capital expenditure will increase local revenue. The indirect effect of capital expenditure on local own-source revenue through RGDP was 0.781. It showed that capital expenditure of Districts/Cities in East Java is either effective in increasing RGDP or local own-source revenue of Districts/Cities. These findings support the findings revealed by Adi (2006)
which evidenced the indirect influence of the increased local revenue through the rate of RGDP.
The results of the second model of path analysis indicated that less productive capital expenditure and productive capital expenditure have positive and significant effect on RGDP. However, the effect of less productive capital expenditure is more dominant than of the productive capital expenditure since productive capital expenditure in the fourth quarter was higher than less productive capital expenditure so that productive capital expenditure was not able to optimally contribute to the increased RGDP in the current year.
Government expenditure is government consumption which serves as a stimulus of economic activity development. The earlier procurement of goods/public services especially financed by productive capital expenditure will generate greater benefits and stronger effect of the stimulus in the current year. According to World Bank, developing countries including Indonesia have problems in budget absorption called as slow backloaded, meaning that there is a low absorption at the beginning to the middle of the budget year, but jumping at the end of the fiscal year (BPKP, 2011). At least, there are four main factors which affect the accumulation of regional capital expenditure at the end of the fiscal year, such as planning and budgeting, Human Resources (HR), rules and processes of procurement of goods/services, as well as the establishment of the technical guidelines
of Specific Allocation Fund (Muchsin and Noor, 2011; DJPK, 2013).
The following are the facts showing the realization of less productive capital expenditure and productive capital expenditure in Districts of Banyuwangi, Gresik, Jember, Malang, Sidoarjo, Malang City, and Surabaya City in fourth quarter of 2013 in which those Districts/Cities had the highest capital expenditure in 2013 with the total of capital expenditure of 39% of the total capital expenditure of all Districts/Cities in East Java.
Figure 6. Less Productive Capital Expenditure (LPCE)andProductiveCapitalExpenditure (PCE) in the Quarter I-III and Quarter
IV of 2013 in Seven Districts/Cities in East Java Province with the Highest
Capital Expenditure (CE)
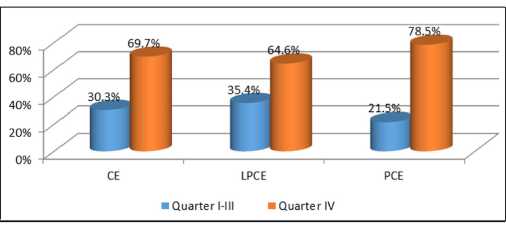
Source: DJPK Ministry of Finance, 2015 (data processed)
Figure 6 above showed that more than 78 percent of productive capital expenditure in the seven Districts/Cities occurred in the fourth quarter meaning that most of the productive capital expenditure is only able to boost RGDP by the end of the year (October-December) for the current year. Because the capital expenditure is considered as an investment then thrust to the increased RGDP may occur both in the short term and long term, so that the possibility of an optimal increase in RGDP as a result of productive capital expenditure occurs in the following year.
The results of path analysis on both models also showed that RGDP has a positive and significant impact on local tax and levy, the results of separated regional asset management, and other legitimate local ownsource revenues. RGDP has a less powerful
effect on other legitimate local revenues when compared with the effect of RGDP on local tax, levy, and the results of the separated regional asset management. It is because some components of other legitimate local revenues are not directly related to RGDP, for example, the sale of regional assets that are not separated, acceptance of claims for compensation areas, income obtained from penalties due to the late execution of the work, and the income generated by guarantee execution.
Then the results of the other two models of path analysis in this study indicated that there is a positive indirect effect of less productive capital expenditure and productive capital expenditure on local tax, local levy, results of separated local asset management, and other legitimate local revenues through RGDP.
CONCLUSION
This study aims to determine the effect of capital expenditure on Regional Gross Domestic Product (RGDP) and its impact on Local Own-Source Revenue of Districts/Cities in East Java province. Based on the analysis and discussion that has been described previously, some conclusions can be drawn. First, capital expenditure affects Regional Gross Domestic Product (RGDP) and effectively increases Local Own-Source Revenue through RGDP. Second, less productive capital expenditures (land, equipment and machinery, other fixed assets) and productive capital expenditures (building and structure, road, irrigation and transportation/transmission network) affect RGDP and the four forming components of revenue (tax, levy, result of separated local asset management, and other legitimate local revenues) through RGDP, but the effect of less productive capital expenditure is stronger than the effect of productive capital expenditure because the higher productive capital expenditure occurred in the fourth quarter. Third, RGDP affects local revenue and the four forming components of local ownsource revenue (local tax, levy, the result of separated local asset management, and other legitimate local revenues), but the effect of
RGDP on the other legitimate local revenues is not as strong as the effect of RGDP on local tax, levy, and the result of the separated local asset management. This might be due to some other legitimate forming components of local revenue which are not directly related to the level of RGDP.
This study has several limitations making it possible for further development of the next research. First, this study divided capital expenditure by type which was further classified into less productive capital expenditure and productive capital expenditure so that it is suggested for the next research to certainly sorting the capital expenditure employed for public services and local apparatus. Second, this study merely analyzed the effect of capital expenditure in the current year (t) on RGDP of the current year (t). Because capital expenditure is a kind of investment, further research on the effect of capital expenditure of the previous year (t-1) on RGDP of the current year (t) needs to conducted in the long term.
REFERENCES
Arsyad, Lincolin. 2004. Ekonomi Pembangunan, Edisi Keempat. Bagian Penerbitan STIE YKPN. Yogyakarta.
Aschauer, D. Alan. 1989. Is Public Expenditure Productive. Journal of Monetary Economics, Vol. 23, pp. 177200.
Bahl, Roy W. and Johannes F. Linn. 1992. Urban Public Finance in Developing Countries. Oxford University Press., USA.
Bappenas. 2003. Peta Kemampuan
Keuangan Propinsi Dalam Era Otonomi Daerah: Tinjauan Atas Kinerja PAD dan Upaya yang Dilakukan Daerah.
Direktorat Pengembangan Otonomi Daerah. Jakarta.
Basri, Syafril. 2009. Pengaruh Output Daerah, Penerimaan Transfer, dan Desentralisasi Fiskal terhadap PAD Kota Pekanbaru.
Jurnal Ekonomi Unri, Vol. 17, No. 1.
Bird, Richard M. 1993. Threading the
Fiscal Labyrinth: Some Issues in Fiscal Decentralization. National Tax Journal,
Vol. 46, No. 2, (June, 1993), pp. 207-227.
BPKP Perwakilan DIY. 2011. Menyoal Penyerapan Anggaran. Paris Review, Edisi Desember. Yogyakarta.
DJPK Kementerian Keuangan RI. 2013. Deskripsi dan Analisis APBD 2013. Direktorat Evaluasi Pendanaan dan Informasi Keuangan Daerah. Jakarta.
DJPK Kementerian Keuangan RI. 2013. Laporan Evaluasi Belanja Modal Daerah. Direktorat Evaluasi Pendanaan dan Informasi Keuangan Daerah. Jakarta.
Gunantara, P.C. dan A.A.N.B. Dwirandra.
2014. Pengaruh PAD dan DAU pada Pertumbuhan Ekonomi dengan Belanja Modal sebagai Variabel Pemoderasi di Bali. Jurnal Akuntansi Unud, Vol. 7, No. 3, h. 529-546.
Hayek, Friedrich. 1945. The Use of Knowledge in Society. The American Economic Review, Vol. 35, No. 4, (Sep.,1945), pp. 519-530.
Jin, Hehui, Yingyi Qian, and Barry R. Weingast. 2005. Regional Decentralization and Fiscal Incentives: Federalism, Chinese Style. Journal of Public Economics, Vol. 89, (Sept., 2005), pp. 1719-1742.
Khusaini, Mohammad. 2006. Ekonomi Publik: Desentralisasi Fiskal dan Pembangunan Daerah. BPFE Unibraw. Malang.
Kuncoro, Mudrajad. 2004. Otonomi dan Pembangunan Daerah: Reformasi, Perencanaan, Strategi, dan Peluang. Penerbit Erlangga. Jakarta.
Kusuma, Hendra. (2016). Desentralisasi Fiskal dan Pertumbuhan Ekonomi di Indonesia. Jurnal Ekonomi Kuantitatif Terapan. Volume 9 (1). Available at: https://ojs.unud.ac.id/index.php/jekt/ article/view/22735.
Latan, H. dan Imam Ghozali. 2012. Konsep, Teknik dan Aplikasi SmartPLS 2.0 M3 untuk Penelitian Empiris. Badan Penerbit Universitas Diponegoro. Semarang.
Mangkoesoebroto, Guritno. 2013.
Ekonomi Publik, Edisi Ketiga. BPFE UGM. Yogyakarta.
Mankiw, N. Gregory. 2007. Macroeconomics, 6th Edition. Fitria Liza dan Imam
Nurmawan (penerjemah). Makroekonomi, Edisi Keenam. Penerbit Erlangga. Jakarta.
Mardiasmo. 2002. Otonomi dan
Manajemen Keuangan Daerah.
Penerbit ANDI. Yogyakarta.
Muchsin, M. dan A.S. Noor. 2011. Fenomena Penyerapan Anggaran: Kenapa Akselerasi di Akhir Tahun. Paris Review, Edisi Desember. Yogyakarta.
Munnell, Alicia H. and L.M. Cook. 1990. How Does Public Infrastructure Affect Regional Economic Performance. New England Economic Review, Vol. 34, pp. 69-112.
Naz’aina. 2013. Analisis Hubungan Antara Pertumbuhan Ekonomi Daerah, Belanja Pembangunan Daerah, dan PAD Kabupaten Aceh Utara. Pekbis Jurnal, Vol. 5, No. 1, (Mar., 2013), h. 24-32.
Oates, Wallace E. 1993. Fiscal Decentralization and Economic Development. The National Tax Journal, Vol. 46, No. 2, (Jun.,1993), pp. 237-243.
Republik Indonesia, Peraturan Menteri Dalam Negeri Nomor 13 Tahun 2006 tentang Pedoman Pengelolaan Keuangan Daerah, sebagaimana telah diubah dengan Peraturan Menteri Dalam Negeri Nomor 59 Tahun 2007 dan Peraturan Menteri Dalam Negeri Nomor 21 Tahun 2011.
----------, Peraturan Pemerintah Nomor 71 Tahun 2010 tentang Standar Akuntansi Pemerintahan.
----------, Undang-Undang Nomor 28 Tahun 2009 tentang Pajak Daerah dan Retribusi Daerah.
----------, Undang-Undang Nomor 32 Tahun 2004 tentang Pemerintahan Daerah.
----------, Undang-Undang Nomor 33 Tahun 2004 tentang Perimbangan Keuangan Antara Pemerintah Pusat dan Pemerintahan Daerah.
Riduwan dan Engkos A. Kuncoro. 2014. Cara Menggunakan dan Memakai Path Analysis (Analisis Jalur).
Penerbit Alfabeta. Bandung.
Santosa, P.B. dan R.P. Rahayu. 2005.
Analisis PAD dan Faktor-Faktor yang Mempengaruhinya dalam
Upaya Pelaksanaan Otonomi Daerah di Kabupaten Kediri. Jurnal Dinamika Pembangunan, Vol. 2, No. 1, h. 9-18.
Saragih, J. Panglima. 2003. Desentralisasi Fiskal dan Keuangan Daerah dalam Otonomi. Penerbit Ghalia Indonesia. Jakarta.
Setiyawati, A. dan A. Hamzah. 2007. Analisis Pengaruh PAD, DAU, DAK, dan Belanja Pembangunan Terhadap Pertumbuhan Ekonomi, Kemiskinan, dan Pengangguran: Pendekatan Analisis Jalur. Jurnal Akuntansi dan Keuangan Indonesia, Vol. 4, No. 2, h.211-228.
Sidik, Machfud. 2002. Optimalisasi Pajak Daerah dan Retribusi Daerah Dalam Rangka Meningkatkan Kemampuan Keuangan Daerah. Orasi Ilmiah Wisuda Angkatan XXI STIA LAN Bandung Tahun Akademik 2001/2002. Bandung.
Sudantoko, Djoko. 2003. Dilema Otonomi Daerah. Penerbit ANDI. Yogyakarta.
Suparmoko, M. 2001. Ekonomi Publik untuk Keuangan dan Pembangunan Daerah. Penerbit ANDI. Yogyakarta.
Tiebout, C.M. 1956. A Pure Theory of Local Expenditures. The Journal of Political Economy, Vol. 64, No. 5, (Oct.,1956), pp. 416-424.
Todaro, Michael P. dan Stephen C. Smith. 2004. Economic Development, 8th Edition. Haris Munandar dan Puji A.L. (penerjemah). Pembangunan Ekonomi di Dunia Ketiga, Edisi Kedelapan. Penerbit Erlangga. Jakarta.
Wakano, S.M., Z. Bokiu, dan L. Pakaya. 2013. Analisis Faktor-Faktor yang Mempengaruhi Efektivitas PAD Pemerintah Kota Gorontalo. Jurnal KIM Fak. Ekonomi dan Bisnis UNG, Vol. 1, No. 1.
144
Discussion and feedback