Helpdesk Ticketing Information System Based on Android at Communication and Information Department of Badung Regency
on
Journal of Electrical, Electronics and Informatics, Vol. 5 No. 2
41
Helpdesk Ticketing Information System Based on Android at Communication and Information Department of Badung Regency
Dewi Ayu Sulistyo Damayanti1, I Made Arsa Suyadnya2, and Duman Care Khrisne3
-
1,2,3Department of Electrical Engineering, Faculty of Engineering, Udayana University, Bukit Jimbaran
Bali, Indonesia
Abstract In the operational activities of Diskominfo at Badung Regency, there are often reports of service problems every day. Currently, the reporting of these problems is still done in person via telephone or short message, which affects the speed of handling the report. The complaint system is a solution to problems related to reporting and handling of these service problems. In this study, a mobile application-based complaint system will be developed for the client-side to make it easier for clients to report or respond to reports and for the server-side, it will be developed on a web-based basis to still facilitate the management of complaint data. This study uses Data Flow Diagrams to model the process and Entity Relationship Diagrams to model its database. The evaluation process is carried out using the black box testing method and usability evaluation using SEQ and SUS. The system that has been successfully developed is able to carry out the main processes related to adding reports, viewing report progress, verifying reports, following up on reports, and changing report status. Testing using the black box testing method on 7 test classes with 74 test scenarios to get 74 valid test scenarios. Testing the installation and use of applications on 3 types of smartphones has also been successfully carried out without any problems. Usability testing on users using SEQ gets a middle value of 6 (for Administrator and IT Staff) and 7 (for Verification), which shows that the application developed is easy to use by the user, with the results of the SUS the questionnaire, the user shows that the application is in the Excellent class with an average value obtained from 15 respondents of 80.5.
Index Terms— development, information systems, mobile, ticketing.
-
I. Introduction1
The rapid development of ICT will open up opportunities and challenges to create, access, process, and utilize information appropriately and accurately. Information is a very valuable commodity in the era of globalization to be controlled to improve the competitiveness of an organization (including local governments) sustainably. Responding to this challenge, the Regional Government of Badung Regency through the Communication and Information Technology Office has made a policy of utilizing ICT to build an integrated Electronic Government for Good Governance and is used in government systems starting from the lowest level, namely sub-districts / villages to the district center. Diskominfo Badung Regency has successfully developed several integrated systems or services, including e-Monev, e-Musrembang, e-Planning, the provision of free WiFi services, and the e-Kinerja system.
In the operational activities of using the system or service, problems often occur such as bugs in the system, dead WiFi routers, or human errors when entering data into the system. Reporting problems with the Diskominfo service is currently still carried out directly via telephone or short message via chat applications such as Whatsapp or Telegram to the Diskominfo team. As a result, there is no record of every incoming report which affects the speed of handling the report by the Diskominfo team because it cannot make a schedule for handling and the progress of handling each report. So we need a system that records every service report, the progress of handling, and the final solution of any existing problems as documentation material for future service or system improvements.
The complaint system (helpdesk) is a solution to problems related to reporting and handling problems with the Diskominfo service in Badung Regency. The development of a compliant system (helpdesk) has been done a lot, Darmawan (2007) implements a helpdesk application system so that handling user complaints becomes more efficient, controlled, and integrated [1]. The complaint system has also been developed by Sipayung (2017) by
examining a service complaint system with a single point of contact concept that can facilitate monitoring of activities from start to finish [2]. The complaint system is also required to have a number that is termed ticketing. Ticketing is a code number used in an organization to detect, report, and solve several problems [3]. Ticketing will help customer support in accommodating customer needs such as requests, questions, or certain complaints so that the settlement process is easier to trace [4].
In the research that has been done, the implementation of system is web-based from the client and administrator side. The popularity of web-based system is increasingly being eroded by system that are already mobile-based. Mobilebased system allow people to obtain or disseminate information more quickly and in real-time, this is the main reason for the rapid development of mobile-based system. In this research, the complaint system (helpdesk) has collaborated with ticketing which is built on a mobile basis for the client-side, and for the server-side it will be developed on a web-based.
The complaint information system (helpdesk) has been successfully developed as a system that can clarify any issues that are complained of. Clarification is made into a priority level that is adjusted by the profile matching method based on the position and division according to the existing value chain in the organization [2]. The complaint information system (helpdesk) has also been successfully developed by using 3 levels of user access, namely operators, consumers, and administrators. The information system that has been successfully built provides management of technician performance data for the IT Helpdesk management where the division of work between one technician and another technician is the same on their respective workloads, so that problem solving is faster and evenly between technicians [5].
Data Flow Diagram (DFD) is a diagram that uses symbols to present entities, processes, data flows, and data storage associated with a system. Table I is the symbols used in modeling DFD [6].
TABLE I
DFD SYMBOLS
|
Name |
Symbol | ||
|
External entity | |||
|
Process | |||
|
Data Store | |||
|
Data Flow |
---------► | ||
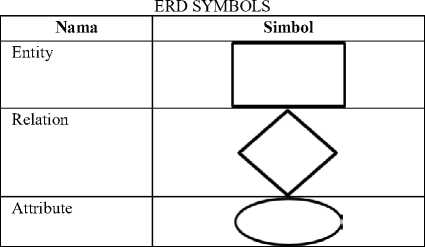
Entity Relationship Diagram (ERD) is a data model that uses several notations to describe data from entities and their relationships described by the data. Some of the components of ERD are described in Table II [7].
TABLE II
Black-Box testing is a test that is carried out only observing the results of execution through test data and checking the functionality of the software. This method is used to find out whether the system is functioning as expected. Software testing has several levels, for testing using the Black-Box method, there are six levels, namely Integration, Functional, System, Acceptance, Beta, and Regression [8].
Single Ease Question (SEQ) is one of the testing methods used to measure the ease felt by the user after completing all the given scenarios [9]. The SEQ consists of one question on a Likert scale of 1 to 7 of the choices: Very Hard, Hard, Not Easy, Enough, Not Difficult, Easy, and Very Easy such as Fig 1.
Very Difficult Very Easy
1 2 3 4 5 6 7
Fig. 1. SEQ rating scale
The System Usability Scale (SUS) according to Brooke (1996) is a user test method that provides a reliable and "quick and dirty" measuring tool. Applied using 10 questions in the form of a questionnaire followed by 5 answer options for each question, ranging from strongly agree to strongly disagree. Item System Usability Scale (SUS) can be seen in Fig 2 [10].
System Usability Scale
O Digital Equpmanf Corporation, 1986
-
1 .1 think that I would like to us* th⅛ sy*l∙m frequently
-
2 . I found the system Unnecessonty
I ∣ ∙>ll :i .
-
3 I thought the system wits easy to uβo
-
4 I think that I would need the support of a technical person to be able to uno this system
-
5 I found tho various functions In this system wore well integrated
β I thought Ittere was too much inconsistency in this system
-
7 I would imagine that most people would learn to use this system very quickly
-
8 . I found the system very cumbersome to use
-
9.1 felt very confident using the system '
10 I needed to Ioarn Blotot things before I could get going with this system
Strongfy Strongly
Cftsoqree agree
Fig. 2. System Usability Scale
SUS measurement is done by adding up the scores of each item. The score for each item is in the range 0 to 4. For items number 1, 3, 5, 7, and 9 (odd items) the item score is the result of user ratings for the item minus one. While items 2, 4, 6, 8, and 10 (even items) the item score is the result of 5 (five) minus the value of the user for that item. The total score of 10 items is then multiplied by the number 2.5 to produce the final score in the range 0 - 100. For more details, see Fig 3.
SiSs eeaaateaιι^Mκa∣3∣ιιιιι≈≈i!m
SS I F IDlClB l_A_l
ADJECTIVE WORST _. BEST
RATWGS IMAGINABLE p∞* 0κ ∞∞ EXCELLENT ig^y^f
I > I > I H ■ h ■ 11. I l i L i i I . i
O 10 20 30 40 50 60 70 80 90 100
SUS Score
Fig. 3. Rating and conversion scale of SUS mean score
This research was conducted at the Office of Communication and Informatics of Badung Regency which is located in the Government Center of Badung Regency "Mangupraja Mandala", Jl. Raya Sempidi, Mengwi, Badung Regency. When this research was conducted in May 2019 to July 2019. The stages of the research "Helpdesk Ticketing Information System Based on Android Mobile at the Communication and Informatics Office of Badung Regency" which will be carried out from problem identification to drawing the final conclusion is described in Fig 4 with the following explanation.
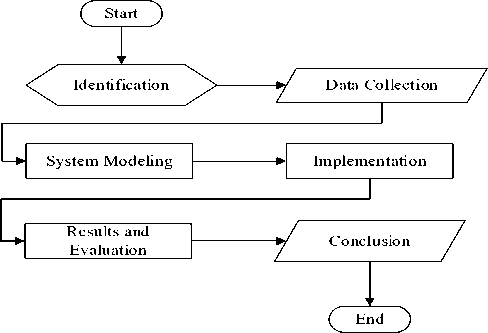
Fig. 4. Research Flow Diagram
The explanation of the flow chart in Fig 4 is as follows.
-
1. Identification, identify problems with Diskominfo Badung Regency.
-
2. Data Collection, at this stage references, will be collected from Diskominfo Badung Regency regarding the services provided.
-
3. System modeling, using Data Flow Diagram modeling and Entity Relationship Diagram.
-
4. Implementation, the system implementation process is carried out in 2 stages, namely the implementation of the back-end system using the Laravel framework and implementing the application using Android Studio.
-
5. Results and evaluation process is carried out using the black box testing method and evaluating the level of conformity with application functionality requirements.
-
6. Conclusion, taken from the results of testing and evaluation of the system that has been done.
This system overview illustrates how the helpdesk system flow will be built in general. Fig 5 shows how the reporting and response process by the IT team at Diskominfo Badung Regency.
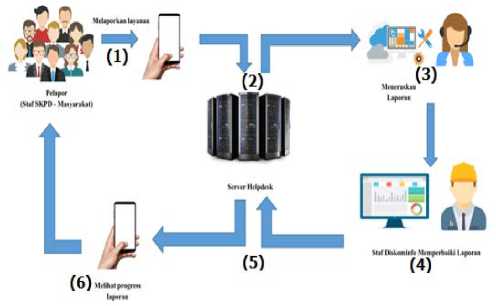
Fig. 5. System Overview
Based on Fig 5, the helpdesk system that is built will focus on the interaction between 3 user levels, namely Reporters, Verifiers, and Kominfo Staff, as follows.
1. The reporter uses the application to input his report data.
-
2. The report will be stored on the main server and then accepted by the verifier.
-
3. The verification then forwards the report to the relevant staff.
-
4. The report is then received by the Diskominfo staff and will then carry out the process of analyzing reports, correcting and providing responses to the reports
received.
-
5. The response given by Diskominfo staff will be stored on the server to be sent to the reporter.
-
6. The reporter then checks the report until he feels that there is no problem or can see the progress of the report.
Info login admin
Data login
Data login
user
1
Data login admin
kategori
Data kategori
Data kategori
Info login pelapor Data login pelapor
Login
Info tiket
Info login staf IT
Data login staf IT
4
Pelapor
Data tiket
Data komentar
Q u)
S n Q
Administrator
Data staf IT
Laporan kinerja staf IT
status
role
user
Info user
Mengelola data kategori
Info komentar
Info login verifikator
> Data status
Data status —■
_________________f 3
Data login verifikator
Data user
Laporan riwayat tiket
Data laporan
Fig. 6. Lv 0 Data Flow Diagram
Mengelola data status
Data role
2
Mengelola data user
6
tiket
komentar
Data tiket
Data tiket
Data komentar
Data komentar
5
log ♦
file -
status
kategori
Data tiket
Info tiket
Data log
Data file
Data status
Kelola Data Tiket
Data kategori
Data tiket
tiket
«— Data status status
Melihat L— Data kategori
laporan tiket
7
kategori
Data tiket tiket
Melihat
laporan L— Data user
kinerja
user
<— Data komentar
Data tiket
Info tiket
Info komentar
Data tiket
Info tiket
Staf IT
Verifikator
DFD level 0 (Fig 6) is a solution to the context diagram which describes in more detail the system processes, related entities, data, and data stores involved in every process in the system. As for the processes contained in the system are divided into 4 main processes, namely:
-
1. The login process is a user verification process to be able to access the system.
-
2. User Data Management Process is the process of managing system user data.
-
3. Process of Manage Status Data is the process of managing ticket status data.
-
4. Process Category Data Management is the process of managing ticket category data.
-
5. Ticket Data Management Process is a process of managing data related to ticket reporting on problems with the Diskominfo service in Badung Regency. The ticket data in question is ticket data, ticket file data, comment data, and ticket log data.
-
6. The process of viewing ticket reports is a process for viewing the history of reports recorded in the system.
-
7. The Process of Viewing Performance Reports is the process of seeing the history of the performance of IT staff in completing reports.
Entity Relationship Diagram is a diagram that describes the relationship between two or more entities that make up the system. Fig 7 is an ERD System with entities, attributes and relationships between entities depicted by the Peter Chen model.
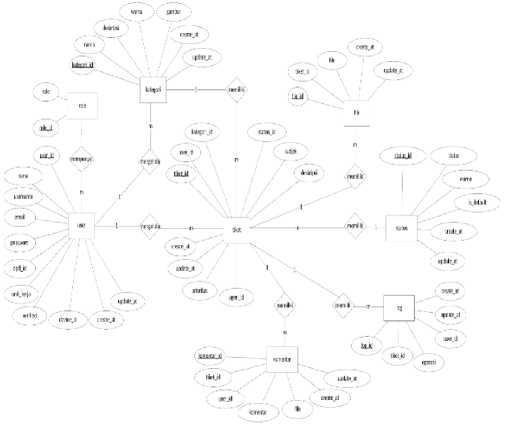
Fig. 7. ERD System
This Helpdesk Ticketing application runs on 2 platforms, namely web and mobile. Applications tend to be used for verifiers who are actively monitoring every incoming
complaint ticket for 24 hours. The mobile application is
used by officers to make it easier to handle directly in the field.
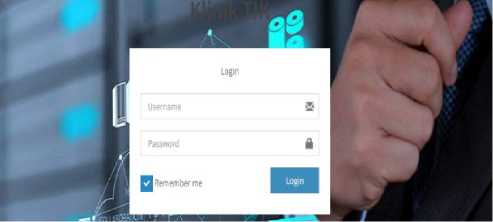
Fig. 8. Administrator login page
On this login page, administrators who want to access the
system must input the username and password for each administrator as shown in Fig 8.
Users can click on one of the tickets and the ticket details
page will appear as shown in Fig 9. There are 3 important parts to ticket details including report information and
pictures (a), follow-up history (b), and comments (c).
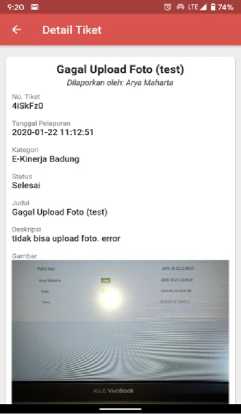
(a) Report Details
Fig. 9. Ticket Details
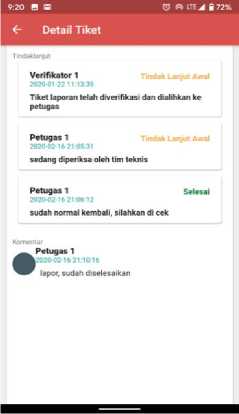
(b) Follow-up Details
Testing in this study uses the black box testing method, where black box testing focuses on functional needs. Based on the functional requirements, a test item table was created with the test results as shown in Table III.
TABLE III
BLACK BOX TESTING RESULTS
|
Testing Class |
Test Items |
Results |
|
Login |
a. Login |
VALID |
|
Managing Ticket Data |
|
VALID |
|
Managing Officer |
|
VALID |
|
Manage Category |
|
VALID |
|
Manage Status |
|
VALID |
|
Managing User |
|
VALID |
|
Reports |
a. View ticket reports b. View IT staff reports |
VALID |
Application installation testing is the process of testing whether the application can be installed on smartphones of different specifications. Table IV shows the results of the installation test on the three different smartphones.
TABLE IV
APPLICATION INSTALLATION RESULTS
|
Brand |
Output |
Results |
Status |
|
Xiaomi mi A1 |
Applications can be installed on smartphone devices |
The application installed without any problems |
VALID |
|
Samsun g S9 |
Applications can be installed on smartphone devices |
The application installed without any problems |
VALID |
|
Oppo A39 |
Applications can be installed on smartphone devices |
The application installed without any problems |
VALID |
Testing application usage is the process of testing whether the application can run properly after installed. Table V shows the results of testing the use of the application.
TABLE V
APPLICATION USAGE RESULTS
|
Features |
Test Scenario |
Status |
|
Login |
The user enters his account data and then clicks the login button |
VALID |
|
Register |
The user fills in the data himself then clicks the register button |
VALID |
|
Adding a ticket |
The user fills in the ticket data and presses the save button |
VALID |
|
View ticket details |
The user clicks on one of the ticket data in the ticket list |
VALID |
|
Verifying tickets |
The user clicks the verification button on the ticket |
VALID |
|
Forward ticket |
The user enters the officer data and clicks the save button |
VALID |
|
Add comments |
The user enters the comment data and presses the save button |
VALID |
|
Follow-up ticket |
The user fills in the follow-up data and clicks the save button |
VALID |
This study uses the System Usability Scale (SUS) test package to measure the usability of the application design and the Single Ease Question (SEQ) to measure the level of ease of each application design function being developed.
Features that have been implemented successfully will be asked to perform several tasks to see the convenience of the user. This SEQ test is to test the convenience of Admin, Officer and Verifier users. The tasks carried out by users are as shown in Table VI. After completing the task, the respondent will provide an assessment of the entire task.
Recapitulation of test results through work on tasks by 15 respondents, which is divided into 3 users (Admin, Officer, and Verifier) as shown in the table in Table VII.
TABLE VI
SEQ EVALUATION TASKS
|
No. |
Features |
Task |
|
1 |
Login |
Enter username and password to login |
|
2 |
Manage Ticket Data |
Enter the ticket data to be reported |
|
3 |
Manage Officer Data |
Enter the data of the officer who received the ticket |
|
4 |
Manage Category Data |
Enter new ticket category data into the system |
|
5 |
Manage Status Data |
Select status data and perform status deletion |
|
6 |
Manage User Data |
Select a user and view detailed data |
|
7 |
Reports |
Enter ticket data to view follow-up reports |
TABLE VII
SEQ TESTING RESULTS
|
Respondents |
Tasks |
Median | ||||||
|
1 |
2 |
3 |
4 |
5 |
6 |
7 | ||
|
1 |
5 |
7 |
6 |
7 |
6 |
7 |
7 |
7 |
|
2 |
6 |
5 |
7 |
7 |
6 |
7 |
6 |
6 |
|
3 |
6 |
5 |
5 |
7 |
5 |
5 |
5 |
5 |
|
4 |
7 |
5 |
5 |
5 |
6 |
6 |
6 |
6 |
|
5 |
7 |
7 |
7 |
5 |
5 |
7 |
7 |
7 |
|
Median |
6 | |||||||
|
6 |
5 |
6 |
5 |
6 |
7 |
5 |
5 |
5 |
|
7 |
7 |
7 |
6 |
5 |
6 |
6 |
5 |
6 |
|
8 |
5 |
6 |
6 |
5 |
7 |
7 |
6 |
6 |
|
9 |
6 |
5 |
6 |
7 |
6 |
7 |
6 |
6 |
|
10 |
7 |
5 |
5 |
7 |
7 |
7 |
7 |
7 |
|
Median |
6 | |||||||
|
11 |
7 |
7 |
6 |
5 |
7 |
7 |
6 |
7 |
|
12 |
6 |
7 |
7 |
7 |
5 |
6 |
6 |
6 |
|
13 |
7 |
7 |
7 |
6 |
6 |
7 |
5 |
7 |
|
14 |
6 |
6 |
7 |
6 |
5 |
6 |
5 |
6 |
|
15 |
7 |
7 |
7 |
6 |
5 |
5 |
7 |
7 |
|
Median |
7 | |||||||
TABLE VIII
USABILITY TESTING DATA
|
Respondent |
Statements |
Average | |||||||||
|
1 |
2 |
3 |
4 |
5 |
6 |
7 |
8 |
9 |
10 | ||
|
1 |
4 |
1 |
4 |
2 |
3 |
4 |
4 |
4 |
4 |
4 |
80,5 |
|
2 |
3 |
4 |
3 |
4 |
4 |
3 |
3 |
4 |
3 |
4 | |
|
3 |
4 |
2 |
2 |
1 |
3 |
3 |
4 |
4 |
3 |
2 | |
|
4 |
3 |
1 |
4 |
2 |
4 |
4 |
4 |
3 |
4 |
4 | |
|
5 |
4 |
2 |
4 |
3 |
3 |
4 |
4 |
4 |
3 |
4 | |
|
6 |
4 |
2 |
2 |
2 |
2 |
3 |
3 |
4 |
2 |
3 | |
|
7 |
4 |
3 |
3 |
4 |
2 |
3 |
3 |
3 |
3 |
2 | |
|
8 |
3 |
4 |
3 |
2 |
2 |
3 |
4 |
4 |
4 |
4 | |
|
9 |
4 |
2 |
4 |
3 |
4 |
4 |
4 |
3 |
4 |
4 | |
|
10 |
4 |
2 |
3 |
3 |
4 |
4 |
2 |
2 |
3 |
3 | |
|
11 |
3 |
2 |
4 |
3 |
3 |
4 |
4 |
4 |
2 |
4 | |
|
12 |
2 |
3 |
3 |
4 |
3 |
3 |
2 |
4 |
3 |
4 | |
|
13 |
4 |
2 |
4 |
3 |
4 |
4 |
2 |
3 |
2 |
3 | |
|
14 |
4 |
1 |
4 |
2 |
2 |
3 |
4 |
4 |
4 |
4 | |
|
15 |
3 |
4 |
4 |
4 |
2 |
3 |
3 |
4 |
4 |
4 | |
The results of SEQ testing recapitulation on the ease of use of the helpdesk system for Admins and IT Officers show a value of 6 and the Verifier shows a value of 7 which means that the application that has been developed is easy to use. After the user carries out the assigned task, then
proceed with providing an assessment using the SUS questionnaire.
The results of usability testing through the SUS questionnaire were obtained from 15 respondents, which for this test was only for Reporters (community and agencies). The following is the raw data from the SUS method testing which is shown in Table VIII.
Based on the processed table data above, the final SUS value generated is 80.5. These results indicate that the system has a level of reusability above the average because it is above 70. Based on the SUS value, the Android-based Helpdesk Ticketing Application has a Grade Scale = B, Adjective Rating = Excellent.
The Helpdesk Ticketing Information System was developed to accommodate the needs of reporting side users, verifiers and IT staff developed on a mobile basis, and the administrator side was developed on a web-based. The system can run the process of adding tickets, viewing ticket details, verifying tickets, following up on tickets, changing tickets, and deleting tickets. Testing using the black box testing method on 7 test classes using 74 test scenarios to get 74 valid test scenarios. Testing of installation and use of applications on 3 types of smartphones has also been successfully carried out. Usability testing using SEQ gets a middle value of 6 (for Administrator and IT Staff) and 7 (for Verifiers) which indicates that the application developed is easy for users to use, with the results of the user SUS questionnaire showing
that the application belongs to the Excellent class with the average value obtained of 15 respondents of 80.5.
References
-
[1] Darmawan, D., dan Senjaya, W. (2017). “Sistem Aplikasi Helpdesk Online Berbasis Web Pada PT XYZ”. Jurnal Teknik dan Ilmu Komputer. Vol. 07 No. 25, Jan-Mar 2018.
-
[2] Sipayung, Evasaria M., Cut Fiarni dan Ernest Aditya. (2017). “Perancangan Sistem Informasi Helpdesk MenggunakanFramework ITIL V3” Jurnal Nasional Teknik Elektro dan Teknologi Informasi. ISSN 2301 – 4156. JNTETI, Vol. 6, No. 2, Mei 2017.
-
[3] Yurifatul, I. (2018). “Analisis Dan Perancangan Helpdesk Ticketing System Untuk Mengelola Tindak Perbaikan Perangkat Komputer Dan Jaringan Pada PT. Len Industri (Persero) Menggunakan Metodologi Pdca (Plan-Do-Check-Action)”. e-Proceeding of Engineering. Vol.5, No.3, 7149-7161.
-
[4] Rachmawati, U., Adam, S., dan Alwi, S. (2019). “Pembangunan Helpdesk Ticketing System Berbasis Web (Studi Kasus: Universitas Yarsi)”. Jurnal Teknologi Informasi YARSI. Vol 6, 19-24.
-
[5] Mustopa, Ali. (2017). “Sistem Informasi IT-Helpdesk Pada Universitas AMIKOM Yogyakarta Berbasis Web”. Jurnal Informatika dan Komputer. JIKO Vol. 2, No. 2, September 2017.
-
[6] Pressman, R. (2010). Software Engineering A Practitioner’s Approach (7 ed.). (F. Schilling, Penyunt.) New York, USA: The McGraw-Hill Companies, Inc.
-
[7] Bentley, Lonnie D dan Whitten, Jeffrey L. (2007). Systems Analysis and Design for the Global Enterprise, 7th Edition, International Edition. McGrawHill, New York.
-
[8] Williams, L. 2006. “Testing Overview and Black-Box Testing Techniques”. [ejournal]. Tersedia melalui : <
http://agile.csc.ncsu.edu/SEMaterials/BlackBox.pdf
-
[9] Sauro, J., & Lewis, J. R. (2012) Quantifying the User Experience: Practical Statistics for User Research. (S. Elliot, Ed.) (I). USA: Elsevier.
-
[10] Brooke, John. (1996). "SUS-A quick and dirty usability scale." Usability evaluation in industry 189, no. 194: 4-7.
Discussion and feedback