Damping Harmonic Distortion Using Active Filter with PID Control at Udayana University Faculty of Engineering Bukit Jimbaran
on
Journal of Electrical, Electronics and Informatics, Vol. 2 No. 2, August 2018
29
Damping Harmonic Distortion Using Active Filter with PID Control at Udayana University Faculty of Engineering Bukit Jimbaran
I Made Suartika1, Rukmi Sari Hartati2, and IBG. Manuaba3
-
1,2,3 Electrical Engeneering Departement, Faculty of Engeneering
Udayana University (UNUD) Badung, Bali, Indonesia madesuartika@unud.ac.id
Abstract Increased THD (Total Harmonics Distortion) in the utility, caused by the increasing operation of non-linear loads. High THD current (THDi) will affect the increase of power losses in the power system. In this study, THD analysis of the simulation results was performed according to IEEE 519-2014 standard on existing condition, shunt active filter operating condition and shunt active filter operating conditions with PID (proportional integral derivative) control, also analyzed losses before and after harmonic impact. The result of losses analysis on existing condition: losses phases R 3.38%, phase S 2.29%, phase T 3.33%. Total losses on existing condition 9.01%. Operation with active shunt filter is obtained losses for phase R 1.60%, phase S 2.46%, phase T 1.67%, so the total losses become 5.73%. While using the active filter with PID control for losses phase R 1.02%, phases S 0.89%, phases T 0.99%, so the total losses fell to 2.18%.
Index Terms— Harmonics, Losses, Non-linear loads, THDi, and PID
transmission wire, synchronous generator, system equipment protection and electric motors [1].
The use of power-based electronics equipment at Udayana University's Faculty of Engineering-Bukit Jimbaran, generates an electric current containing harmonics. The IEEE 519-2014 standard is the standard used as a limitation for analyzing THD. From the results of short-circuit ratios based on the IEEE 519 -2014 standard, the maximum THDi limit allowed on the transformer feeder is 8.0%, while the maximum THDv is 5.0%. THD measurement results show that THDi passes the standard that is more than 8%, while THDv already meets the specified standards.
The harmonic filter is a power electronics technology that can produce specific current components to reduce harmonic current, one of which is the active filter [2]. In its development, the use of active filters with various control methods has been widely studied, but there is still a lot of complexity in the control circuit. PID control method (Proportional Integral Derivative) is one solution to overcome the complexity of its control circuit. PID control method has a simpler design and does not require many
sensors. One of the advantages of the PID control method is that it has constant switching frequency modulation.
Based on this background, we will analyze the "Harmonic Distortion Damping Using Active Filter with PID Control at Faculty of Engineering Udayana University-Bukit Jimbarann" by using Matlab program, so it will be able to know the increase of harmonic distortion caused by non linear load operation.
-
II. LITERATURE REVIEW
-
A. Power quality
The quality of electric power can be interpreted as the connection of electrical power with electrical equipment. If electrical appliances work properly and reliably without any pressure and losses, it can be said that they have good power quality, whereas when electrical appliances do not work properly, are less reliable or suffer a loss during normal usage, it can be said that the equipment has a quality poor power.
Basically, the voltage is supplied in the form of a sinusoidal having amplitude and frequency corresponding to the standard (in general) or system specification. However, in reality, no power source is ideal and in general electric power can deviate [3].
-
B. Harmonics on electric power systems
Harmonics is a phenomenon arising from the operation of non-linear electrical loads. Harmonics on electrical systems is one of the causes that affect the quality of electrical power. The influence of harmonics is very dominant because it is permanent and causes the formation of high frequency waves (multiples of fundamental frequency, eg: 100Hz, 150Hz, 200Hz, 300Hz, and so on). This can disrupt the electrical system at its fundamental frequency of 50 / 60Hz, so that the ideal current waveform or voltage is a pure sinusoidal will become defective due to harmonic distortion that occurs [3].
-
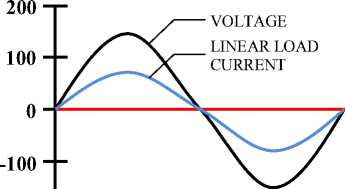
1. Linear load
Linear load is a load whose current component is proportional to its voltage. There is a linear relationship between the current and the voltage so that the current waveform will be the same as the voltage waveform, as shown in Figure 1. Linear loads absorb sinusoidal currents when supplied by sinusoidal voltage. Examples of linear loads include electric irons, heating, incandescent, and others [4]:
-200
Degrees (0 – 360)
Fig. 1 Current and voltage waveforms at linear load [4]
-
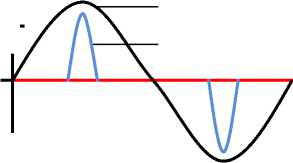
2. Nonlinear load
The load whose current component is not proportional to the voltage component, so the current waveform is not the same as the voltage waveform. There is no linear relationship between current and voltage. The nonlinear load absorbs the non sinusoidal current as well as the harmonic current, although supplied by the sinusoidal voltage. As shown in Figure 2 [4].
200
VOLTAGE
NON-LINEAR
LOAD CURRENT
100
0
-100
Degrees (0 – 360)
Fig. 2. Current and voltage waveforms at nonlinear loads [ 4 ]
-200
-
3. THD (Total Harmonic Distortion)
The load whose current component is not proportional to the voltage component, so the current waveform is not the same as the voltage waveform. There is no linear relationship between current and voltage. The nonlinear load absorbs the non sinusoidal current as well as the
harmonic current, although supplied by the sinusoidal
voltage. As shown in Figure 2 [4].
hmax
Λ ∑ Mh2
⅛ h >1
THD =
M1
(1)
Mh is the rms value of the harmonic component h in the
sum of M [3]. THD can also be expressed in other
equations :
1 k2 THD = —I Uu„2 I n
u1 ∖n=2 )
(2)
U1 = fundamental harmonic component, Un = N-harmonic component; K = The maximum harmonic component that observed.
Percent VTHD is the percentage of the total number of voltages distorted by harmonics and percent ITHD is the percentage of the total number of harmonic distorted currents. The harmonic voltage formula (Vh) can be explained as the ratio of nominal system voltage (Vs) in percent:
% V. = -⅛100=h-Vχ100 h
s sc
(3)
%Vh = (1^Ii) x100 h (Isc Ii)
Vh = harmonic voltage; Vs = System voltage;
Ih = harmonic current; Isc = Short circuit current; h = harmonics;
(4)
Isc / Ii = Ratio in Limit Distortion of Harmonic Flow table;
Ii = The current that takes electronic load power
Total Harmonic Distortion (THD) at current is defined:

τ _ h=1
I THD = .
Ii
(5)
4. Standard Harmonics
IEEE has issued IEEE Std. 519-2014 [5]. There are two criteria used to evaluate the distortion of harmonics, ie limits for current and voltage harmonics. IEEE has set the standard on Point of Common Coupling (PCC) as in table 1 and table 2:
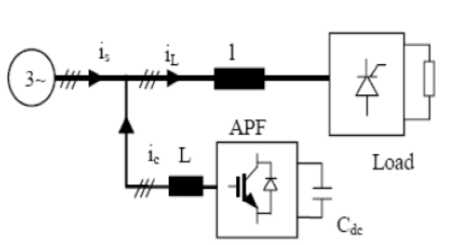
Fig. 3. Shunt active power filter [6]
TABLE 1
LIMIT VOLTAGE DISTORTION [5]
|
BusVoltage at PCC |
Individual Voltage Distortion (%) |
Total harmonic distortion THD (%) |
|
V ≤ 1.0 kV |
5.0 |
8.0 |
|
1 kV < V < 69 kV |
3.0 |
5.0 |
|
69 kV < V ≤ 161 kV |
1.5 |
2.5 |
|
161 kV < V |
1.0 |
1.5 |
In a control system there are several kinds of control actions, including: proportional control action, integral control action and derivative control action. Each deficiency and the advantages of each controller P, I and D can co-exist by combining the three in parallel to proportional control plus control integral plus derivative control (PID control). The P, I and D control elements are all intended to accelerate the reaction of a system, eliminating offsets and producing large initial changes.
TABLE 2.
HARMONIC CURRENT DISTORTION LIMIT WITH VOLTAGE RATING OF 120 V TO 69 KV [5]
|
Maximum harmonic current distortion in percent of IL | ||||||
|
Individual harmonic ordee (odd harmonic)a,b | ||||||
|
ISC/IL |
3≤h≤11 |
11≤h≤17 |
17≤h ≤23 |
23≤h ≤35 |
35≤ h≤50 |
THD |
|
< 20 |
4.0 |
2.0 |
1.5 |
0.6 |
0.3 |
5.0 |
|
20 < 50 |
7.0 |
3.5 |
2.5 |
1.0 |
0.5 |
8.0 |
|
50 < 100 |
10.0 |
4.5 |
4.0 |
1.5 |
0.7 |
12.0 |
|
100 <1000 |
12.0 |
5.5 |
5.0 |
2.0 |
1.0 |
15.0 |
|
>1000 |
15.0 |
7.0 |
6.0 |
2.5 |
1.4 |
20.0 |
|
THDi harmonics even sequence is limited to 25% of the odd-order harmonics above | ||||||
|
The current distortion caused by a half-wave rectifier dc is not permitted or not included in the table above | ||||||
|
where : Isc = Max short circuit current di PCC (Point of Common Coupling) IL = Max load current (fundamental load current) in PCC | ||||||
-
C. Filter Active and PID (Propotional integral derivative)
The active filter is an electronic circuit consisting of components R, L, and C that are designed to reduce harmonics in non-linear loads in the power system because passive filters are always problematic if the disturbance is greater and continuous. The active filter injects the current to reduce the harmonics contained in the load current. The output stream of IL becomes sinusoidal and has good quality.
The Shunt Active Power filter is a 3-phase Current-Controlled Voltage-Source Inverter (CC-VSI) where the inductor is located on the AC output side and capacitors on the DC side with a constant DC voltage value.
-
D. Losses Calculation on Harmonic Hazard Transformer
Losses of a transformer can technically be referred
to as load loss (PLL). There are two components considered in load loss calculation i.e. copper loss (I2R) and eddy-
current loss (PEC) [3]:
Pll =(12 × R)+ Pec
(6)
I 2R loss is a proportional copper loss, while PEC can be calculated by the following equation [3]:
PEC = KEC × I 2 × h 2
(7)
where: KEC = Proportionality Constant
In pu it can be calculated using the following equation [3]:
PLL =Σ Ih + (Σ Ih × h ) × PEC-R (p.u) (8)
Where:
P = Eddy Current Loss Factor EC — R
h = Harmonic (%)
Ih = Harmonic Current (A)
∑ Ih 2 is a component of copper loss expre ssed in pu, and (∑ Ih 2 × h2 )× Pec-r is an eddy current loss factor under normal conditions expressed in pu. PEC factors can be seen in table 3:
TABEL 3
TYPICAL VALUES OF PEC-R.[3]
|
Type |
MVA |
Voltage |
PEC-R(%) |
|
Dry |
≤ 1 |
- |
3-8 |
|
≤ 1,5 |
5 kV (High Voltage) |
12-20 | |
|
≤ 1,5 |
15 kV (Hight Voltage) |
9-15 | |
|
Oil-filled |
≤ 2,5 |
480 V (Low Voltage) |
1 |
|
2,5 – 5 |
480 V (Low Voltage) |
1-5 |
] > 5 □ 480 V (Low Voltage) □ 9-15 I
III. RESULTS AND DISCUSSION
|
MDP FT |
R |
19,11 |
5 |
Not standard |
|
S |
14,87 |
5 |
Not standard | |
|
T |
19,65 |
5 |
Not standard |
-
A. System Modeling
The matlab model of the system to simulate is shown in figure 4. Before performing the simulation, it is necessary to calculate the system parameters (R, L, C).
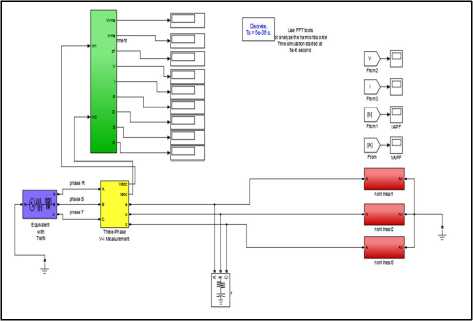
Fig. 4. System Modeling
-
B. THDv and THDi simulation on existing condition
-
1. THDi simulation.
In this simulation a simulation will be performed using the model as shown in Figure 4. The simulation is done for all the distribution panels, and it will look THDi and THDv, the output form of the current wave and the distorted voltage, the harmonic order, and the current and the fundamental voltage.
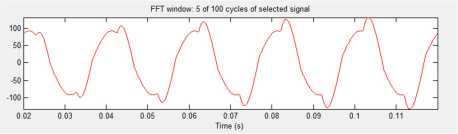
Fig. 5 Current wave harmonic phase R
In the same way we can simulate THDi to get the THDi value of each SDP and THDi maximum according to IEEE Std 519-2014 as shown in table 4:
TABLE 4 PERCENTAGE OF THDI PERPHASE UNDER EXITING CONDITIONS.
|
SDP |
Phase |
THDi (%) |
THDimax(%) |
Information |
|
SDP TE |
R |
18,27 |
8 |
Not standard |
|
S |
14,40 |
8 |
Not standard | |
|
T |
20,09 |
8 |
Not standard | |
|
SDP TI |
R |
15,48 |
12 |
Not standard |
|
S |
10,65 |
12 |
standard | |
|
T |
19,81 |
8 |
Not standard | |
|
SDP TM |
R |
19,93 |
8 |
Not standard |
|
S |
20,02 |
8 |
Not standard | |
|
T |
19,56 |
8 |
Not standard | |
|
SDP TA |
R |
18,49 |
8 |
Not standard |
|
S |
17,66 |
12 |
Not standard | |
|
T |
19,47 |
8 |
Not standard |
-
2. THDv simulation.
The THDV simulation is shown in the form of voltage harmonic wave and voltage harmony spectrum. The result of THDv simulation obtained from FFT in SDP panel Electrical Engineering for Phase R can be seen in Figure 6:
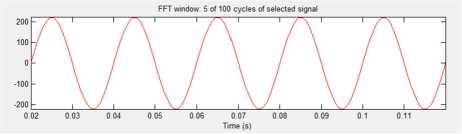
Fig. 6 Voltage wave harmonic phase R
In the same way we can simulate THDV to get THDV value of each phase like table 5:
TABLE 5
PERCENTAGE OF THDV PERPHASE CONDITION OF EXITING
|
DP |
Phase |
THDV (%) |
THDvmax (%) |
Information |
|
SDP TE |
R |
0,89 |
5 |
standard |
|
S |
0,72 |
5 |
standard | |
|
T |
1,12 |
5 |
standard | |
|
SDP TI |
R |
0,76 |
5 |
standard |
|
S |
0,58 |
5 |
standard | |
|
T |
1,02 |
5 |
standard | |
|
SDP TM |
R |
1,11 |
5 |
standard |
|
S |
1,07 |
5 |
standard | |
|
T |
1,18 |
5 |
standard | |
|
SDP TA |
R |
1,20 |
5 |
standard |
|
S |
0,87 |
5 |
standard | |
|
T |
1,18 |
5 |
standard | |
|
MDP FT |
R |
3,19 |
5 |
standard |
|
S |
1,96 |
5 |
standard | |
|
T |
3,37 |
5 |
standard |
-
C. Shunt Active Filter Simulation
In this condition only the simulation is done for THDi only, because in existing condition THDV already meet the standard. The simulation results obtained from FFT for THDi on SDP Electrical Engineering for Phase R can be seen in figure 7.
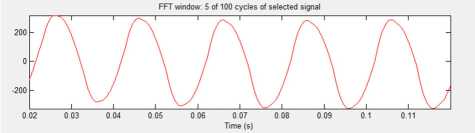
Fig. 7. Current wave harmonic phase R
The full simulation results for THDi can be seen in table 6.
-
D. Shunt Active Filter Simulation Using PID Control
This simulation will produce wave-like THDi and graphs like figure 8 (SDP TE phasa R).

Fig. 8. Current wave harmonic phase R
The full simulation results for THDI can be seen in table 6.
TABLE 6
PERCENTAGE OF THDI IN EXITING CONDITIONS, WITH SHUNT ACTIVE FILTERS AND WITH SHUNT ACTIVE FILTERS USING PID CONTROL
|
SDP |
Phase |
Exiting (%) |
Active Filter (%) |
Active Filter with PID (%) |
THDimax (%) |
|
SDP TE |
R |
18,27 |
6,49 |
2,42 |
8 |
|
S |
14,40 |
5,01 |
2,00 |
8 | |
|
T |
20,09 |
8,16 |
2,63 |
8 | |
|
SDP TI |
R |
15,48 |
5,39 |
2,20 |
12 |
|
S |
10,65 |
3,94 |
1,62 |
12 | |
|
T |
19,81 |
8,15 |
2,59 |
8 | |
|
SDP T M |
R |
19,93 |
7,72 |
2,36 |
8 |
|
S |
20,02 |
7,55 |
1,89 |
8 | |
|
T |
19,56 |
8,31 |
2,65 |
8 | |
|
SDP T A |
R |
18,49 |
7,70 |
2,45 |
8 |
|
S |
17,66 |
6,19 |
1,72 |
12 | |
|
T |
19,47 |
8,13 |
2,65 |
8 | |
|
MDP FT |
R |
19,11 |
9,43 |
6,28 |
8 |
|
S |
14,87 |
6,62 |
3,45 |
8 | |
|
T |
19,65 |
9,72 |
5,06 |
8 |
E. Loss Analysis
-
1. Analysis of losses before the harmonics affected
Transformer losses under unlimited conditions have been determined by. According to SPLN 50: 1997 (about distribution transformer specification), it can be determined the value of losses in 200 kVA transformer as below:
Total losses (kW) = Pcu + Pi
= 2500 + 480
= 2980 W = 2,98 kW
Since cos φ is 0.9, then the losses in kVA:
Losses = 2.98 kW / 0.9 = 3.31 kVA
-
2. Losses Analysis after Harmonic Influence
-
i. Analysis of losses on existing conditions.
The first step is to determine P base 1φ, to find the odd-order harmonic current (order 1 - order 19), so that the harmonic current (Ih) in pu for each phase can be calculated:
Ihl _ phasaR (P - U ) = ^ = = 1,000 (P -U )
Ih3_phasaR (P-u) = IhT = 2541 = 0,144 (P-u)
Based on the value of Ih of each order as above, then the values Ih2 and Ih2 x h2 per phase can be determined in pu. Based on the harmonic calculation from the order of 1 to the order of 19th it can be calculated loadloss (PLL) for each phasa using equation (8). The value of PEC-R for a transformer with a 400 V secondary voltage is known at 1%. So the result of PLL calculation in pu for each phase can be seen in table 7.
TABLE 7 PLL in PU
|
Phase |
PLL(p.u) |
|
R |
1,046320523 |
|
S |
1,031372627 |
|
T |
1,045591593 |
To get the PLL in multiplied by P base 1φ, like the following table.
TABLE 8
LOADLOSS IN KW FOR EACH PHASE
|
Phase |
Losses (p.u) |
PBase 1 Phase |
Losses (kW) |
|
R |
1,046320523 |
121,657 |
5.635 |
|
S |
1,031372627 |
121,657 |
3.817 |
|
T |
1,045591593 |
121,657 |
5.547 |
|
Total Losses |
14,998 | ||
-
ii. Analysis of Losses by Operating the Shunt Active Filter
In the same way as in the exiting condition, the PLL for Active Filter operating conditions is obtained as table 9:
TABLE 9
LOADLOSS IN KW FOR EACH PHASE
|
Phase |
Losses |
PBase 1 Phase |
Losses |
|
R |
0.019895 |
133,916 |
2,664258 |
|
S |
0,0306144 |
133,916 |
4,099758 |
|
T |
0,0206924 |
133,916 |
2,771043 |
|
Total Losses |
9,535059 | ||
-
iii. Losses Analysis Using Shunt Active Filter
with PID Control
In the same way as in the exiting condition, the PLL for Active Filter operation conditions with PID control is obtained as table 10:
TABLE 10
LOADLOSS IN KW FOR EACH PHASE
|
Phase |
Losses (p.u) |
PBase 1 Phase(kW) |
Losses (kW) |
|
R |
1,01279598 |
132,73 |
1,699 |
|
S |
1,01111903 |
132,73 |
1,477 |
|
T |
1,01250705 |
132,73 |
1,661 |
|
Total Losses |
4,837 | ||
Comparison of losses between exiting conditions, with shunt active filters and using Active Shunt Files with PID control can be seen as table 11.
[7] De La Rosa, F. C. 2006. Harmonics And Power System. United States of America: Taylor & Francis Group.
TABLE 11
COMPARISON OF LOSSES FOR ALL THREE CONDITIONS
Description
PLL Harmonic –exiting conditions
PLL Harmonic – Without PID
PLL Harmonisa – with PID
14,998
12,998
4,837
[8] Ferracci, Ph. 2001. Power Quality. Cahier Technique Merlin Gerin no: 199.
IV CONCLUSION
Based on the analysis that has been done, can be obtained some conclusions that is from the simulation and analysis on existing conditions (non-filter conditions), obtained the influence of non-linear loads cause most of THDi on SDP not meet IEEE 2014 standards, while THDv it meets the standard.
Simulation with shunt active filter, the simulation results show there are still some phases of SDP that have not met the standard. Simulations using shunt active filters with PID controls produce THDi and THDv on all SDPs meet the standards.
The result of losses analysis on the condition of its losses is 9,01%, using active shunt losses 5,73%, and using active shunt filter with PID losses control 2,18%.
REFERENCES
-
[1] Dugan; McGranaghan; Santoso; Beaty. 2003. Electrical Power System Quality - Second Edition. USA: McGraw-Hill.
-
[2] Mielczarski, W. 1997. Quality of Electricity Supply and Management of Loss Networks. Melbourne: Puma Press Publishing and Printing.
-
[3] Dugan, R.C., McGranaghan, M.F., Santoso, S., Beaty, H.W. 2004. Electrical Power System Quality-Second Edition. The McGraw-Hill.
-
[4] Dugan, R.C; Rizy. 2001. Harmonic Considerations for Electrical Distribution Feeders. National Technical Information Service, Report No. ORNL / Sub / 81-95011 / 4 (Cooper Power Systems as Bulletin 87011, "Electrical Power System Harmonics, Design Guide").
-
[5] IEEE Recommended Practices and Requirements for Harmonic Control in Electric Power Systems. IEEE Standard 519-2014.
-
[6] Izhar. Metal. "Performance for Passive and Active Power Filter in Reducing Harmonics in the Distribution System", National Power & Energy Conference (PECon) 2004, IEEE Proceedings, Kuala Lumpur, Malaysia, pp. 104-108, 2004.
Discussion and feedback