Geographic Information System of Potential Tsunami Impact Areas and Safe Gathering Places for Coastal Tourism Area in Badung Regency, Bali Province
on
Journal of Electrical, Electronics and Informatics, Vol. 1 No. 2, September 2017
27
Geographic Information System of Potential Tsunami Impact Areas and Safe Gathering Places for Coastal Tourism Area in Badung Regency, Bali Province
I Made Arsa Suyadnya1*, Duman Care Khrisne2
-
1,2Computer Lab., Department of Electrical Engineering Faculty of Engineering, Udayana University Badung, Bali, Indonesia
Abstract The Southern part of Bali especially Badung regency, in addition to having natural beauty and popular tourist attraction, it has a high potential for disaster. The fact is the coastline of Bali in the south is prone to tsunami because Bali is located close to the colliding zone between the Indo-Australian plate and the Eurasia plate, which presents the main source of the local tsunami that could hit the island of Bali. This research undertakes the design and development of a Geographic Information System (GIS) that can provide information and socialization of potential tsunami impact areas and safe gathering places for coastal tourism area in Badung regency. This application is built web-based by using Google Maps API v3. In this Geographic Information System, users can identify potential tsunami impact areas, obtain information on evacuation methods in the event of a tsunami disaster and can find the nearest safe gathering places to do an evacuation. By utilizing geolocation and direction services from Google Maps API v3, simulation of the nearest evacuation route has been successfully built. Evacuation is done by considering two possible evacuation sites. The first possibility is to evacuate to the nearest vertical high building, and the second evacuation site is away from the danger zone (red zone) and towards the safe zone (yellow zone or outside the yellow zone).
Index Terms — Tsunami, Coastal Tourism, Evacuation, Geographic Information System, Google Maps API
-
I. INTRODUCTION1
The Southern part of Bali especially Badung regency which is directly adjacent to the Indian Ocean, has a very beautiful coastal tourism area and attracts both domestic and foreign tourists. The tourist attraction also provides new jobs and makes the southern part of Bali develop into a region with high occupancy. According to statistical data in 2015 the population density in Badung regency, especially Kuta district is 5,724 people per square kilometer of land [1]. Moreover, by 2015 there are 4,001,835 foreign tourists visiting Bali. Most of the foreign tourists coming to Bali via the airport located in Badung regency [2]. Most of the foreign tourists traveled in Badung regency. In addition to foreign tourists, in 2015 there are also 482,147 domestic tourists visiting Badung regency [3].
The Southern part of Bali, which hosts a large number of inhabitants and tourists, in addition to having natural beauty
and popular tourist attraction, it has a high potential for disaster. The fact is the coastline of Bali in the south is prone to tsunami because Bali is located close to the colliding zone between the Indo-Australian plate and the Eurasia plate, which presents the main source of the local tsunami that could hit the island of Bali. It is estimated that tsunami waves require only 20 to 80 minutes to reach the beach [4].
Mapping of potential disaster areas especially tsunami is required as part of disaster mitigation. It can be done by using a geographical information system (GIS). Mapping can be done through a tsunami vulnerability and risk assessment approach with regard to factors such as terrestrial elevation, slope, coastal morphometry, land use, distance from the shoreline, distance from the river, infrastructure and population [5]. In addition, the determination of temporary evacuation site and final evacuation site before the occurrence of a disaster needs to be done, in this case with due regard to the factors of road facilities or good accessibility [6]. The mapping and the
evacuation route also needs to be further socialized to the public community. Lack of information on tsunami potential areas, ignorance of safe gathering places and evacuation routes, can lead to high casualties. With the public community know about potential tsunami impact areas, how and where to evacuate, it is expected to reduce the number of casualties during the tsunami disaster.
Based on the fact that the coastline of Bali in the south is prone to the tsunami disaster, this research undertakes the design and development of a geographic information system that can provide information and socialization of potential tsunami impact areas and safe gathering places for coastal tourism area in Badung regency.
-
II. METHODS AND SYSTEM OVERVIEW
-
A. Methods
Application developments in this research apply the stages in System Development Life Cycle (SDLC) that starts from planning, system requirement analysis, system design, implementation and testing [7]. In the planning stage, conducted data collection related to the mapping of potential tsunami impact areas and safe gathering places for coastal tourism area in Badung regency. Data mapping of potential tsunami impact areas obtained from GITEWS (German-Indonesian Cooperation for a Tsunami Early Warning System) [8]. In the stages of system requirement analysis performed analysis of functional and nonfunctional requirements of the system. The next stage performs system design such as interface design and
database, implementation of geographic information systems by utilizing Google Maps API v3 and system functionality testing.
-
B. System Overview
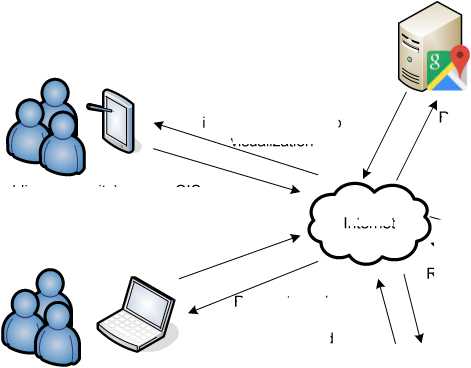
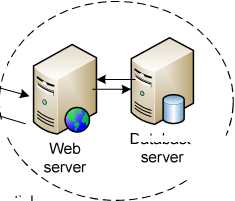
The prototype of Geographic Information System (GIS) is built web-based by using PHP web programming language, MySQL database, and Google Maps API v3. Figure 1 is a general system overview of the geographic information system of potential tsunami impact areas and safe gathering places for coastal tourism area in Badung regency. In this application, there are two types of users, namely administrator who will manage spatial and tabular data displayed in the GIS and public community who can access information services about potential tsunami impact areas and safe gathering places.
This geographic information system can be accessed anywhere as long as the user has Internet access. Users can access it using a web browser, either from smartphone or from computer or laptop. Request information made by the user will be forwarded through Internet access to the web server. The user request for information is a combination of spatial and tabular data. Spatial and tabular data will be retrieved from the database server. The combination of spatial and tabular data will be the response to requests made by the user. Furthermore, on the user side will request to Google Maps server to visualize spatial and tabular data into map view.
Google Maps server
Requests and responses for information and map visualization
User (public community) access GIS through web browser on smartphone
nternet
Requests and responses for map visualization
User (public community) access GIS through web browser on laptop/PC
Requests and responses for information and map visualization
InpuVedit spatial .and tabular data
Requests/
Database

Administrator
-
C. Use Case Diagram
Use case diagrams are useful for describing the functions of a system from a user's point of view with the system itself [9]. The use case diagram is related to the event, which is what happens when a user interacts with the system. Figure 2 illustrates the activities that can be performed by each actor namely administrator and public community.
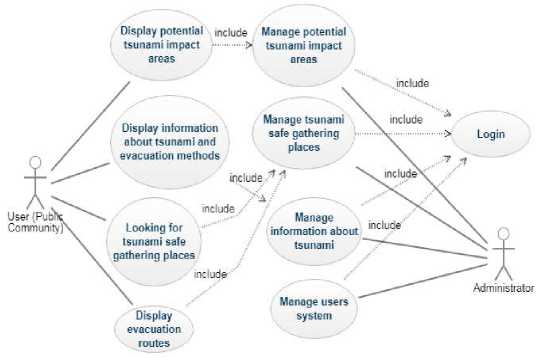
Fig. 2. Use case diagram
-
D. Database Design
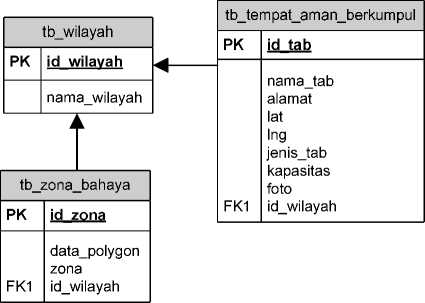
The design of database is shown in table relationship diagram. Table relationship diagram is a diagram that serves to display the relationship between tables in the database. Figure 3 is a table relationship diagram for the application database.
-
III. RESULT AND DISCUSSION
This web-based geographic information system consists of two main pages namely the main page for administrator and the main page for public community. The main page for administrator is used to perform system user data management, potential tsunami impact areas data management, tsunami information and safe gathering places data management. The main page for public community is used by public community to display potential tsunami impact areas, display information about tsunami, evacuation methods, find the nearest safe gathering place and display the evacuation routes.
-
A. Main Page for Administrator
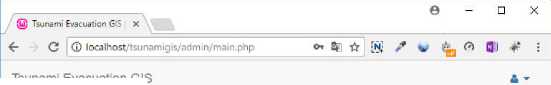
The main page for administrator can be accessed after the user successfully passes the login page. On the login page, the user as an administrator must input username and password. Figure 4 is the login page interface.
tb_users
PK username
tbjnformasi
PK id info~
If the login process is successful, then the user will be directed to the main page as shown in Figure 5.
Tsunami Evacuation GlS
® Dasfiboartl
⅛ Data Tempat Aman Berkumpul
Dashboard
password name
type status_blok
content last_update
X Data Zona Bahaya
≡ Data Wilayah
≡ Informasi
Tentang Tsunami
Cara Evakuasi
■ Data User
Selamat Datang
Halaman ini merupakan halaman administrasi untuk mengelola data-data IerKait SlG Evakuasl Tsunami. Data-data yang dikelola berupa data spasial dan data informasi terkait bencana tsunami dan cara melakukan evakuasi Pada bagian sebelah kiri terdapat menumenu yang dapat diakses untuk mengelola data-data tersebut.
Fig. 3. Table relationship diagram
Fig. 5. Main page for administrator
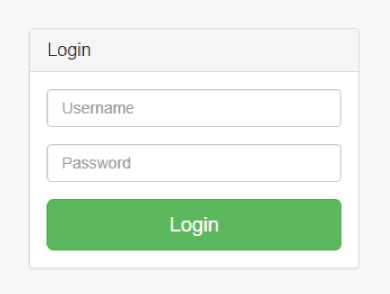
Fig. 4. Login page
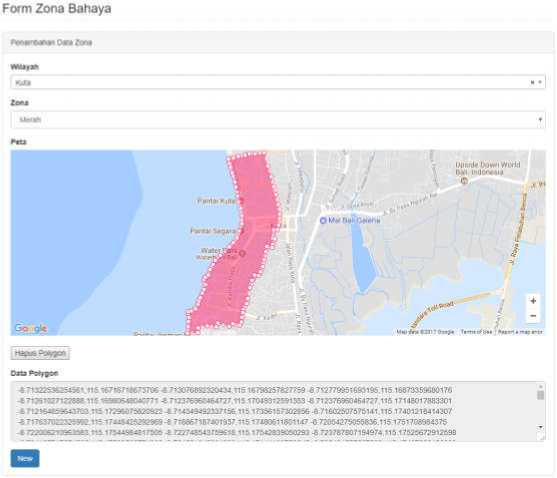
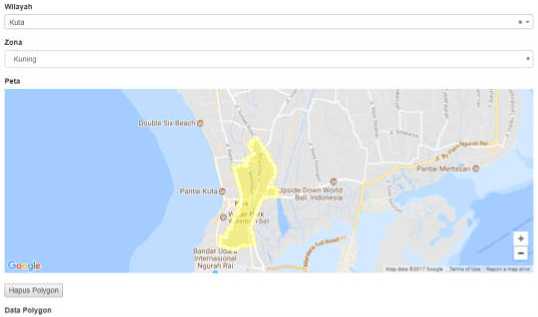
On the main page, administrators can perform various data management for the geographic information system by selecting the application menu. Administrators can add potential tsunami impact areas data through the interface as in Figure 6.
Form Zona Bahaya
-a 712143649βM902 H5 lf2WH0OJ37l1 4 712143649554982 Π5in5lβMMOT37 -8 711918338499642 110 17452716027393 -β 7ll5∣921βM2593? 1« 17577171325604 -8 7115709767« 737 115 176200β6669922 8 71176106775227 115 1772952079773 -fl 711083143584968 HS 17650188522138-8 110043444816374 115 17637252907617 8 709916383544183 118 17701019210015 fl 70β919702ββ0557.t15 1775312423706 < 70824097275625.11517881870269775 fl 707922817960062 115 1794tKl75l7O9 -O 706400012020279 115 17150266030444 4 705212938433864 115 17796029081299 -8 704783676143217 115 17894744871347


UK Oata Zona
Through the interface, as in Figure 6, administrators can determine potential tsunami impact areas by forming a polygon. There are two zones to choose namely the red zone and the yellow zone. The red zone is a tsunami hazard zone and the yellow zone is a relatively safe zone.
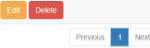
Administrators can also add tsunami safe gathering places data that can be used as a place for evacuation during the tsunami disaster. The interface for tsunami safe gathering places data management can be seen in Figure 7.
2 Kuta
SnowriQ 11o 1 of 1 entries
In addition, administrators can also add information about tsunami and evacuation methods. The interface for adding such information can be seen in Figure 8.
Fig. 6. Interface for administrators to add potential tsunami impact areas data
Form Data Tempat Aman Berkumpul
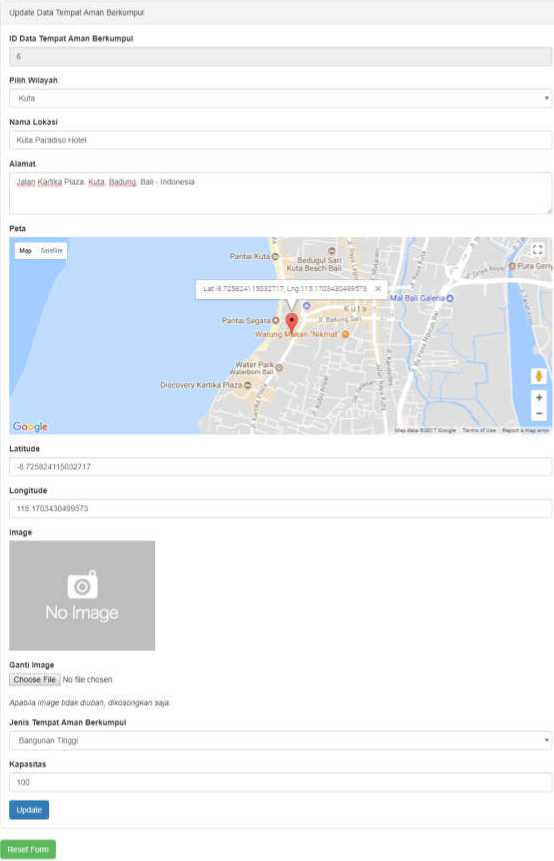
Fig. 7. Interface for administrators to add or edit tsunami safe gathering places data
Tentang Tsunami
Informasi Mengenai Tsunami
File τ Editτ View ’ Insert ’ Format ’ Table -
¼ r* B I y ≡≡≡≡JΞt⅛,E≡l≡ Formats ’
⅛ cP ⅛t H El H ⅛ ® o
Tsunami (bahasa Jepang: ⅛⅛⅛: tsu = pelabuhan, nami = gelombang, secara harafiah berarti "ombak besar di pelabuhan") adalah perpindahan badan air yang disebabkan oleh perubahan permukaan Iaut secara vertikal dengan tiba-tiba.
Tsunami dapat terjadi Jika terjadi gangguan yang menyebabkan perpindahan sejumlah besar air, seperti letusan gunung api, gempa bumi, longsor maupun meteor yang jatuh ke bumi. Namun, 90% tsunami adalah akibat gempa bumi bawah laut. Dalam rekaman sejarah beberapa tsunami diakibatkan oleh gunung meletus, misalnya ketika meletusnya Gunung Krakatau.
Gerakan vertikal pada kerak bumi, dapat mengakibatkan dasar Iaut naik atau turun secara tiba-tiba, yang mengakibatkan gangguan keseimbangan air yang berada di atasnya. Hal ini mengakibatkan terjadinya aliran energi air laut, yang ketika sampai di pantai menjadi gelombang besar yang mengakibatkan terjadinya tsunami.
Kecepatan gelombang tsunami tergantung pada kedalaman Iaut di mana gelombang terjadi, dimana kecepatannya bisa mencapai ratusan kilometer per jam. Bila tsunami mencapai pantai, kecepatannya akan menjadi kurang lebih 50 km/jam dan energinya sangat merusak daerah pantai yang dilaluinya. Dt tengah Iaut
Simpan
Cara Evakuasi Tsunam
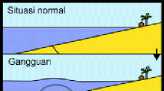
Fig. 9. Main page for public community
On the main page, as in Figure 9, the public community can know the current position whether it is in the safe zone or not. This can be known based on the location of the position marker. Location of the position marker can be determined according to the current position using the geolocation service. Furthermore, by clicking on the position marker, the user can view information on the info window shown as in Figure 10.
Informasi Mengenai Cara Evakuasi Bencana Tsunami
File ’ Edit ’ View ’ insert - Format ’ Table ∙
*' r* B I y E ≡ ≡ ≡ iΞ τ 1Ξ , i≡ i= Formatsτ
R <? S H I S H ⅛ Φ O
Konsep 2 Zona
Zona bahaya dibagi menjadi zona merah dan zona kuning. Zona merah dipandang sebagai zona paling berbahaya dengan peluang tinggi terdampak oleh gelombang tsunami. Zona kuning dipandang sebagai aman pada kebanyakan kasus, kecuali "skenario kasus terburuk" dengan magnitude yang serupa dengan Tsunami Aceh 2004. Kasus seperti ini dipandang kurang mungkin, namun tidak dapat diabaikan.
Tindakan Sebelum Bencana
-
1. Pembangunan sistem peringatan dini. Cara mengetahuinya dengan membaca data seismik dari gempa bumi terdekat yang baru saja terjadi. Cara ini dapat memberi waktu peringatan kurang lebih 15 menit. Dapat juga membuat papan bergambar pada tempat keramaian atau di tengah pemukiman.
-
2. Pembangunan tempat evakuasi (shelter) di sekitar daerah pemukiman, pembangunan tembok penahan tsunami pada garis pantai yang berisiko, penanaman mangrove serta tanaman lainnya di sepanjang garis pantai untuk meredam gaya air tsunami.
-
3. Meningkatkan pengetahuan masyarakat Iokai khususnya yang tinggal di pinggir pantai tentang tsunami dan cara-cara penyelamatan diri terhadap ’
POWERED BY TINYMCE j
Simpan
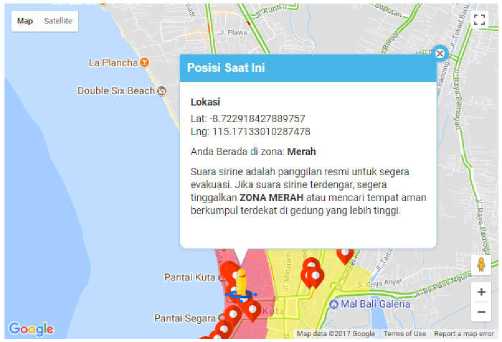
Fig. 10. Information on info window that indicate position based on potential tsunami zone
Users as public community can also search for the nearest tsunami safe gathering places by specifying a certain radius distance as shown in Figure 11.
Fig. 8. Interface for administrators to add or edit information about tsunami and evacuation methods
B. Main Page for Public Community
The main page for public community can be accessed without going through the login process. In this page, public community can display potential tsunami impact areas, display information about tsunami, evacuation mode, find the nearest safe gathering places and display the evacuation routes. The main page for public community can be seen in Figure 9.
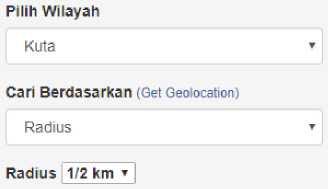
Fig. 11. Search for the nearest tsunami safe gathering places by specifying a certain radius distance
The search for tsunami safe gathering places by radius determination will show several locations that are included in the radius as shown in Figure 12.
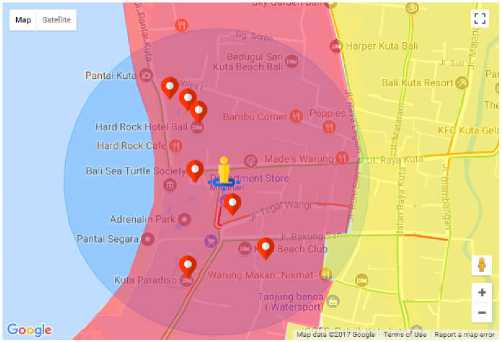
Fig. 12. Search results for tsunami safe gathering places by specifying a certain radius distance
Furthermore, the user can display information for every tsunami safe gathering places by clicking one of the markers. Information will be displayed in an info window as shown in Figure 13.
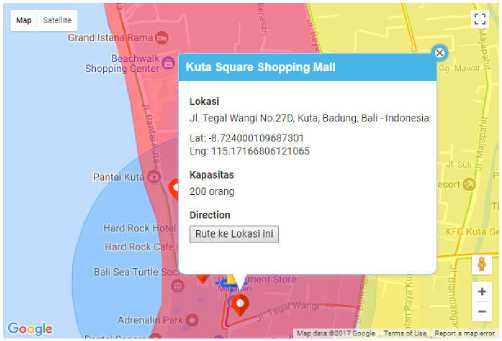
Fig. 13. Information about the selected safe gathering places is displayed in an info window
The evacuation route to the selected tsunami safe gathering place can be displayed by clicking on the "Route to This Location" button. The simulation of the evacuation route is displayed by using the direction service from Google Maps API v3 as shown in Figure 14.
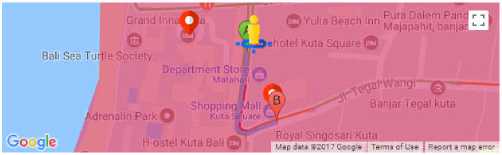
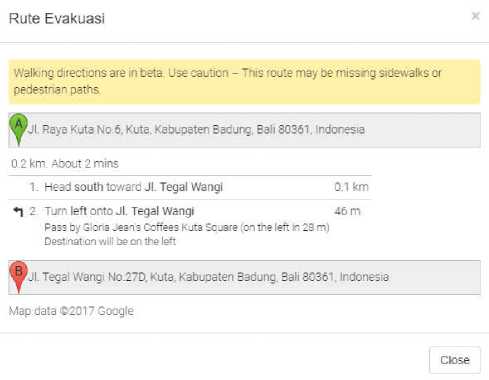
Fig. 14. Evacuation route simulation to one of the tsunami safe gathering places
-
IV. CONCLUSION
Web-based Geographic Information System that has been built by utilizing Google Maps API v3 can be a medium of information dissemination of potential tsunami impact areas and evacuation methods. Through this application, the user can know the current position whether it is in the safe zone or not. In addition, users can search for the nearest safe gathering places for evacuation. By utilizing geolocation and direction services from Google Maps API v3, simulation of the nearest evacuation route has been successfully built. Evacuation is done by considering two possible evacuation sites. The first possibility is to evacuate to the nearest vertical high building, and the second evacuation site is away from the danger zone (red zone) and towards the safe zone (yellow zone or outside the yellow zone).
This GIS can be further developed as a mobile application by integrating potential tsunami impact areas mapping, tsunami safe gathering places, location-based services, and notification services. Notification services are important to provide notification to every user device during a tsunami disaster. In addition, it should be added the possibility of an evacuation route density, provide an evacuation model with the prediction that safe gathering places could have been fully loaded and added post-disaster evacuation features.
ACKNOWLEDGMENT
The authors would like to thank Lembaga Penelitian dan Pengabdian kepada Masyarakat (LPPM) and Faculty of Engineering, Udayana University, for their financial supports in Young Lecturer Research Grants Year 2016.
REFERENCES
-
[1] BPS Kabupaten Badung. 2016. Kepadatan Penduduk menurut Kecamatan di Kabupaten Badung, 2011-2015 (Jiwa/Km2) [Online]. Available: https://badungkab.bps.go.id/linkTableDinamis/view/id/37 Accessed: 8 March 2016.
-
[2] Disparda Bali. 2016. Statistik Kedatangan Wisatawan Mancanegara yang Langsung ke Bali Berdasarkan Negara Pasar Utama (20122016) [Online]. Available: http://www.disparda.baliprov.go.id/id/ Statistik2. Accessed: 8 March 2016
-
[3] BPS Kabupaten Badung. 2016. Jumlah Kunjungan Wisnus di Kabupaten Badung, 2011-2015 [Online]. Available: https://badungkab.bps.go.id/linkTableDinamis/view/id/109.
Accessed: 8 March 2016
-
[4] Kelompok Kerja Perencanaan Evakuasi Kelurahan Kuta. 2010. Rencana Evakuasi Tsunami untuk Kelurahan Kuta, Bali [Online]. Available: http://www.gitews.org/tsunamikit/id/E4/sumber_lainnya/ rencana_evakuasi/bali_badung/Rencana%20evakuasi%20tsunami% 20untuk%20Kuta.pdf. Accessed: 9 March 2016
-
[5] Ernawati S. and Bisman N. “Tsunami Risk Level Mapping in Sikka County East Nusa Tenggara”, E-Journal Ilmu dan Teknologi Kelautan Tropis, Vol. 1, No.1, June 2009, pp. 48-61.
-
[6] Dini P., Ardiansyah, Lestari C. D., Joko P. and Rikha B. “Penentuan Tempat Evakuasi Sementara (TES) dan Tempat Evakuasi Akhir (TEA) untuk Gempa Bumi dan Tsunami dengan Pendekatan Sistem Informasi Geografis, Kota Pariaman Propinsi Sumatera Barat”, Jurnal Segara, Vol. 10, No. 1, August 2014, pp. 1-16.
-
[7] Rudy Tantra. 2012. Manajemen Proyek Sistem Informasi. Yogyakarta: Penerbit Andi.
-
[8] GITEWS. Peta Evakuasi Tsunami Bali, Badung [Online]. Available: http://www.gitews.org/tsunami-kit/id/id_tsunami_evacuation_map_ badung.html
-
[9] Sri Dharwiyanti and Romi Satria Wahono. 2003. Pengantar Unified Modelling Language (UML). IlmuKomputer.Com
Discussion and feedback