Android Application of Traffic Density Visualization Based on Vehicle Speed
on
Journal of Electrical, Electronics and Informatics, Vol. 1 No.1, February 2017
Android Application of Traffic Density Visualization Based on Vehicle Speed
Widyadi Setiawan1, I Nyoman Budiastra2, and Sri Andriati Asri3
1,2 Electrical Engineering Department
Udayana University
Denpasar, Indonesia
3Electrical Engineering Department
State Polytechnic of Bali
Denpasar, Indonesia
Abstract - This paper presents a system to display traffic density in real time based on speed of vehicles on the main roads in the city of Denpasar. With this application, users who are in a vehicle can get the density of roads information. The software will run on the Android platform created with the help of Google maps with visualization density of roads are being reviewed. Measurement of vehicle speed using the frame difference method, so the computational process can be run quickly and in real time. The trial results of this paper, user (vehicle speed measurement) produces the same data as the data is received by the client (viewer visualization) with the display format is the name of the location, vehicle speed, date and time data retrieval.
Index Terms— Android, Frame Difference, Google Map, Intelligent Transportation System and Traffic Density Visualization
Based on the Central Statistics Agency (BPS), since 2010, the growth of vehicle ownership in Denpasar reached 11 percent per year. Meanwhile, the growth of an adequate road network has not increased significantly [1]. This will bring a problem for traffic systems that exist today, such as congestion, pollution, street crime, and others. To overcome these problems, it is time for Indonesia to apply better technologies in the fields of traffic, the ITS (Intelligent Transportation System).
ITS is no longer a new technology, but it is the application of technologies that already exist in the field of electronics, computer, and telecommunications [2]. Although there are still a lot of research done for various purposes, for example to reduce bottlenecks, transportation management eficiency, and get information. However, many developed countries are implementing these technologies, including the United States, Japan, Canada, South Korea and Australia. One of the technologies applied in ITS is a measurement of the speed of vehicles using a video camera (in this case the smartphone camera). Cameras will be installed at a certain position on the road to obtain streaming video [3] that will be processed as digital image to measure the speed of the vehicle as the information density of traffic on these roads.
The following is a general overview of traffic density visualization system that will be created, as shown in Fig. 1. Smartphone 1 and 2 is referred to as a user and used to detect the speed of each vehicle passing through roads, and calculate the speed of the vehicle.
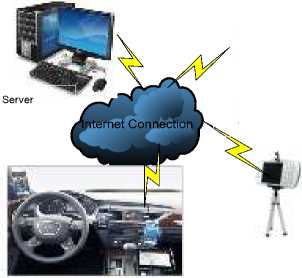
Server
ternet Connection
Smartphone 2
Smartphone 3
Fig. 1. System Overview.

Smartphone 1
Road #1
Road #2
Server preinstalled applications receive data visualization
density road density of each smartphone. Smartphone 3 function as a client that can open this application so that the client who was in the vehicle can monitor roads with the density of information in the form of vehicle speed on roads that are being reviewed. By looking at the information density on these roads, are expected to have useful information for road users so that they can decide whether to pass or not these roads.
The following is an algorithm to calculate the speed of the vehicle using the smartphone camera inputs in real time. In calculating the vehicle speed, the steps are as follows:
-
1. Preparation of hardware devices and software.
-
2. Making Process Video on every street
-
3. Perform pre-processing process [4]:
-
a. Input video.
-
b. Each Red Green Blue (RGB) frame converted into Gray scale frame
-
c. Use median filter to remove noise on every frame.
-
4. Perform the segmentation process [5]:
-
a. Put the output of the pre-processing.
-
b. Input into the process frame difference.
-
c. Calculate of difference frame to perform the identification phase of the object changes.
-
5. Conducting the process of feature extraction [6] as follow:
-
a. Put the output of the segmentation process.
-
b. Conducting the process of tracking the position of an object by using the center point of the object.
-
c. Tracking begins from the initial position to the end position of moving objects.
-
6. To measure the speed with formula:
Referencejlistance* fps
Vehicle Speed = ———:---r-----
Number_of_Frame
(3600) Km
1000 hour
We use reference distance equal to six. Number of frame and fps’ value according to specification of streaming video.
-
VIII. RESULT
This section will discuss the results of the test program to display results in the form of information such as the name of the location, average speed, date and time on receiver (client). Measurements made by the user on a moving vehicle, the user gets the results of measurements, such as vehicle speed. Data sent by the user in the form of location information, speed and time measurement speed. Here is an example of the speed of data retrieval results performed by the user as shown in Fig. 2.
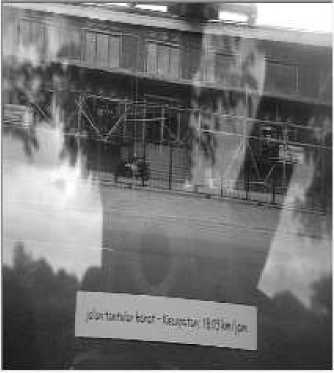
Fig. 2. User’s Measurements.
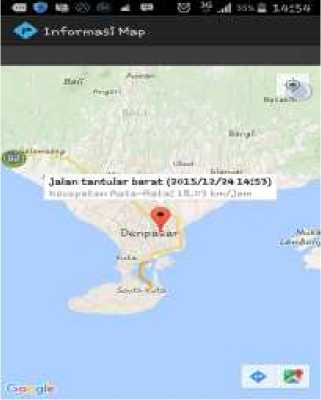
Fig. 3. Google map Visualization of client.
Seen from Fig. 2, the measured speed of applications is 18.03 kph. The information obtained by the user through the stages of measurements of vehicle speed will be sent to the recipient (client) via G-talk. The format is sent by the user to the recipient (client) such as location (longitude and latitude), the name of the location, vehicle speed, date and time. With the delivery of these results, the display on the receiver (client) will appear in the format sent from the user as shown in Fig. 3, in the form of location data, longitude latitude pointing, name the location: West Tantular Street, vehicle speed: 18.03 kph, date: December 24, 2015 and the time of data collection: hours of 14:53 pm.
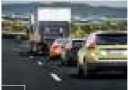
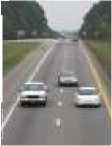
The next program of testing done at the site Renon area namely Tjut Nyak Dien Street and in West Tantular Street, with the position of the receiver (client) in Tantular Street. It can be seen in Fig. 4 below:
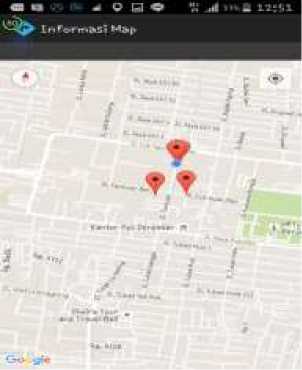
Fig. 4. Visualization of the user's and client’s position.
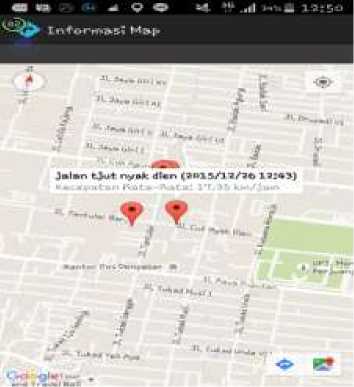
Fig. 5. Display measurement test results from the first user
Fig. 5 is a view of the result of the location where the user take measurements at different locations. The first user in
West Tantular Street and the second user is on Tjut Nyak Dien Street with client positions in the Tantular Street. Then it will be measured so as to show the results that will appear on the Google map receiver (client). The results obtained from Fig. 5, the data that appears in the client application is its location: pointing longitude and latitude, the location name: Tjut Nyak Dien Street, vehicle speed: 17.35 kph, the data retrieval date: December 26, 2016 and the time of data collection: 12:43 hours local time.
From Testing has been done on the vehicle speed measurement applications the user can generate the vehicle speed with the use of frame difference method as a primary function to generate the value of the vehicle speed. Applications on the client also has to show the data sent from the user in accordance with the specified formats, such as location, name of the location, vehicle speed data, date and time data retrieval.
From the application of this research still has a lot of disadvantages compared to other similar applications. This application can only show the speed of vehicles in one vehicle, while for the reality of congestion expected by society that can determine the density of traffic on a location by knowing the average speed of the vehicle at that location.
The development of this application can be described as follows. Measurement of the speed of each vehicle will get the speed of all vehicles passing through a road section then searched the average speed. The information density of roads in the form of average speed at a certain time on the road can be used to detect congestion on the location of these roads. The average speed is in higher states, initiate these road not in traffic, or vice versa if lower, the condition is jammed. The use of color can also be added to improve the readability of the information. Like red for congested road conditions, yellow for road conditions rather dense and green for smooth road conditions. It can also add features that provide an alternative way faster if the discovery of congestion on major roads to avoid congestion. In applications can also be added video streaming and photo information in order to know in real time conditions on these roads. And you can also add features latest info which can provide information that is happening around locations such as accidents, congestion, and the weather at the time. For the next development focuses on producing adequate quantities of data, especially during the peak hour in the morning and evening.
Acknowledgment
On this occasion, the researchers are very grateful to Research and Community Service of Udayana University and Ministry of Research, Technology and Higher Education with the contribution conducting research competitive grants scheme, so that the research could be conducted.
References
-
[1] ------------, (2010, Mei 27) [Online].
Available:http://www.balipost.co.id/
-
[2] Peddireddi, L.,“Object Tracking and Velocity Determination using TMS320C6416T DSK’, Alpen Adria: University Klagenfurt Faculty fur Technische Wissenschaften. 2008.
-
[3] Gonzales, R. C., “Digital Image Processing”, Third Edition, Prentice Hall, Upper Saddler River, NJ, 2008
-
[4] Hartoto, P., “Sistem Deteksi Kecepatan Kendaraan Bermotor pada Real Time Traffic Information System’, Surabaya: Insitut Teknologi Sepuluh Nopember. 2011.
-
[5] Rohman, M., “Analisa Gerakan Manusia Pada Video Digital’,
surabaya: institut teknologi sepuluh nopember.
-
[6] Setiawan, W, “Simulasi Pengukuran Laju Kendaraan dengan Metode Frame Difference Dan Bounding Box pada Rekaman Video Digital”, JURNAL TSI, Vol.4,No. 2, July 2013.
10
Discussion and feedback