QUALITY CONTROL OF GC PERFORMANCE FOR STEROID ANALYSIS
on
ISSN 1907-9850
QUALITY CONTROL OF GC PERFORMANCE FOR STEROID ANALYSIS
Iryanti Eka Suprihatin
Departement Of Chamestry Facultyof Mathematics and Natural Scince Udayana University, Bukit Jimbaran
ABSTRAK
Artikel berikut melaporkan usaha-usaha yang telah dilakukan dalam menghasilkan respons kromatografi gas (KG) guna mendapatkan hasil analisis senyawa-senyawa steroid yang andal. Usaha-usaha itu adalah proses untuk memperoleh LOD dan LOQ serendah mungkin, menjaga linearitas respons, keterulangan, dan keandalan dari analisis. LOD yang ditunjukkan oleh prosedur yang telah dijalankan dalam percobaan ini adalah 0.0002 ng, yaitu dari menginjeksikan 1µL sampel dengan konsentrasi terendah sebesar 0.2 µgL-1, sementara LOQnya adalah 0.001 ng (yakni dengan menginjeksikan 1µL sampel dengan konsentrasi terendah sebesar 1 µgL-1). Ini berarti bahwa analisis ini mampu mendeteksi atau menentukan sampel dari lingkungan yang konsentrasinya jauh lebih kecil melalui pemekatan selama preparasi, seperti umumnya preparasi kontaminan dalam sampel air. Terbukti pula bahwa analisis dengan KG ini andal dengan linearitas tinggi dalam jangkauan konsentrasi steroid yang diteliti, yakni 0-10 mgL-1.
Kata Kunci : rhizodegradasi, limbah minyak, laju, kinetik
ABSTRACT
This paper reports the process conducted to maintain a high quality of GC responses in obtaining reliable data on steroid analyses of environmental samples. Works including setting up the Limit of Detection (LOD) and Limit of Quantitation (LOQ), maintaining linearity, controlling the reproducibility, and determining its reliability are described. It is evident that in this work the LOD of the GC is 0.0002 ng (by 1 µL injection of 0.2 µgL-1 samples) and the LOQ is 0.001 ng (by 1 µL injection of 1 µgL-1 samples), which means it is capable of detecting much lower concentrations of steroid compounds if the samples undergo 2000 times pre-concentration during preparation. Under the range investigated the GC provides reliable quantitative linear responses to all steroid compounds.
Keywords : rhizodegradation, oil waste, rate, chinetic
INTRODUCTION
One of the most significant steps in the steroid analysis is the quantitative determination of each compound in the samples. In this project the analysis is carried out using a gas chromatograph with a mass spectrometer (GC/MS). The success of the analysis therefore depends on the reproducible performance of the GC/MS (Borjesson, et.al.,1998; Nichols, et.al., 1996). For this reason there are basic protocols to be carried out to assure the quality of the GC outputs.
Limit of Detection (LOD) and Limit of Quantitation (LOQ)
LOD is the lowest concentration detectable by the analytical method, and LOQ is the lowest concentration that can be quantitatively analysed (Nguyen, et.al., 1995). The LOD and LOQ of the GC/MS is determined by analysing standard solutions over a range of concentrations until the instrument cannot detect any of the compounds injected (Piocos, E. A. and de la Cruz, A. A. 2000). In these analyses the concentration ranges chosen were 0.01 µgL-1- 10 mgL-.
Linearity.
Linearity of an analysis shows the correlation between the response and the amount of the analytes. Good quality analysis should give as high linearity as possible. The linearity of GC response is tested by analyzing a range of known concentration of analytes under the same protocol (Jayasinghe, et.al., 1998; Cathum and Sabik, 2001). The linearity of the GC responses to the concentrations of each compound is shown by a calibration curve or statistically by the linear correlation coefficient (R2). The analysis of samples should be carried out within the linear ranges of the curve to maintain accurate quantization of the samples (Nichols, et.al.,1996). Calibration standards should be included along with every sample analysis.
Reproducibility of the GC responses and silylation recovery.
Along with linearity, the variation of GC responses to the same sample is a measure of precision of the instrument. The variation is determined by the “coefficient of variation (C.V.)” of responses (represented by areas) of 5 or more injections of a single sample. The C.V. is calculated using the formulae:
Sd
C.V = —x 100%
where Sd is the standard deviation and X is mean response
The C.V. of the five injections is defined as the C.V. of the GC and used as a measure of the GC reproducibility for a particular compound. The lower the C.V. the better the reproducibility.
The silylation process changes steroids to their trimethylsilyl (TMSi) ether derivates to reduce their boiling points, however, the extent of the reaction cannot be quantitatively measured (Nguyen, et.al., 1995). Thus reliability of the derivatisation can only be indirectly determined as an inseparable parameter of the “reproducibility of GC responses and silylation process” which is obtained by calculating the C.V. of multiple GC responses to replicates of silylation products. For example, five silylated
standard solutions are each analysed five times using the GC, and the C.V. of the twenty five responses are adopted as the measure of the combined GC and silylation reproducibility.
Reliability of the analytical method
Using external standards for quantitative analysis, especially of environmental samples, can lead to uncertainty. This is because of the differences in matrices of samples and standards and in treatments applied to them. Standard addition method is ideal for analysing environmental samples because both unknown and standard compounds share the same matrix and treatments (Jayasinghe, et.al., 1998; Cathum and Sabik, 2001). The drawbacks of using this method are time and reagent use as each replicate sample must be analysed across the range of concentrations expected.
A compromise can be drawn by combining both methods, i.e. using external standards to determine the concentrations of the isolated compounds, and the standard addition method to calculate the percentage of recovery of the compounds from the samples. By determining the recovery, the reliability of the analytical method by which the compounds are isolated is determined. This knowledge is then used to recalculate all concentrations obtained by the external standard method of the expected concentrations in the original samples.
In summary, to minimise the uncertainty of the results produced by external standard determination, the recovery efficiency of the analytical method used to isolate the compounds from samples needs to be determined, and this is carried out using the standard addition method.
METHODS
Limit of Detection (LOD) and Limit of Quantitation (LOQ)
The lowest concentration of each steroid that could be detected (by the GC/MS) was determined as the LOD of the corresponding steroid, and the lowest concentration that could be quantified was the LOQ of the steroid. Both LOD and LOQ were determined by analysing
standard solutions of steroid mixture as detailed below.
Stock solution of 1000 mgL-1 steroid mixture (cholestane, coprostanol, epicoprostanol, cholesterol, cholestanol, ethyl cholesterol, and stigmastanol was prepared with chloroform as a solvent. To prepare the 10 mgL-1 solution, 1.0 mg of the above solution was placed in a 100 volumetric flask, and made to volume with chloroform, homogenized. The 0.01, 0.05, 0.1, 0.2, 0.5, 1, 2.5, and 5 mgL-1 solutions were prepared by serial dilution of the 10 mgL-1 standard solution. The 0.01, 0.05, 0.1, 0.5, 1.0, 5.0, and 10 µgL-1 solutions were prepared by serial dilution of the 0.01 mgL-1 solution.
Three 1 mL aliquots of each solution were derivatised (silylated) as described in Suprihatin, 2004 and were analysed using GC/MS. The column used was AT™ -5MS (Alltech), a low bleed capillary column with low polarity containing 5% Phenyl and 95% Dimethyl Polysiloxane.
Linearity
The linear regressions of the GC responses (in unit counts) obtained from the above analyses against concentrations of each steroid were analysed using Microsoft® Excel.
Reproducibility
1 mL aliquot of the 10 mgL-1 standard solution was silylated and analysed 5 times using the GC/MS.
Reliability of the extraction method
Analyses were carried out in triplicate.
Standard Addition Method on sewage sample
To 250 mL sample of lagoon influent collected from Bolivar STP was added 0, 50, and 100 µg of each standard (i.e. 0, 500, and 1000
µL of 10 mgL-1 the standard solutions). (When concentrated to 1 mL for silylation process these samples would have additional steroid concentrations of 0, 5, and 10 mgL-1).
The mixtures were equilibrated for 24 hours, and then analysed as described in Suprihatin, 2004.
Environmental Samples.
To 2 L sample of river water was added 0, 1, 2, and 5 µg of each standard (i.e. 0, 100, 200, and 500 µL of 10 mgL-1of the standard solutions). Upon volume reduction during the analysis, the added standards concentrations would be 0, 1, 2, and 5 mgL-1.
The mixtures were equilibrated for 24 hours and analysed as detailed in Suprihatin, 2004.
RESULTS AND DISCUSSION
Limit of Detection (LOD) and Limit of Quantitation (LOQ)
The limit of detection of the GC obtained are: 0.0002 ng (equal to 1 µL of 0.2 µgL-1 silylated mixture) for all steroid analysed. The corresponding LOQs are 0.001 ng (equal to 1 µL of 1 µgL-1 silylated mixture) for all compounds. The LOD is improved by 250 times that of the initial LOD, but more importantly for quality control, the LOQ and its ratio to the LOD are also improved. The current LOQs are lower than the earlier LOQs and are 4.6 times of the LODs, while the old LOQs were 10 to 20 times of the corresponding LODs. The suggested ratio is 4 (Clesceri, et.al.,1998). This means that following column and power board replacement much lower concentrations could be quantified.
Table 1. Limit of detection (LOD) and limit of quantitation (LOQ) of the GC analyses for steroid
compounds
|
Compound |
Before |
This work | ||
|
LOD (ng) |
LOQ (ng) |
LOD (ng) |
LOQ (ng) | |
|
cholestane |
0.05 |
1 |
0.0002 |
0.001 |
|
coprostanol |
0.05 |
1 |
0.0002 |
0.001 |
|
epicoprostanol |
0.05 |
1 |
0.0002 |
0.001 |
|
cholesterol |
0.05 |
1 |
0.0002 |
0.001 |
|
cholestanol |
0.05 |
1 |
0.0002 |
0.001 |
|
campesterol |
n.a |
n.a |
0.0002 |
0.001 |
|
stigmasterol |
n.a |
n.a |
0.0002 |
0.001 |
|
ethyl cholesterol |
0.01 |
1 |
0.0002 |
0.001 |
|
stigmastanol |
0.01 |
1 |
0.0002 |
0.001 |
* n.a. = not available
Linearity
Initially tests for linearity of the responses to steroids (cholestane, coprostanol, epicoprostanol, cholesterol, cholestanol, ethyl cholesterol and stigmastanol) were conducted in the concentration range of 0-1000 mgL-1(not reported here). The concentration range was then
lowered to suit the concentrations of steroids in the environmental samples and to avoid overloading of the column. The new range was 0-10 mgL-1. The sewage samples, which were expected to contain high concentrations of steroids, were addressed by sample dilution.
_ - stigmastanol
[steroid] mgL-1
2
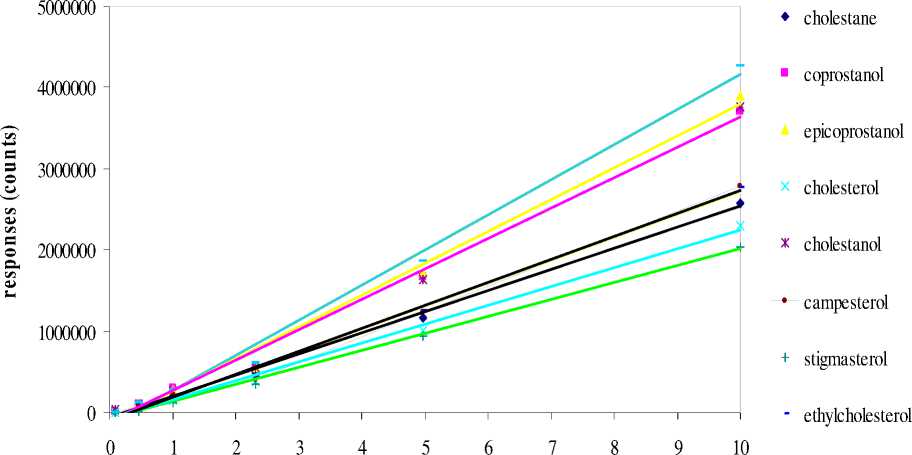
Figure 1. Calibration standards for selected steroid compounds. The regression equations and R2 of the curves are listed in Table 2
The GC responses (represented by area in unit counts) to different concentrations of steroid compounds up to 10 mgL-1 are shown in Figure 1. Considering the values of R2 solely (Table 2) the responses of the GC were always linear to the concentrations of the samples to up to 10 mgL-1. An interesting phenomenon is that the responses tend to form curved lines toward the lower ends of the calibration standards (i.e. when concentrations are lower than 0.05 µgL-1). This may be because the responses are less accurate when close to the LOQ.
For the standard lines the average areas were obtained from triplicate standard mixtures (for each concentration, three mixtures were silylated at the same time and condition as detailed in Suprihatin, 2004, then analysed with the same method). Therefore not only is the linearity of the GC responses to each compound, but also linear responses to the silylation method shown by the diagram. This means regardless of what percentage of the compounds are derivatized during silylation process, unknown samples are quantitatively analysable within the concentrations range shown.
Table 2. Linear regressions of the steroid standards
|
Compound |
Linear Regression |
R2 (n=18) |
|
cholestane |
y = 259990 x - 590060 |
0.9973 |
|
coprostanol |
y = 374975 x - 116476 |
0.9940 |
|
epicoprostanol |
y = 393356 x - 131476 |
0.9919 |
|
cholesterol |
y = 232082 x - 761200 |
0.9949 |
|
cholestanol |
y = 259990 x - 590060 |
0.9973 |
|
campesterol |
y = 282738 x - 100391 |
0.9929 |
|
stigmasterol |
y = 208989 x - 772830 |
0.9973 |
|
ethyl cholesterol |
y = 282458 x - 103194 |
0.9954 |
|
stigmastanol |
y = 432538 x - 172494 |
0.9923 |
Sensitivity and Reproducibility
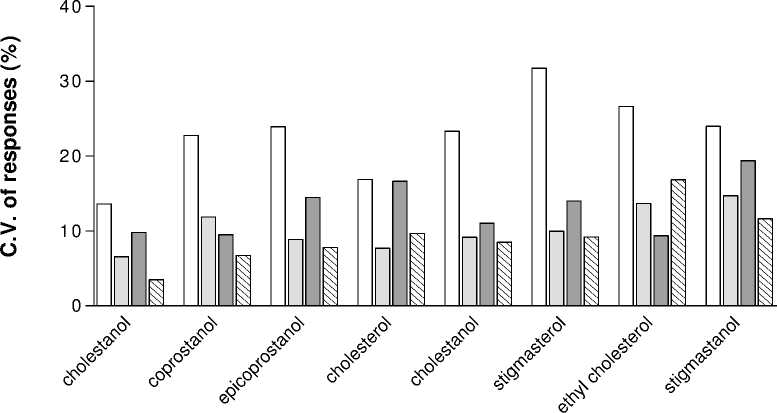
Concern arose about the sensitivity and especially the reproducibilty of the GC responses when large variations were obtained from multiple injections of a single standard mixture of 10 mgL-1 (not shown). An experiment was then conducted to calculate the size of this variation. A newly silylated 10 mgL-1 standard solution was injected 5 times in a row under a variety conditions, and the resulting coefficient of variation (C.V.) is shown in Figure 2.
The first series of the column diagram (‘w/o blank’) represents 5 injections of a single standard without blank injections between samples (Figure 2). The high C.V. suggests there are carryovers from the previous injections into subsequent ones, and a simple test to find out whether it was caused by the column or the injector was carried out by injecting a sample following by running the GC/MS without
sample. It was concluded that the carryover was caused by the injector. Series 2 on the same diagram (Figure 2. ‘w/ blank’) shows the results of attempts to remove the carryover, i.e. by injection of blanks between two samples. There was great improvement in C.V. However, injection of blanks in between is not practical for sample analysis, and so two other methods were tested, namely changing the relay method from splitless to split/splitless and in addition doubling the injector wash time (‘double wash’). The results show that changing the relay method improved the C.V. only slightly, while the combination of changing relay method and doubling the wash time resulted in a lower C.V. and thus more reproducible responses. On the basis of this experimental testing, it was decided that this final condition, namely split/splitless injection with 50 seconds wash time, was to be adopted for all future work.
w/o blank w/blank split-splitless double wash
Figure 2.
The improvement of the GC method:
showing decrease in C.V. with various injection
methods
Reliability of the Analytical M ethod
Tables 3 and 4 show the recovery of steroids from environmental and sewage samples respectively, obtained by the standard addition method, analysed using solid-liquid extraction modified from the "Bligh-Dyer" method (Bligh and Dyer, 1959) as detailed in Suprihatin, 2004. The percentages of standard recovered in the environmental samples are shown in Table 3. The recovery varied from 52 ± 5 % (ethyl
cholesterol, 5 mgL-1) to 96 ± 4 % (coprostanol, 1 mgL-1) with C.V. varied from 2 % (coprostanol, 2 mgL-1) to 13 % (stigmasterol, 1 mgL-1). Among the three different concentrations added, the lowest recoveries were obtained from the highest concentration added (5 mgL-1. Lack of particles to absorb the steroids (lower ratio of particle:steroid compared with the other concentrations) may have been the reason for this.
Table 3. Recovery (%) of steroids from environmental samples (determined) using the standard addition)
|
Compounds |
1 mgL-1 2 mgL-1 5 mgL-1 mean s.d mean s.d mean s.d |
|
Cholestane Coprostanol Epicoprostanol Cholesterol Cholestanol Stigmasterol ethylcholesterol Stigmastanol |
66 6 71 8 76 7 96 4 98 2 95 5 81 7 92 7 80 8 58 7 53 5 66 8 91 7 98 2 94 6 78 13 77 11 75 11 64 6 60 6 52 5 72 10 69 9 56 6 |
The steroid concentrations of standards recovery from sewage samples show less variation between steroids (Table 4), ranging from 63 ± 6 % (ethyl cholesterol, 10 mgL-1) to 88 ± 11 % for cholestane, 10 mgL-1 with C.V. varied from 4% (epicoprostanol, 5 mgL-1) to 11% (cholestane, 10 mgL-1). The reason for the better recovery with less variation compared to the environmental samples could be that sewage samples contain more particulate matter and are more readily homogenised.
In summary, the results show that the method used to analyse steroids recovers various amounts of individual compounds. However, statistically there was no significant difference in the mean recoveries of each compound to the variable concentration added. This means that no matter how much steroid there is in a sample, the recovery efficiency of each compound would remain within statistically similar ranges.
Table 4. Recovery of steroid (%) from sewage samples
|
Compound |
5 mgL-1 |
10 mgL-1 | ||
|
mean |
s.d |
mean |
s.d | |
|
Cholestane |
87 |
9 |
88 |
11 |
|
Coprostanol |
67 |
3 |
66 |
6 |
|
Epicoprostanol |
72 |
3 |
68 |
6 |
|
Cholesterol |
76 |
5 |
85 |
9 |
|
Cholestanol |
68 |
3 |
67 |
6 |
|
Stigmasterol |
66 |
4 |
64 |
8 |
|
Ethyl cholesterol |
71 |
4 |
63 |
6 |
|
Stigmastanol |
75 |
4 |
64 |
5 |
COCLUSION
Considerable effort and resources were delivered to the development of the quality control protocols both on the GC analysis and for the analytical method. This was without doubt essential to conduct a robust analysis with reliable and reproducible results.
The work resulted in a significant improvement in the performance of the system. The LOQ/LOD ratio was improved from 10-20 (previous work, not shown) to as low as 5 which is close to the recommended value by the Standard Method (Clesceri, et.al.,1998). Combined with the linearity of the responses at all anticipated steroid concentrations, the GC was capable of responding in a quantitatively linear manner to the steroid contents both in environmental (low range) and sewage (higher range) samples.
The great improvements in sensitivity and reproducibility contributed to the success in
using the GC/MS for quantitative analyses. The sensitivity increased up to 40 times during the practice of the quality control protocol. This means the system is able to detect low concentration with much greater accuracy, as long as the amount injected is not lower than the LOQ (i.e.. 0.001 ng). This finding is mostly valuable for the analyses of environmental samples, which generally contain low concentrations of pollutants including steroids.
The recoveries of steroids by the standard addition method demonstrate that the analytical method used to isolate steroids from both environmental and sewage samples is reliable. The method is capable of isolating all compounds tested with low standard deviations.
ACKNOWLEDGEMENT
The author would like to thank the AusAID to fund this project
REFERENCES
Bligh, E. G. and Dyer, W. J., 1959,"A Rapid Method of Total Lipid Extraction and Purification, Can. J. Biochem. Physiol, 37 (8) : 911-917
Borjesson, E., Sundin, A., Leeming, R., and Torstensson, L., 1998, New method for determination of fecal sterols in urine using non-chlorinated solvents, Journal of Chromatography B, 713 (2) : 438-442
Cathum, S. and Sabik, H., 2001, Determination of steroids and coprostanol in surface water, effluent and mussel using gas chromatography-mass spectrometry, Chromatographia, 53 : S394-S399.
Clesceri, L. S., Greenberg, A. E., and Eaton, A. D. (editor), 1998, Standard Methods for the Examination of Water and Waste Water, 20th edition, APHA., Washington DC
Jayasinghe, L. Y., Marriott, P. J., Carpenter, P. D., and Nichols, P. D., 1998,
Supercritical fluid extraction and gas chromatographic electron capture detection method for sterol analysis of environmental water samples, Analytical Communications, 35(8): 265-268
Nguyen, D. K., Bruchet, A., and Arpino, P., 1995, Determination of Sterols in Sewage Sludge by Combined in Situ Trimethylsilylation/Supercricitical Fluid
Extraction and GC/MS, Environ. Sci.Technol, 29 : 1686-1690
Nichols, P. D., Leeming, R., Rayner, M. S., and Latham, V., 1996, Use of Capillary Gas Chromatography for Measuring Faecal-Derived Sterols. Application to Storm Water, the Sea Surface Microlayer, Beach Greases, Regional Studies, and Distinguishing Algal Blooms and Human and Non-human Sources of Sewage Pollution, J. Chromatography, 733 (A) : 497-509
Piocos, E. A. and de la Cruz, A. A., 2000, Solid Phase Extraction and High Performance Liquid Chromatography with Photodiode Array Detection of Chemical Indicators of Human Fecal Contamination in Water, Journal of Liquid Chromatography & Related Technologies, 23 (8) : 1281-1291
Suprihatin, I., Fallowfield, H., Bentham, R., and Cromar, N., 2003, Determination of Faecal Pollutants in Torrens and Patawalonga Catchment Waters in South Australia Using Faecal Sterols, Water Science and Technology, 47 (7-8) : 283289
Suprihatin, I. E., 2004, Evaluation of Steroid Analyses to Determine The Sources of Faecal Pollution in Surface Waters, Dissertation
196
Discussion and feedback