MOLECULAR DETECTION OF PORK CONTAMINATION IN BEEF SOLD IN TRADITIONAL MARKETS, YOGYAKARTA, INDONESIA
on
Molecular Detection of Pork Contamination in Beef Sold in Traditional Markets, Yogyakarta, Indonesia
Wulandari, S.W., Putri, D.A., Suwartiningsih, N. & Syukroni, V.
MOLECULAR DETECTION OF PORK CONTAMINATION IN BEEF SOLD IN TRADITIONAL MARKETS, YOGYAKARTA, INDONESIA
Sri Wijayanti Wulandari1*, Diah Asta Putri2, Nurul Suwartiningsih3, Violita Syukroni4
1Laboratory of Biochemistry and Biotechnology, Department of Biology, Faculty of Applied Science and Technology, Universitas Ahmad Dahlan, Jl. Ringroad Selatan, Tamanan, Banguntapan, Bantul 55191
2Laboratory of Botany, Department of Biology, Faculty of Applied Science and Technology, Universitas Ahmad Dahlan, Jl. Ringroad Selatan, Tamanan, Banguntapan, Bantul 55191 3Biology Teaching Laboratory, Faculty of Applied Science and Technology, Universitas Ahmad Dahlan, Jl. Ringroad Selatan, Tamanan, Banguntapan, Bantul 55191
4Faculty of Biology, Universitas Gadjah Mada, Jl. Teknika Selatan, Sinduadi, Mlati, Sleman 55281
*Corresponding author, e-mail: sri.wijayanti@bio.uad.ac.id
ABSTRACT
Beef is one of the animal protein sources needed by the body to meet nutritional requirements. Consequently, fresh beef (whole or milled) is one of the highest-demanded comestibles on the market. Some meat kiosks in Yogyakarta traditional markets are also in service of milling whole meat. However, reports are stating that some kiosks are neglecting aspects concerning halal. One of those aspects is separating tools used to process beef and pork. Reports said that kiosk owners fail to meet that essential requirement causing Muslims to be at risk of consuming contaminated beef without their knowledge. Hence, this study aims to examine whether fresh and ground beef obtained from Pasar Pathuk and Pasar Kranggan, Kota Yogyakarta, is free from pork contamination. The examination was carried out using Polymerase Chain Reaction (PCR) on 14 samples of seven fresh and seven ground beef obtained from both markets. DNA isolation from all samples was done using FavorGen® FavorPrepTM Tissue Genomic DNA Extraction Mini Kit. Isolated DNA was further examined by PCR analysis using P14 and MTCB primers. Results showed that P14 primers could amplify the PRE-1 gene (481 bp) designed as a pork molecular marker only on positive control (fresh pork); meanwhile, MTCB primers could amplify the cytochrome b gene (1141 bp) designed as a mammal molecular marker on all samples involved in this research. Based on the results, we concluded that both fresh and ground beef sold in Pasar Pathuk and Pasar Kranggan, Yogyakarta are not contaminated by pork DNA.
Keywords: beef, MTCB primer, P14 primer, pork contamination
INTRODUCTION
The vast majority of the Indonesian population is Muslim. As a Muslim-majority country, the Indonesian
government must ensure that food circulating in the community is safe, of good quality, nutritious and halal-certified (Triasih et al., 2016). One of the halal
certification criteria requires that food be free from any pork elements as stated in the Quran (An-Nahl:115), “He has only forbidden you to eat carrion, blood, swine, and what is slaughtered in the name of any other than Allah. But if someone is compelled by necessity—neither driven by desire nor exceeding immediate need—then surely Allah is All-Forgiving, Most Merciful.”. Meat is the source of animal protein necessary for the body to meet nutritional needs. Meat is often milled as the main ingredient for many meat-processed food products (e. g. sausages, meatballs, and corned beef). Many people who do not have a milling machine at home would go to meat kiosks in the markets that offer milling services. Quoted by Redaksikibar (2013), several meat kiosks offer milling services in Pasar Pathuk and Pasar Kranggan that violate the basic rule of providing halal comestible; separating tools used to mill pork and beef. This becomes a substantial problem because it is a transgression of someone’s belief and an
MATERIALS AND METHODS
This research was conducted from January – to April 2021 in the Laboratory of Biochemistry and Biotechnology, Universitas Ahmad Dahlan Yogyakarta, Indonesia. All samples were collected from
eISSN: 2655-9994 pISSN: 2303-3371 https://doi.org/10.24843/IJBB.2022.v09.i02.p03
offence to Law Number (No) 8 of 1999 on Consumer Protection.
Technological advances in analyzing pork contamination have increased. One of those advances is the use of Polymerase Chain Reaction (PCR) to identify the presence of pork elements in meat-processed food. Fibriana et al. (2012) conducted a study using PCR to identify pork contamination on meatballs sold on the street of Salatiga, Central Java. One of thirteen samples of this study was found contaminated by pork meat. A similar study has been conducted in Surabaya using RT-PCR. In that study, five samples out of 30 tested positive for pork contamination on milled beef (Susilowati, 2019). However, there is limited literature on molecular identification of pork meat contamination in Yogyakarta; hence this research was conducted. Fourteen samples were used in this study. Those samples were taken from Pasar Kranggan and Pasar Pathuk, Kota Yogyakarta.
Kranggan traditional market and Pathuk traditional market, Yogyakarta City, Indonesia. Fresh pork, fresh beef, and ddH2O were used as controls in this research. Figure 1 shows research location.
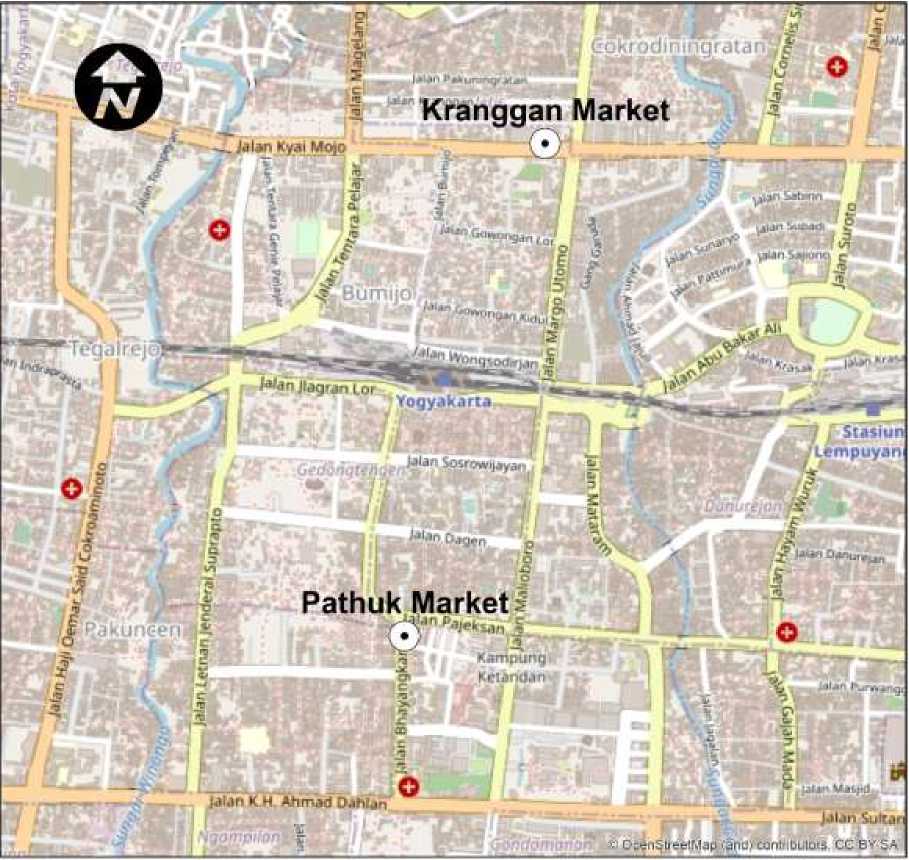
Figure 1. Locations where the samples were taken
Sample Preparation and DNA Extraction
Samples taken from traditional markets were transferred to the laboratory using a cooler box. From each sample, as much as 30 mg were milled and transferred into a 1.5 ml microtube. 200 µl FATG1 buffer, proteinase K was added into the microtube. Samples were then vortexed. Samples were incubated at 60°C for 1-3 hours. After the first incubation, 200 µl of FATG2 buffer was added and samples were incubated for the second time for 10 minutes. After the second incubation, 200 µl of 96% ethanol was added and samples
were vortexed. FATG mini columns were transferred into a collection tube and centrifuged for 1 minute (18,000 rpm). The collection tube was discarded and replaced by a new collection tube. 400 µl of W1 buffer was added to the column. Samples were then centrifuged full-speed for another 1 minute. The collection tube was discarded and replaced by a new collection tube. 750 µl wash buffer was added into the column and was centrifuged full-speed for 1 minute. The collection tube was discarded and replaced by a new 1,5 ml microtube. 100 µl elution buffer was added to the column and the column was incubated at room
temperature for 3 minutes. Samples were then centrifuged for 2 minutes. Pellet formed after centrifugation was stored at 4°C.
Qualitative and Quantitative Analysis of DNA
Qualitative analysis was carried out using 1.5% agarose gel immersed in 0.5x TAE buffer solution. 3 µl of DNA sample, 2 µl loading dye, and 5 µl GelRed were used for every well in agarose gel. The electrophoresis tank was set to 100 volts and 15 minutes. Observation of agarose gel was carried out on a UV transilluminator to detect DNA bands. Quantitative analysis
was carried out using Nanodrop.
PCR Amplification
PCR was used to amplify the target gene using two pairs of primers as shown in Table 1. P14 primers design was adapted from Fibriana et al. (2012) and the MTCB design was adapted from Naidu et al. (2012). As for PCR condition is shown in Table 2. As much as 1.2 µl DNA sample, 12.5 µl MasterMix, 1 µl primer forward and 1 µl primer reversed were mixed into each of the PCR tubes. 9.3 µl ddH2O was added to the tubes. The tubes were then placed into a PCR machine. PCR products were then stored at -20°C for further use.
Table 1. Primers Sequence
Primer Sequence
P14F 5’-CCCCGTCTCCTTCCTCCGGTGGTTGATG-3’
P14R 5’-CTGCGACACATGATGCCTTTATGTCCCAGC-3’
MTCBF 5’-CCHCCATAAATAGGNGAAGG-3’
MTCBR 5’- WAGAAYTTCAGCTTTGGG-3’
|
Table 2. PCR Condition | |
|
Condition |
Temperature Duration Cycle |
|
Pre-denaturation Denaturation Annealing Extension Final extension |
95°C 2 minutes - 95°C 45 seconds 55 °C 1 minute 72°C 1 minute 30 cycles 72°C 5 minutes |
RESULTS AND DISCUSSION
This study aims to identify pork DNA in beef (whole and milled) obtained from Pasar Pathuk and Pasar Kranggan using polymerase chain reaction (PCR). This method has a high sensitivity to detect the smallest amount of DNA present in the samples of interest. In this study, two pairs of primers were used; MTCB (mitochondrial cytochrome b) and P14.
DNA isolation was done using the FavorGen commercial kit FavorGen® FavorPrepTM Tissue Genomic DNA Extraction Mini Kit. DNA isolation consists of 3 main principles: cell destruction (lysis), separation of DNA from solid materials such as proteins and cellulose (extraction) and DNA purification (Nurhayati and Darmawati, 2017). Isolated DNA on fresh pork, fresh beef, whole and ground beef were visualized using gel electrophoresis as
a qualitative measure. The results of the visualization are shown in Figure 2.
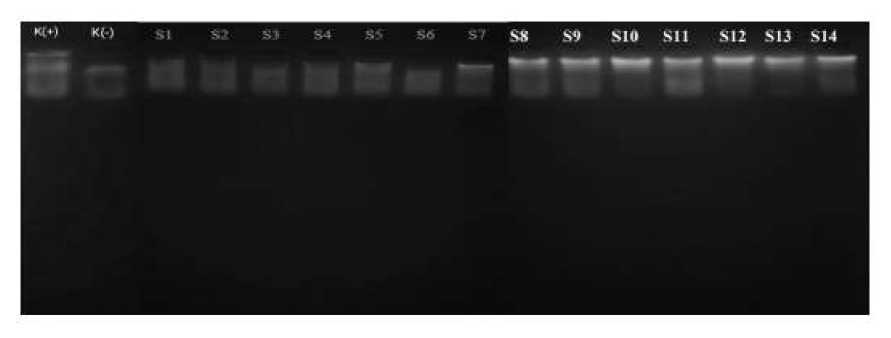
Figure 2. The result of fresh meat DNA isolation. K(+): Positive control (fresh pork); K(-): negative control (fresh beef); S1 - S7: fresh beef; S8 – S14: ground beef
Based on Figure 2, it is shown that the DNA quality of S8 – S14 samples was better compared to S1 – S7 samples. One factor that could explain this is the contaminants in the form of proteins or the remaining solution from the isolation kit (Kurniama et al. 2017 and Fatchiyah et al. 2011). Smears that appear on the bands are caused by at least two factors. The first factor is the remnants of solution from the isolation kit, the second factor is DNA degradation during isolation (Setiaputri et al. 2020 and Suparningtyas et al. 2018). Repeatedly washing DNA with ethanol could possibly clear the smear, therefore can be used as one method to purify DNA (Fatmawati et al. 2015). Samples were then further analyzed by Nanodrop as a quantitative measure to obtain DNA concentration; results are shown in Table 3.
Table 3. Measurement of Quality and Concentration of DNA Isolates
|
Sample |
A260/A280 Ratio |
Concentration of DNA (ng/µl) |
|
Positive Control |
1,746 |
103,07 |
|
Negative Control |
1,993 |
87,07 |
|
S1 |
2,018 |
162,68 |
|
S2 |
1,905 |
144,11 |
|
S3 |
1,741 |
73,74 |
|
S4 |
1,818 |
186,45 |
|
S5 |
1,987 |
75,37 |
|
S6 |
1,805 |
96,71 |
|
S7 |
1,976 |
100,63 |
|
S8 |
1,971 |
114,47 |
|
S9 |
1,993 |
209,16 |
|
S10 |
1,834 |
114,85 |
|
S11 |
1,945 |
157,06 |
|
S12 |
1,946 |
135,85 |
|
S13 |
1,832 |
45,65 |
|
S14 |
1,868 |
114,90 |
|
Average |
1,807 |
108,985 |
The measurement of DNA concentration and purity is necessary to know the degree of contamination of the isolated DNA. DNA of good quality would have an A260/A280 ratio in the range of 1.8 to 2.0. A260/A280 ratio below 1.8 indicates that DNA contains protein contaminants. Failure to break down (lysis) cell components could be the cause of protein contamination (Pratama, 2015). A260/A280
there is a certain amount of sample concentration that needs to be met to obtain high-quality amplicons (Mustafa et al., 2016 and Fatchiyah et al., 2011). The average A260/A280 ratio of 1.807 shown in Table 3 indicates that the purity of DNA isolated in this research was of good quality. Considering the good result of DNA concentration, samples were further analyzed by polymerase chain reaction
ratio above 2.0 indicates that DNA contains
(PCR). Figure 3 shows PCR products using
remnants of the RNA.
MTCB primers. Based on the results, all
Measurement of DNA concentration
samples, control meat included, were all
is also necessary for the next step of the
successfully amplified on ~1140bp.
analysis, which is PCR. That is because
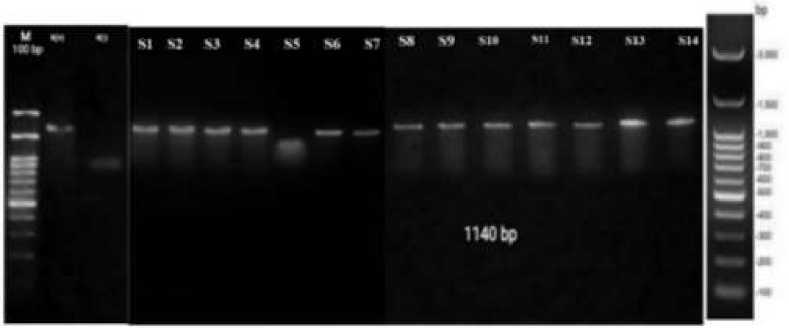
Figure 3. PCR amplification results using MTCB primers electrified in 1.2% agarose gel 100 volts; M: marker 100 bp; K(+): positive control (fresh beef); K(-): negative control (ddH2O);
S1 - S7: fresh meat samples; S8 – S14: ground beef samples
Based on the results shown in Figure 3, it is shown that the positive control (fresh beef) was amplified and the negative control (ddH2O) was not amplified. This result indicates that the PCR machine worked as expected eliminating any technical error possibility. Most samples of ground beef (S1-S7) and fresh beef (S8-S14) were successfully amplified. Bands were shown to be sharp and bright indicating high specificity of primers to the target gene. However, below the bands, there were still smears. The appearance of
smears can be caused by the quantity of Mg++, dNTP, Taq Polymerase, primer, and excess DNA templates. Another possibility is the inclusion of contaminants on the DNA template which inhibit the activity of Taq polymerase (Fatchiyah et al., 2011).
All amplified samples have a length of ~1140 bp in correspondence to Naidu et.al. (2012) who explained that the target gene, cytochrome b, has a sequence between 1140-1200 bp. It is then proven that 13 samples obtained from Pasar Pathuk and Pasar Kranggan contained meat derived
from mammals. There was one fresh beef sample (S5) which was not amplified using MTCB primers. Considering that S5 has a good A260/A280 ratio of 1,987 and DNA concentration of 75.37 ng/µl, it is possible that this sample did not contain any mammalian meat; neither beef nor pork. Nevertheless, this is an offence on Law Number (No). 8 of 1999 on Consumer Protection, specifically on Chapter IV, Verse 8, item i: “not attaching labels or making descriptions of products containing the name of the products, size, net weight/content, composition, instruction to use, date of manufacture, side effects, names and addresses of business contact persons, as well as other information for
CONCLUSIONS
Based on the results, it is concluded that fresh and ground beef obtained from milling services in Pasar Pathuk and Pasar Kranggan Yogyakarta is not contaminated by pork DNA. Further research is needed especially on the introduction of new samples from various locations. Moreover, investigation of numerous skin care products to uphold their halal status is also required.
REFERENCES
Quran Kemenag. Surah An-Nahl Verse 115 (https://quran.kemenag.go.id/sura/16/ 115)
Fatchiyah, E.L., Arumingtyas S., Widyarti, dan Rahayu, S. (2011). Biologi Molekuler Prinsip Dasar Analisis. Jakarta: Penerbit Erlangga
Fibriana, F., Widianti, T., Retnoningsih, A., dan Susanti. (2012). Deteksi Daging Babi pada Produk Bakso di Pusat Kota Salatiga Menggunakan Teknik Polymerase Chain Reaction.
Biosaintifika, 4(2), 106-112.
use that according to the provision must be created.”
Samples were then further analyzed using PCR and P14 primers which target PRE-1 as specific molecular marker for pork. As shown in Figure 3, only positive control (pork meat) was amplified at ~481 bp while all 14 samples were not amplified using P14 primers. This result indicates that P14 primers have high specificity on detecting pork meat. However, it is shown on Figure 3 that the bands were not of good quality even on the positive control. The poor quality of DNA bands can be caused by duration and voltage implemented on electrophoresis (Mustollah, 2016) and Tilawah, 2019).
ACKNOWLEDGEMENTS
We would like to express our gratitude to all parties contributing to this research: Laboratory of Biochemistry and Biotechnology Universitas Ahmad Dahlan, Laboratory of Botany Universitas Ahmad Dahlan, Laboratory of Biotechnology Universitas Gadjah Mada, and all laboratory technicians involved in this research.
https://doi.org/10.15294/biosaintifi ka.v4i2.3928
Kurniama, S.S., Mazieda, M.N., Listyorini, D., dan E. S. S. (2014). Optimization of DNA Isolation and Purification Technique From Chili Pepper (Capsicum annum L.). Seminar Nasional XI Pendidikan Biologi FKIP UNS Biologi, Sains, Lingkungan, dan Pembelajarannya. Pendidikan Biologi FKIP UNS, 11(1), 65-70
Mustafa, H., I, Rachmawati., dan Y, Udin.
(2016). Pengukuran Konsentrasi
dan Kemurnian DNA Genom Nyamuk Anopheles barbirostris. Jurnal Vektor Penyakit, 10(1), 710. 10.22435/vektorp.v10i1.6251.7
Mustollah, H. (2016). Analisa Profil Protein Gelatin Sapi dan Gelatin Babi Gummy Vitamin C Menggunakan Metode SDS-Page (Sodium Dodecyl Sulphate Poly Acrilamide Gel Elektrophoresis). Thesis.
https://repository.uinjkt.ac.id/.
Accessed on 18th of May 2021
Naidu, A., Fitak, R.R., Munguia-Vega, A., dan Culver, M. (2012). Novel Primer for Complete Mitochondrial Cytochorme b Gene Sequencing in Mammals. Molecular Ecology Resources, Volume 12, 191-196.
DOI:10.1111/j.1755-0998.2011.03078.x
Nurhayati, B., dan Darmawati, S. (2017). Biologi Sel dan Molekuler. Kementrian Kesehatan Republik Indonesia
Pratama, P. (2015). Aplikasi Real-Time PCR untuk Mendeteksi Bakteri Salmonella sp. pada Hasil Perikanan. Thesis. Bogor: Institut Pertanian Bogor
Redaksikibar, (2013). Pencemaran daging Haram di Yogyakarta. http://kibar-uk.org/2013/02/24/pencemaran-daging-haram-di-yogyakarta-bagian-1/. Accessed on 25th of September 2020
Setiaputri, A.A., Barokah, G.R., Sahaba, Muh.A.B., Arbajayanti, R.D., Fabella, N., Pertiwi, R.M., Nurilmala, M., Nugraha, R., dan Abdullah, A. (2020). Perbandingan Metode Isolasi DNA Pada Produk
Perikanan Segar dan Olahan. Jurnal Pengolahan Hasil Perikanan Indonesia, 23(3), 447-658.
https://doi.org/10.17844/jphpi.v23i 3.32314
Suparningtyas, J.F., Pramudyawardhani, O.D., Purwoko, D., dan Tajuddin, T. (2018). Analisis filogenetik beberapa klon karet dengan marka AFLP (Amplified Fragment Length Polymorphism). Jurnal
Bioteknologi & Biosains Indonesia, 5(1), 8-19.
https://doi.org/10.29122/jbbi.v5i1.2 544
Susilowati, T. (2019). Deteksi Kontaminan DNA Babi Pada Sampel Penggilingan Daging Di Pasar Surya Kota Surabaya Menggunakan Real-Time Polymerase Chain Reaction. Thesis.
Accessed on 20th of September 2020.
Tilawah, S., Sari, R., dan Apridamayanti, P. (2019). Optimasi Volume Dna Marker Dan Volume Dna Hasil Amplifikasi Gen Tetl Resistensi Antibiotik Tetrasiklin Dari Bakteri Bacillus cereus Pada Pasien Ulkus Diabetik. Jurnal Mahasiswa Farmasi Fakultas Kedokteran Untan, Volume 4. Nomor 1
Triasih, D., Heryanti, B.R., dan Kridasaksana, D. (2016). Kajian Tentang Perlindungan Hukum Bagi Konsumen Terhadap Produk Makanan Bersertifikat Halal. Jurnal Dinamika Sosial Budaya, 18(2), 214-225.
http://dx.doi.org/10.26623/jdsb.v18 i2.571
28
Discussion and feedback