CYTOLOGICAL VARIATION OF (AAG)7 REPEAT ON LETTUCE CHROMOSOMES BY FLUORESCENCE IN SITU HYBRIDIZATION (FISH)
on
INTERNATIONAL JOURNAL OF BIOSCIENCES AND BIOTECHNOLOGY • Vol. 8 No. 2 • April 2021
eISSN: 2655-9994
pISSN: 2303-3371
https://doi.org/10.24843/IJBB.2021.v08.i02.p06
CYTOLOGICAL VARIATION OF (AAG)7 REPEAT ON LETTUCE CHROMOSOMES BY FLUORESCENCE IN SITU HYBRIDIZATION (FISH)
Winny Dewi Widarmi 1,2*, Shinji Kikuchi 1, Hidenori Sassa 1, and Takato Koba 1 1Laboratory of Genetics and Plant Breeding, Graduate School of Horticulture, Chiba
University, Matsudo 648, Matsudo, Chiba 271-8510, Japan
2Corteva Agriscience (PT Dupont Agricultural Product Indonesia), Cibis Nine 10th floor, Jl. TB Simatupang No. 2, East Cilandak, South Jakarta 12560, Indonesia *Corresponding author: winnydw@yahoo.com
ABSTRACT
Cytological studies using fluorescence in situ hybridization (FISH) technique provides phylogenetical information in closely related taxa and have been widely applied for karyotyping and studying chromosomal organization and evolution in plant species. In the present study, FISH using a microsatellite sequence of (AAG)7 as the probe was performed in order to discriminate the chromosomes in four Lactuca species, i.e., L. sativa, L. serriola, L. saligna, and L. virosa. The experiment was carried out in April to September 2018 at Laboratory of Genetic and Plant Breeding of Breeding of Graduate School of Horticulture, Chiba University, Japan. Different distribution patterns of (AAG)n signals were shown on the chromosomes in the four Lactuca species studied, In L. sativa and L. serriola, FISH with (AAG)7 sequences revealed dispersed distribution patterns with one pair of bright signals, respectively. While in L. saligna and L. virosa, distinct signals with different intensities were observed in two pairs of chromosomes of L. saligna and five pairs of chromosomes of L. virosa. In conclusion, the AAG repeat signals could be used as cytogenetic landmarks for chromosome identification in Lactuca species.
Keywords: (AAG)7 repeat, FISH, microsatellite, lettuce
INTRODUCTION
Cultivated lettuce (Lactuca sativa L.) is an economically important member of the genus Lactuca, which includes closely related wild species, L. serriola, L. saligna and L. virosa. All of them have 2n = 2x =18 chromosomes, and the estimated genome size of L. sativa is 2.7 Gb, with repetitive sequences accounting for 74.2% of the genome (Koopman et al., 1998; Michelmore et al., 1994; Reyes-Chin-Wo et al., 2017). So far, karyotype analyses were carried out to
demonstrate the relationships among the cultivated lettuce and its closely related species (Haque and Godward 1985; Koopman and De Jong 1996; Lindqvist 1960; Matoba et al., 2007). Koopman et al. (1993) applied chromosome banding techniques to discriminate the chromosomes of Lactuca species. Widarmi et al. (2019) and Matoba et al. (2007) applied FISH technique using 45S and 5SrDNAs to identify the chromosomes of Lactuca species. From these studies, it was clarified that chromosomal characteristics of
L. sativa and L. serriola were almost similar to each other, while cytological features of L. saligna are slightly different from L. sativa/L. serriola, and L. virosa is significantly different from the other species.
Fluorescence in situ hybridization (FISH) using repetitive DNA sequences as the probes results in chromosome-specific hybridization patterns that allows identification of all chromosomes within a species, making this technique a powerful tool for the karyotyping and studying chromosomal organization and evolution in many plant species (Mukai et al. 1993; Pedersen and Langridge 1997; Jiang and Gill 2006).
The distribution of microsatellite (AAG)n on the chromosomes of wheat, barley, and related species in Triticeae were well studied. The sequence (AAG)5 was used as the probe for in situ hybridization to identify different chromatin classes in wheat (Cuadrado et al., 2000; 2008). The oligonucleotide sequence (AAG)7 was used for genome and chromosome identification via in situ hybridization in cultivated barley and related species of the Triticeae (Poaceae) (Pedersen et al., 1996) The sequence (AAG)9 was used for the complementary identification of all A-genome chromosomes in diploid and polyploid wheat (Badaeva et al., 2015, 2016). Also the sequence (GAA)6 was used to perform a more accurate karyotype analysis of
Zanthoxylum armatum (Luo et al., 2018). Thus, probing AAG repeats for in situ hybridization seems to be a useful diagnostic tool in cytogenetics in many plant species.
In the present investigation, we aim to perform FISH using (AAG)7 as the probe in order to clarify the possibility of using the microsatellite repetitive sequences for discrimination and/or identification of the chromosomes in Lactuca species.
MATERIALS AND METHODS
Chromosomal study of lettuce chromosomes by FISH using (AAG)7 as the probe was conducted in April to September 2018 at Laboratory of Genetic and Plant Breeding of Graduate School of Horticulture, Chiba University, Japan.
Plant materials and chromosome sample preparation
Seeds of L. sativa ‘Shinano Hope’, L. saligna, L. serriola, and L. virosa were kindly provided by Nagano Vegetable and Ornamental Crops Experimental Station, Japan. They were germinated and planted at the Graduate School of Horticulture, Chiba University, Matsudo, Japan. Root tips of 1-2 cm long were collected from the seedlings and young plants after a few weeks growth in 500mL pots. The root tips were fixed in 3 ethanol: 1 acetic acid (v/v) at 4°C for least 1 day before preparation. Fixed root tips were washed three times with distilled water, and the samples
were stored in 70% ethanol at 4°C. Chromosomes preparations were made through enzymatic maceration, i.e., root tips were digested with 10 µl enzymatic mixture (4% Cellulase Onozuka RS, Yakult; 2% Pectolyase Y-23, Kyowa; and 1% Pectinase from Aspergillus, Sigma) at 37°C for 45-90 minutes. Squashing was made in 45% acetic acid and the slides were stored at -80°C for more than12 h. The glass covers were removed by forceps for the following FISH experiment.
DNA probe preparation
The (AAG)7 probe was labelled with digoxigenin-11-dUTP (Roche) by terminal deoxynucleotidyl transferase (TdT) (Thermo Fisher Scientific) following the manufacturer’s instructions.
FISH analysis
Chromosome slides were re-fixed in 1% paraformaldehyde/1× PBS for 10 min at room temperature. Procedures for hybridization and detection were followed as those described by Kikuchi et al.(2008). The slides were counter-stained with 4,6-diamidino-2-phenylindole (DAPI) in a VectaShield antifade solution (Vector Laboratories). All FISH images were captured with an Olympus BX53 fluorescence microscope with a CCD camera (CoolSNAP MYO; Photometrics). The FISH images were processed by Metamorph, Metavue imaging series version 7.8 and edited with Adobe
Photoshop CC 2017. CHIAS IV (http://www2.kobeu.ac.jp/~ohmido/index03. htm) was used for the construction of the ideogram.
RESULTS AND DISCUSSION
RESULT
Images of mitotic metaphase of four Lactuca species visualized after FISH using (AAG)7 sequence as the probe are shown in Figure. 1.
Different distribution patterns of (AAG)n signals were shown in all four Lactuca species studied. In L. sativa and L. serriola, FISH with (AAG)7 sequences revealed dispersed distribution patterns with one pair of bright signals, respectively. While in L. saligna and L. virosa, distinct signals with different intensities were observed in two pairs of chromosomes of L. saligna and five pairs of chromosomes of L. virosa.
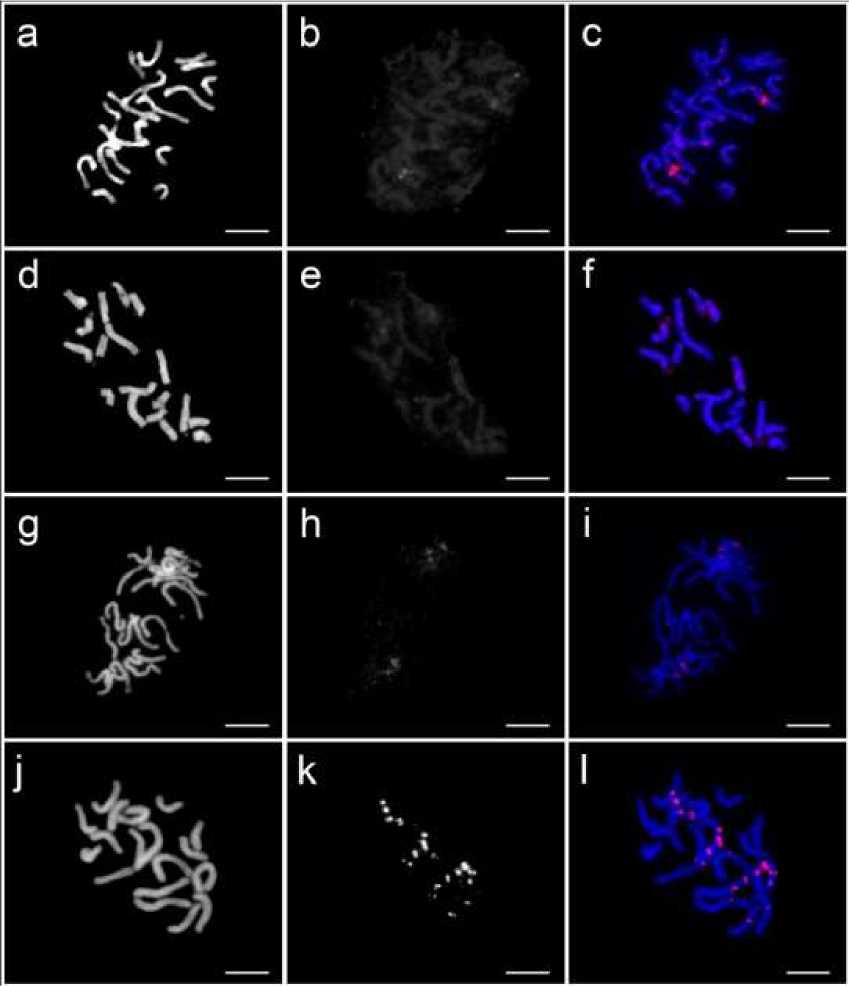
Fig. 1. FISH of (AAG)7 (red) probe in four Lactuca species. (a-c) L. sativa cv. ‘Shinano Hope’ showing dispersed signals distribution in all chromosomes and two bright signal sites of (AAG)7, (d-f) L. serriola showing dispersed signals distribution in all chromosomes with one pair of weak signals, (g-i) L. saligna showing bright signals in two pairs of chromosomes, (j-l) L. virosa showing strong signals. Scale bar=10 µm
Figure 2 shows FISH karyotypes of four Lactuca species, which were arranged according to the order of the lengths of the chromosomes based on the FISH images shown in Figure 1. Quantitative ideograms of
the prometaphase chromosomes of the four lettuce species generated by CHIAS IV based on the characteristics of condensation patterns, chromosome lengths, and FISH signals are shown in Fig. 3.
1 2 3 456789
Lactuca sattva
Lactuca somola
Lactuca sat∣gna
Lactuca virosa
Fig. 2. FISH karyotypes of four Lactuca species with (AAG)n signals. Homologous pairs of chromosomes were arranged and numbered according to their lengths. Horizontal lines show the positions of the centromeres. Scale Bar=10 µm
Dispersed signal distribution was observed in prometaphase chromosomes of L. sativa, with one pair of strong pericentromeric signals on Chromosome 1. L. serriola also showed similar dispersed distribution as those of L. sativa chromosomes, with one pair of small telomeric signals on Chromosome 2. By contrast, distinct signals were observed on L. saligna and L. virosa chromosomes. In L. saligna, Chromosomes 3 and 8 showed clear signals at the interstitial regions of the long arm and subtelomeric region of the short arm, respectively. While, in L. virosa,
Chromosome 1 had four major signals, two on the proximal region of the short and long arms, and two on the interstitial region of the long arm. Chromosome 3 showed two pairs of signals, one on the interstitial region and one on the subtelomeric region of the long arm. Chromosomes 2 and 5 showed one pair of clear signals on the long arms of the chromosomes and Chromosome 4 had one pair of signals on the proximal region of the chromosome. With their distribution patterns, Chromosomes 1 to 5 could be clearly discriminated by using (AAG)7 probe.
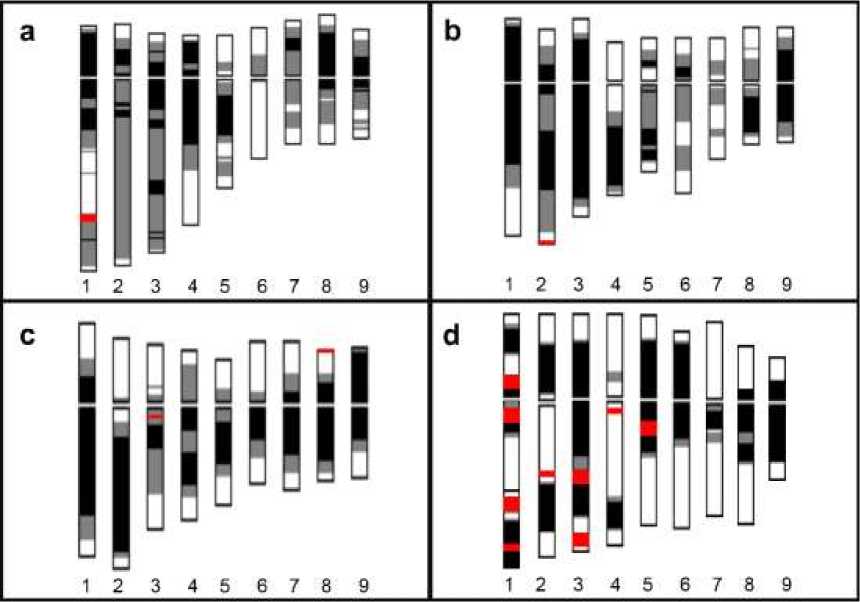
Fig. 3. FISH ideogram of prometaphase chromosomes of L. sativa (a), L. serriola (b), L. saligna (c) and L. virosa (d) with (AAG)n signals (red) constructed by CHIAS IV. Numerals denote the chromosome numbers according to their chromosome lengths. Black, gray, and white areas represent chromosome regions with heavy, intermediate and slight condensation, respectively. The gaps in the middle of the chromosomes indicate the centromere regions. Homologous pairs of chromosomes were arranged and numbered according to their lengths. Horizontal lines show the positions of the centromeres
DISCUSSION
Schmidt and Heslop-harrison (1996) demonstrated that microsatellites, representing a substantial fraction of the genome, showed chromosome-specific amplification in plants. The repeat AAG presented different in situ hybridization patterns that provided cytogenetic landmarks for chromosome identification in barley, Hordeum vulgare ssp. vulgare (Carmona et al., 2013). Also, Sonah et al., (2011)
described that AAG repeat units are major contributors to the genomes of dicots.
As shown in the previous reports (Lindqvist 1960; Koopman and De Jong 1996), the karyotype analyses indicated the closest relationship between L. sativa and L. serriola. Our results showed that karyotype of L. sativa was similar to that of L. serriola, since the dispersed signal distribution patterns of (AAG)7 repeats were similarly observed in both species studied. However, L. sativa and L. serriola could be distinguished easily by
the presence of the AAG pericentromeric and telomeric signals on the Chromosomes 1 and 2, respectively. On the other hand, L. saligna and L. virosa showed their specific karyotype features with AAG signals compare to the other two species (Figure 2). Lindqvist (1960), Haque and Godward (1985), Koopman et al., (1993), and Koopman and De Jong (1996) described that cytological features of L. saligna and L. virosa are different from those of L. sativa/L. serriola. Based on the sequence comparisons of chloroplast DNAs in Lactuca species, Wei et al. (2017) revealed that L. sativa/L. serriola group was different from that of L. saligna/L. virosa. This fact indicates that the distribution of microsatellite sequence on the chromosomes reflects the phylogenetic differentiation of the species in the genus Lactuca. Cytological analyses on the distribution of microsatellite sequences would provide insight into the phylogenetic differentiation of the species in the genus Lactuca.
CONCLUSIONS
In conclusion, the AAG repeat presented different in situ hybridization patterns that provided cytogenetic landmarks for chromosome identification in Lactuca species. These such variation results provide insight into the distribution pattern and evolution of SSRs in the genome of Lactuca.
REFERENCES
Badaeva ED, Amosova A V, Goncharov NP, Macas J, Ruban AS, Grechishnikova I V, Zoshchuk SA, Houben A, Schmid M. (2015). E-Mail A Set of Cytogenetic Markers Allows the Precise Identification of All A-Genome Chromosomes in Diploid and Polyploid Wheat. Cytogenetic and Genome Research. 146 (2015) 71–79.
doi:10.1159/000433458.
Badaeva ED, Ruban AS, Zoshchuk SA, Surzhikov SA, Knüpffer H, Kilian B. (2016). Molecular cytogenetic characterization of Triticum
timopheevii chromosomes provides new insight on genome evolution of T. zhukovskyi. Plant Systematics and Evolution. 302 (8) (2016) 943–956. doi:10.1007/s00606-016-1309-3.
Carmona A, Friero E, de Bustos A, Jouve N, Cuadrado A. (2013). Cytogenetic diversity of SSR motifs within and between Hordeum species carrying the H genome: H. vulgare L. and H. bulbosum L. Theoretical and Applied Genetics. 126(4) (2013) 949–961.
doi:10.1007/s00122-012-2028-y.
Cuadrado A, Cardoso M, Jouve N. (2008). Physical organisation of simple sequence repeats (SSRs) in Triticeae: structural, functional and evolutionary implications. Cytogenetic and Genome Research. 120(3–4) (2008) 210–219. doi:10.1159/000121069.
Cuadrado A, Schwarzacher T, Jouve N. (2000). Identification of different chromatin classes in wheat using in situ hybridization with simple sequence repeat oligonucleotides. Theoretical and Applied Genetics. 101(5–6) (2000) 711–717. doi:10.1007/s001220051535.
Haque MZ, Godward MBE. (1985). Comparison between Two Genera, Species and Cultivars in Lactuceae I.
Karyotype analysis. Cytologia 50 (1985) 725-738
Jiang J, Gill BS. (2006). Current status and the future of fluorescence in situ hybridization (FISH) in plant genome research. Genome. 49(9) (2006) 1057– 1068. doi:10.1139/G06-076.
Kikuchi S, Matsui K, Tanaka H, Ohnishi O, Tsujimoto H. (2008). Chromosome evolution among seven Fagopyrum species revealed by fluorescence in situ hybridization (FISH) probed with rDNAs. Chromosom Science. 11(1) (2008) 37–43.
Koopman WJM, Guetta E, van de Wiel CCM, Vosman B, van den Berg RG. (1998). Phylogenetic relationships among Lactuca (Asteraceae) species and related genera based on ITS-1 DNA sequences. American Journal of Botany. 85(11) (1998) 1517–1530.
doi:10.2307/2446479.
Koopman WJM, De Jong JH. (1996). A numerical analysis of karyotypes and DNA amounts in lettuce cultivars and species ( Lactuca subsect. Lactuca , Compositae). Acta Botanica
Neerlandica. 45(2) (1996) 211–222.
doi:10.1111/j.1438-8677.1996.tb00510.x.
Koopman WJM, De Jong JH, De Vries IM. (1993). Chromosome banding patterns in Lettuce species (Lactuca sect. Lactuca, Compositae). Plant
Systematics and Evolution. 185(3–4) (1993) 249–257.
doi:10.1007/BF00937661.
Lindqvist K. (1960). Cytogenetic Studies In The Serriola Group of Lactuca. Hereditas. 46(1–2) (1960) 75–151.
doi:10.1111/j.1601-5223.1960.tb03080.x.
Luo X, Liu J, Wang J, Gong W, Chen L, Wan W. (2018). FISH analysis of Zanthoxylum armatum based on oligonucleotides for 5S rDNA and
(GAA) 6. Schwarzacher T, editor. Genome. 61(9) (2018) 699–702.
doi:10.1139/gen-2018-0009.
Matoba H, Mizutani T, Nagano K, Hoshi Y, Uchiyama H. (2007). Chromosomal study of lettuce and its allied species (Lactuca spp., Asteraceae) by means of karyotype analysis and fluorescence in situ hybridization. Hereditas. 144(6) (2007) 235–243.
doi:10.1111/j.2007.0018-0661.02012x.
Michelmore RW, Kesseli R V., Ryder EJ. (1994). Genetic mapping in lettuce. Phillips, R. L. and Vasil, I. K. (eds.). DNA-Based Markers in Plants. Kluwer Academic Publishers. p. 223–239.
Mukai Y, Nakahara Y, Yamamoto M. (1993). Simultaneous discrimination of the three genomes in hexaploid wheat by multicolor fluorescence in situ hybridization using total genomic and highly repeated DNA probes. Genome. 36(3) (1993) 489–494.
doi:10.1139/g93-067.
Pedersen C, Langridge P. (1997). Identification of the entire chromosome complement of bread wheat by two-colour FISH. Genome. 40(5) (1997) 589–593. doi:10.1139/g97-077.
Pedersen C, Rasmussen SK, Linde-Laursen I. (1996). Genome and chromosome identification in cultivated barley and related species of the Triticeae (Poaceae) by in situ hybridization with the GAA-satellite sequence. Genome. 39(1):93–104. doi:10.1139/g96-013.
Reyes-Chin-Wo S, Wang Z, Yang X, Kozik A, Arikit S, Song C, Xia L, Froenicke L, Lavelle DO, Truco M-J, et al. (2017). Genome assembly with in vitro proximity ligation data and wholegenome triplication in lettuce. Nat Commun. doi:10.1038/ncomms14953.
Schmidt T, Heslop-harrison JS. (1996). The physical and genomic organization of
microsatellites in sugar beet.
Proceedings of the National Academy of Sciences of U S A. 93(16) (1996) 8761–8765.
Sonah H, Deshmukh RK, Sharma A, Singh
VP, Gupta DK. (2011). Genome-Wide
Distribution and Organization of Microsatellites in Plants: An Insight into Marker Development in Brachypodium. PLoS One. 6(6) (2011) 21298.
doi:10.1371/journal.pone.0021298.
Wei Shi-Xin Zhu G Van den Berg Freek T Bakker M Eric Schranz ZR. (2017). Phylogenetic relationships within Lactuca L. (Asteraceae), including African species, based on chloroplast DNA sequence comparisons. Genetic Resources and Crop Evolution. 64 (2017) 55–71. doi:10.1007/s10722-
015-0332-5.
Widarmi, WD., Kikuchi, S., Sassa, H., and
Koba T. (2019). Characterization of lettuce chromosomes based on condensation patterns and physical mapping of 45S and 5S rDNAs using fluorescence in situ hybridization.
Cytologia (Tokyo). 85 (1) (2019) 49
55. doi
https://doi.org/10.1508/cytologia.85.49
FACULTY OF AGRICULTURE, UDAYANA UNIVERSITY • 53
Discussion and feedback