Service Quality to Customer Satisfaction with Situational Leadership as Moderation (Case Study on Travel Agent)
on
E-Journal of Tourism Vol.8. No.2. (2021): 140-148
Service Quality to Customer Satisfaction with Situational Leadership as Moderation (Case Study on Travel Agent)
Ari Yuniarso1*, Albertha Dwi Setyorini2, Sarfilianty Anggiani2
1Bina Nusantara University, Indonesia 2Trisakti University, Indonesia
*Corresponding Author: ari_y@binus.edu
DOI: https://doi.org/10.24922/eot.v8i2.72592
Article Info
Submitted:
April 24th2021.
Accepted:
September 22th 2021.
Published:
September 30th 2021
Abstract
Covid-19 pandemic has become a major challenge for the movement of the Indonesian economy and the world. Not a few people who have to accept a pay cut policy, some are laid off for a while, and even have to lose their jobs. So that this situation is a slap in the face to various industries, especially the tourism sector. Especially for travel agents, they face many obstacles, such as dealing with passenger funds due to canceling travel due to the Covid-19 pandemic. The study was conducted by measuring the quality of service with customer satisfaction on travel agents in a pandemic condition. The method of determining the sample used in this study is the purposive sampling method. The analytical technique used is path analysis technique. The resulted from the service quality variables has no significant effect on customers satisfaction but the customers feel the satisfactory after they doing the trip with Bali Citra Kinawa Sentosa Travel agent supported.
Keywords: Covid-19 Pandemic, service quality, customers satisfaction, travel agent
INTRODUCTION
The Covid-19 pandemic is a major challenge for the movement of the Indonesian and world economies. Not a few people have to accept the policy of cutting wages, some are temporarily dismissed, and even have to lose their jobs. This situation is certainly a slap in the face of the tourism sector. Not only tourism but several other sectors that are still related to the tourism sector were also affected. For example, the culinary sector, airlines, hotels, and also MSMEs. Tourist areas that are usually crowded with visitors now have to lose their markets. Hotels, planes, restaurants,
and souvenir traders were forced to temporarily stop their economic activities. One of the consequences felt by the tourism service business actors above is the cancellation of trips, room and place bookings as well as the worst case is that all customers ask for a refund which sometimes overwhelms these business actors, as well as the high number of tour cancellations due to the pandemic, especially related to with changes in consumer behavior trends in traveling, it is the toughest challenge for airlines and travel agents cannot return tickets for prospective passengers with cash. Because there is no cash flow to return to operations if consumers ask for a cash refund. Travel agents
expect tourists to refrain from applying for a refund, due to their travel plans being canceled due to the pandemic. They even suggested that potential affected passengers prefer the option of rescheduling their trip instead of applying for a refund. And all of that will happen in 2020, reflecting on the experience of a travel agent in Bali named PT. Bali Citra Kinawa Sentosa from March to December 2020 where there are no flights to any tourist attraction and the cancellation and refund requests are large and must be completed one by one.
According to Parasuraman, Zeit-haml & Berry (1990) in the SERVQUAL dimension measures the service action provided to customers in 5 dimensions, namely Tangibility, Reliability, Responsiveness, Assurance and Emphaty, with gaps as shown below. On the right arrangement of these dimensions to the customer satisfaction will create a good image of the travel agent. In addition, there is a factor of customer satisfaction who has experienced service rather than travel agents on their trip. In its implementation, there are psychological factors that influence, including talent, careers, organizational commitment and employess, managing work-life balance (Thompson & Bunderson; 2003). In this study the factor organizational commitment and employess to customers is more included in the criteria from the perspective of the travel agency towards its customers.
This research is intended to analyze the behavior of travel agent customers of PT Bali Citra Kinawa Sentosa in terms of services provided as well as customer satisfaction so far and reflect on the conditions of the COVID-19 pandemic, where many customers with various characters submit their complaints about the cancellation of their trips due to this pandemic.
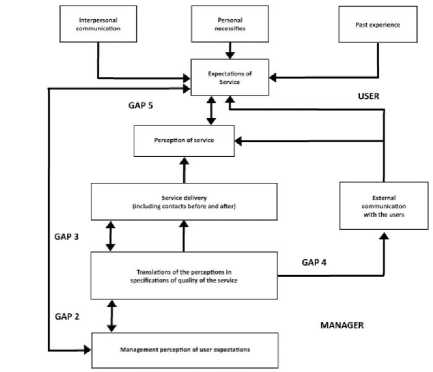
Figure 1. Quality Gap.
Source: Parasuraman, Zeithaml, Berry (1990)
LITERATURE REVIEW
Service is any action or activity that can be offered by one party to another, which is basically intangible and does not result in any ownership. The product may or may not be associated with a physical product. Often seen as a complex phenomenon. The word service itself has many meanings, from personal service to service as a product (Kotler and Armstrong, 2017). According to Kotler and Armstrong (2017: 31), services are basically all economic activities whose results are not physical products, which are usually consumed at the same time as time produced and provide added value (for example, such as comfort, entertainment, pleasure or health) or solving problems faced by consumers.
According to Tjiptono and Chandra (2011: 35), services have four main characteristics that greatly affect marketing, namely: (1) Intangibility (intangible) services have intangible characteristics but can be felt so that consumers will look for how good the quality of services provided by
the company . Consumers will draw conclusions about the quality of service from the places, people, equipment, means of communication, and the prices they see. (2) Inseparability of services is produced and felt at the same time when buyers and sellers make transactions. The buyer is also present when the service is rendered, this interaction is a feature of a service. (3) Service variability varies greatly, depending on who produces the service, when and where the service is provided. (4) Perishability (not durable), the non-durable nature of the service is not a problem if demand is constant. However, if demand is not constant, the company providing services will experience a complex demand problem.
Chang and Yeh (2017) define that service quality has a long-term effect in shaping customer satisfaction and will make customers loyal to the company. Service quality can be realized if by means of being able to meet the needs and what the customers want and properly able to match customer expectations (Tjiptono and Chandra, 2011, p.180). Meanwhile, according to Parasuraman, Zeithaml, and Berry (1988), service quality is how far the difference is between reality and expectations desired by customers..
According to Parasuraman et al (1988) there are five dimensions of service quality (in Bharwana, Bashir & Mohsin 2013): (a) Tangible (tangible), namely the appearance and ability of the company’s physical facilities and infrastructure and the condition of the surrounding environment is clear evidence of service delivery. provided by the service provider. The indicators of the tangible dimension are the appearance of physical facilities, tools and equipment as well as the appearance of employees. (b) Reliability, namely the ability of employees to provide services that have been promised with expectations in accordance with customer desires. The indicators of the dimension of reliability http://ojs.unud.ac.id/index.php/eot
are providing services as promised, being reliable in handling customers, providing accurate and precise services according to what the customer wants. (c) Responsiveness, namely how the company is able to serve what customers need quickly and precisely. The indicator of the responsiveness dimension is readiness to provide what customers need, and to provide services quickly and precisely. (d) Assurance (certainty), namely knowledge, courtesy, and the ability of employees to generate confidence and trust given to customers, to create a sense of trust in the company. The indicators of the assurance dimension are that employees have extensive knowledge, employees have a consistent polite attitude towards customers, can maintain the trust given by customers, can convince customers with professional work. (e) Empathy , namely care and personal attention given to customers. The indicators of the empathy dimension are giving individual attention to each customer, providing what customers need, the company providing the best service for customers
According to Tjiptono and Chandra (2011, p.137), there are principles that shape and maintain an appropriate environment in order to improve sustainable service quality. There are six principles that must be applied, namely: (1) Leadership: leaders must be able to direct their organization in an effort to improve service quality properly. (2) Education: all levels of company employees, from managers to operational employees, are required to get education about service quality. (3) Strategic planning: the company must measure and know the quality objectives used, so that it can direct the company to achieve its vision and mission. (4) Review: the process is an effective way to change organizational behavior, the existence of this process can ensure attention to efforts to establish quality. (5) Communication: good communication within the organization can imple-
ment a service quality strategy, be it communication with employees, customers, or with others. (6) Reward: every employee who performs must be rewarded (reward) in this way it will motivate employees to continue to increase their productivity.
Fang, Chiu, and Wang (2011) explain that customers will feel satisfied if they are served well by the company, which creates a strong perception of the services provided by the company and from there it will lead to high trust given to the company. Feelings of happiness that are obtained or generated from the buying experience (Bharwana, Bashir, and Mohsin, 2013). According to Giese and Cote (2010), in general, customer satisfaction leads to customer response, whether the customer is very satisfied with the product, the response occurs based on time, namely after the product selection, consumption, and how long the satisfaction lasts.
There are three indicators of customer satisfaction (Fang, Chiu, and Wang, 2011). (1) Satisfied with the product or service, the customer feels that the product or service provided by the company has met the desired expectations. (2) A good experience while shopping, customers who have used products or services from the company, feel that the service and quality of the goods or services provided are very damaging. (3) The perception that buying goods or services at the store is a good thing, customers will tend to go back to shopping at the company because they feel that what the company provides to customers is quite satisfying.
Customer satisfaction is determined by perceptions of service quality as well as personal factors. For efforts to improve customer satisfaction, companies must measure and monitor customer satisfaction (Tjiptono and Chandra, 2011, p. 314), namely: (1) Complaints and suggestions system: the company must provide easy and convenient access for customers in delive-
ring criticism and suggestions. . (2) Ghost shopping: the company employs several people who act as the company’s potential customers and competitors. Based on this experience they were asked to report their findings. (3) Lost customer analysis: the company calls back customers who have stopped buying for a long time to understand why this happened, and can provide policies and improvements going forward. (4) Customer satisfaction survey: the company will get direct feedback from customers, with this the customer will feel cared for by the company.
METHODS
This research uses a quantitative method, this method is used because the data that is manifested is data in the form of numbers. In addition, data processing was carried out using statistical analysis. So it can be said that this research is a quantitative research. This research method is associative, that is, research is used to find the effect of independent variables on the dependent variable. The study was conducted to determine the effect of service quality on customer satisfaction in travel agents in the Covid-19 pandemic.
The location of this research is at PT. Bali Citra Kinawa Sentosa. The research object in this study is the influence of service quality on customer satisfaction on travel agents. The type of data used is quantitative data. Quantitative data in this study were obtained through information regarding data related to service quality data with customer satisfaction in travel agents.
Sources of data in this study are primary data and secondary data. The method of collecting data in this research uses the method of observation and interviews using a research questionnaire. Data obtained and collected results from document studies, photo documentation, field observations, and interviews in 2020. The sampling met-
hod used was random sampling method in order to obtain a sample of 43 people. Analysis of the data obtained using the SPSS 25 (Statistical Product and Service Solutions) with the path analysis method.
Path Analysis is a technique for analyzing the causal relationship that occurs in multiple regression if the independent variable affects the dependent variable not only directly but also indirectly. So path analysis can be said to be an extension of multiple regression analysis, although based on history there are basic differences between path analysis that are independent of statistical procedures in determining causal relationships, while linear regression is indeed a statistical procedure used to analyze causal relationships between the studied variables.
The F test is carried out to analyze the effect of all variables, both independent and mediating, on the dependent variable together. Then proceed by using the t test to clarify the details of each influence of the variables expressed in each hypothesis. By using a significance level of 0.05 as a standard in decision making.
Based on the variables described in the literature review, the authors compile a about a hypothesis that describes the effect of service quality on customer satisfaction on travel agents in the Covid-19 pandemic.
RESULTS AND DISCUSSION
The study was conducted on 43 respondents randomly using a questionnaire method.
Table 1. Characteristics of Respondents by Gender
|
Gender |
Number of Respondents |
|
(Person) | |
|
Male |
24 |
|
Female |
19 |
|
Source : |
Primary Data, 2021 |
Based on the results of the interview, from the data received by respondents, it was found that respondents with a higher education level up to the undergraduate were 33 people compared to respondents whose education level was up to the master. However, from the results of the interview, there were no respondents with education up to doctor.
Furthermore, from the results of the respondents’ answers, analysis of the validity and reliability of the existing data was obtained, with the following results:
Table 2. Results of the Validity Test of Service Quality Variables
Item-Total Statistics
|
Scale Mean if Item Deleted |
Scale Variance if Item Deleted |
Corrected Item-Total Correlation |
Cronbach’s Alpha if Item Deleted | |
|
SQ1 |
18.85 |
2.178 |
.634 |
.763 |
|
SQ2 |
18.73 |
2.751 |
.297 |
.840 |
|
SQ3 |
19.05 |
1.698 |
.633 |
.777 |
|
SQ4 |
18.98 |
1.774 |
.886 |
.674 |
|
SQ5 |
18.93 |
2.120 |
.601 |
.770 |
Source: Primary Data (processed), 2021
Based on the results of the validity test on the service quality variable coded SQ, the corrected item total correlation value that exceeds the limit of the test number is 0.257 which is obtained from the R table for validity with a sample of 43 respondents. Thus it can be concluded that all indicators of service quality variables are valid.
Table 3. Reliability Test Results of Service Quality Variables
Reliability Statistics
Cronbach’s Alpha N of Items .809 5
Source: Primary Data (processed), 2021
Based on the results of the data reliability test for the service quality variable,
it was obtained a value of 0.809 with the Cronbach alpha value used as a condition for this reliability test with a value of 0.7. So from the Cronbach alpha value for this service quality variable is greater than the 0.7 test limit, this variable is declared reliable.
|
Table 4. Results of the Validity Test for Consumer Satisfaction Variables | ||||
|
Item-Total Statistics | ||||
|
Scale |
Scale |
Corrected |
Cron- | |
|
Mean |
Variance |
Item-Total |
bach’s Al- | |
|
if Item |
if Item |
Correla- |
pha if Item | |
|
Deleted |
Deleted |
tion |
Deleted | |
|
CS1 |
32.51 |
11.506 |
.491 |
.914 |
|
CS2 |
32.56 |
10.452 |
.801 |
.890 |
|
CS3 |
32.73 |
9.201 |
.700 |
.906 |
|
CS4 |
32.49 |
10.856 |
.818 |
.892 |
|
CS5 |
32.59 |
10.699 |
.796 |
.892 |
|
CS6 |
32.59 |
9.899 |
.814 |
.887 |
|
CS7 |
32.61 |
9.744 |
.852 |
.884 |
|
CS8 |
32.46 |
11.255 |
.536 |
.911 |
|
Source: Primary Data (processed), 2021 | ||||
Based on the results of the validity test on the customer satisfaction variable coded CS, the corrected item total correlation value that exceeds the limit of the test number is 0.257 which is obtained from the R table for validity with a sample of 40 respondents. Thus it can be concluded that all indicators of service quality variables are valid.
Table 5. Reliability Test Results of Consumer Satisfaction Variables
Reliability Statistics
Cronbach’s Alpha N of Items .909 8
Source: Primary Data (processed), 2021
Based on the results of the data reliability test for the consumer satisfaction variable, it was obtained a value of 0.909 with a Cronbach alpha value which was used as a condition for this reliability test
with a value of 0.7. So from the Cronbach alpha value for this consumer satisfaction variable is greater than the 0.7 test limit, this variable is declared reliable.
|
Table 6. Results of the Situational Leadership Variable Validity Test | ||||
|
Item-Total Statistics | ||||
|
Scale |
Scale |
Corrected |
Cronbach’s | |
|
Mean |
Variance |
Item- |
Alpha if | |
|
if Item |
if Item |
Total Cor- |
Item De- | |
|
Deleted |
Deleted |
relation |
leted | |
|
SL1 |
23.63 |
3.838 |
.881 |
.874 |
|
SL2 |
23.71 |
3.762 |
.856 |
.876 |
|
SL3 |
23.68 |
4.472 |
.449 |
.933 |
|
SL4 |
23.63 |
3.638 |
.707 |
.905 |
|
SL5 |
23.56 |
4.102 |
.815 |
.886 |
|
SL6 |
23.61 |
3.894 |
.877 |
.876 |
|
Source: Primary Data (processed), 2021 | ||||
Based on the results of the validity test on the variables of service providers who are coded EO, the corrected item total correlation value that exceeds the limit of the test number is 0.257 which is obtained from table R for validity with a sample of 40 respondents. Thus it can be concluded that all indicators of the service actor variables are valid.
Table 7. Results of Situational Leadership Variable Reliability Test
Reliability Statistics
Cronbach’s Alpha N of Items .909 8
Source: Primary Data (processed), 2021
Based on the results of the data reliability test for the service actors variable, it was obtained a value of 0.909 with a Cron-bach alpha value which was used as a condition for this reliability test with a value of 0.7. So from the Cronbach alpha value for the service actor variable is greater than the 0.7 test limit, this variable is declared reliable.
The F test is carried out to analyze
the effect of all variables, both independent and mediating, on the dependent variable together. Then proceed by using the t test to clarify the details of each influence of the variables expressed in each hypothesis. By using a significance level of 0.05 as the standard.
Table 8. Determination Coefficient Test Results
Model Summary
R Adjusted Std. Error of
Model R Square R Square the Estimate
1 .937a .878 .872 .15999
-
a. Predictors: (Constant), SL, SQ
Source: Primary Data (processed), 2021
Based on the analysis, it can be seen that the coefficient of determination or R2 = 0.878 means that 87.8 percent of the variation in customer satisfaction can be explained by variations in service quality and situational leadership, while 12.8 percent is influenced by other factors not included in the model.
Table 9. Simultas Test Results (Test F) ANOVAa
|
Model |
Sum of |
df |
Mean |
F Sig. |
|
Squares |
Square | |||
|
1 Regression |
7.400 |
2 |
3.700 |
144.545 .000b |
|
Residual |
1.024 |
40 |
.026 | |
|
Total |
8.424 |
42 | ||
|
a. Dependent Variable: CS | ||||
|
b. Predictors: (Constant), SL, SQ | ||||
Source: Primary Data (processed), 2021
Based on the results of the simultaneous analysis, the variables of service quality and customer satisfaction have a simultaneous effect on service actors at the 5 percent level of significance, this can be seen in the Prob value. The F-statistic is 0,000 which is smaller than 0.05, and the calculated F-value is 144.545. This means that the variables of service quality and customer satisfaction have a simultaneous
effect on service actors.
Table 10. Regression Test Results
Coefficientsa
|
Model B |
Unstandardized Coefficients |
Standardized Coefficients |
t |
Sig. | |
|
Std. Error |
Beta | ||||
|
1 (Constant) |
-.706 |
.316 |
-2.235 |
.031 | |
|
SQ |
.422 |
.087 |
.387 |
4.854 |
.000 |
|
SL |
.715 |
.092 |
.619 |
7.768 |
.000 |
a. Dependent Variable: CS
Source: Primary Data (processed), 2021
Based on the results of data analysis, it shows that service quality has a positive but insignificant effect on customer satisfaction as indicated by the regression coefficient of 0.422 with a significance level of 0.000 which is smaller than 0.05. This means that if the quality of service provided by travel agents PT. Bali Citra Kinawa Sentosa increases, so consumer satisfaction will increase, because good service quality will cause an increase in the desire of consumers to continue traveling with the travel agent concerned.
Meanwhile, the situational leadership variable has a positive and significant effect on travel service actors as indicated by the regression coefficient of 0.715 with a significance level of 0.000 which is smaller than 0.05. This shows that situational leadership on customer satisfaction from travel agent PT. Bali Citra Kinawa Sentosa is very good so that it can have a positive impact. The quality of the services provided interacts directly with customer satisfaction, that is, as good as the company must be able to provide all good services so that it has a good impact on what customers receive (Chou, Lu, and Chang, 2014). When the company has met the satisfaction desired by the customer, it will form a customer loyalty attitude towards the company. Meanwhile, according to Naik, Gantasala,
and Prabhakar (2010) Good customer satisfaction has an effect on profitability in almost every business. For example, when customers feel good service, each will usually tell their relatives and relatives that the company has provided good service. Most people reward businesses that treat them the way they want to be treated; they will even pay more for this service.
CONCLUSION
Based on the results of the analysis and discussion carried out through the research that has been carried out, it can be concluded that: (1) Service quality variable has a positive and significant effect on customer satisfaction at PT. Bali Citra Kinawa Sentosa. (2) The situational leadership variable has a positive and significant effect on customer satisfaction at PT. Bali Citra Kinawa Sentosa. Customer satisfaction is very good during the Covid-19 pandemic, because of the quality of service provided by the travel agent PT. Bali Citra Kinawa Sentosa is increasing, so that consumer satisfaction also increases, because good service quality will lead to an increase in consumer desire to continue the journey with the relevant travel agent.
ACKNOWLEDGEMENT
Based on the conclusions described above, the suggestions and input that can be given to PT. Bali Citra Kinawa Sentosa for future improvements are as follows:
For the company PT. Bali Citra Ki-nawa Sentosa is expected for the company to improve its service quality. Because of the variable quality of service, for the better in the future, it is necessary to prepare capabilities and readiness related to travel agents by providing training to employees in order to increase their ability to provide the best quality. It is also expected that the company maintains the level of customer
satisfaction, so it is necessary to pay attention to customer satisfaction so that there is no decline.
For future research, it is hoped that further research can complement the weaknesses of the study by increasing the number of samples, and also providing additional customer loyalty variables to add further relationships to customer satisfaction. It can also be used as material for descriptive studies of service quality
REFERENCES
Bharwana, T., Bashir, M., & Mohsin, M.
-
(2013) . Impact of service quality on customer satisfacion : a study fromser-vice sector espacialy private collage of pakistan. International Journal of Scientific and Research Publications, 2250-3153.
Chang, Y.H., Lu, C.S & Chou, P.F (2014).
Effects of service quality and customer satisfaction on customer loyalty in highspeed rail services in Taiwan. Transportmetrica A: Transport Science, 30, 83±103.
Fang, Y.H., Chiu, C.M., & Wang. E.T.G., (2011). Understanding customers satisfaction and repurchase intentions, Internet Research, 21 (4), 479±503
Giese, J., & Cote, J. (2000). Defining consumer satisfaction. Academy of Marketing Science Review, 1(1), 1±22.
Kotler, P., & Armstrong, G. (2017). Principles of marketing. United Kingdom : Pearson.
Menpar ingatkan travel agent beralih ke digital tourism. (2018). Retrieved from http://www.cnnindonesia.com
Naik, C., N., K., Gantasala, S., B., & Prabhakar, G., V. (2010). Service Quality (servqual) and its effect on customer satisfaction in retailing. European
Journal of Social Sciences, 16(2), 231±243. Pambagio,A. (2018). Data, target, dan implementasi sektor pariwisata. Retrieved from https://news. detik.com/kolom/d3886618/data-tar-get-dan-implementasisektor-pariwisa-ta
Parasuraman, A., Zeithaml, V., A., & Berry,
L., L. (1988). Servqual a multiple-item scale for measuring consumer perceptions of service quality. Journal of Retailing, 64(1), 12±40.
Tjiptono, Fandy dan Chandra, Gregorius. 2011. Service, Quality & Satisfaction.
Edisi Ketiga, Yogyakarta: ANDI issued.
http://ojs.unud.ac.id/index.php/eot
148
e-ISSN 2407-392X. p-ISSN 2541-0857
Discussion and feedback