Accommodation Business Competition in Bali: Competitive Strategy for Star Hotel in Sanur
on
E-Journal of Tourism Vol.8. No.1. (2021): 70-76
Accommodation Business Competition in Bali: Competitive Strategy for Star Hotel in Sanur
Agung Rendra Wijaya1*, Komang Gde Bendesa2, Agung Suryawan Wiranatha2
1Master Program in Tourism, Udayana University, Indonesia 2Centre of Excellence in Tourism, Udayana University, Indonesia
*Corresponding Author: rendra_wijaya29@yahoo.com
DOI: https://doi.org/10.24922/eot.v8i1.71446
Article Info
Submitted
February 9th 2021
Accepted
March 18th 2021
Published
March 31th 2021
Abstract
Sanur area, with Kuta, are two of Bali’s pioneering tourism areas. Most of the star hotels in Bali are located in these two areas. This paper is intended to determine the conditions of competition in the accommodation business in Bali Province, especially competition between star hotels in Sanur Tourism Area, as well as to elaborate the competitive strategy to maintain business sustainability. Through primary data collection by interviewing 8 managers and 14 employees at 3-star hotels in the Sanur area in 2018, the Delphi method was used to find a viable competitive strategy to choose from. The results of the SWOT analysis showed that the hotel location near the beach, and the incompleteness of MICE facilities were the main strength and weakness respectively. On the other hand, Bali’s popularity as a world-class destination and unfair price competition were the main opportunity and threat facing the accommodation business in Sanur respectively. This research found the competitive strategy to use is to intensify the use of Information Technology in the form of digitizing accommodation businesses.
Keywords: SWOT analysis, business digitization, Delphi method, Sa-nur Beach, competitive strategy
INTRODUCTION
Sanur Beach and Kuta Beach are two of the main tourism destinations in Bali. Sanur Beach, which is located in Denpasar City as the capital of Bali Province, is the favorite destination of Denpasar City. As a province that is not endowed with adequate natural resources, cultural uniqueness and beautiful landscapes are Bali’s prime potential in implementing tourism as a major sector for economic growth and the welfare of the Balinese people. The Central Bureau of Statistics noted, from January to De-
cember 2018 Bali was visited by 6,070,473 foreign tourists, an increase of 6.54 percent from the number of previous visits (BPS Bali, 2019).
Relying on the sector of providing accommodation and food & beverage which is traditionally considered to be representative of the tourism sector, as well as the agriculture, forestry and fisheries sectors, the economic growth of Bali Province in 2018 was recorded at 6.35 percent and exceeded the national economic growth. Based on current prices, the contribution of the tourism sector and the agricultural sector
in 2018 to Bali’s Gross Regional Domestic Product (GRDP) was 23.34 percent and 13.81 percent, respectively. PDRB worth Rp. 154.15 trillion. Observing the dominant role of accommodation and food & beverage businesses in the economy of Bali, it is not surprising that investment in these two types of businesses is growing massively, especially in Bali’s leading tourism destinations, such as the Sanur, Kuta, Nusa Dua, and several other destinations in Bali such as Ubud and Tulamben. In the period of year 2014-2018, the number of star-rated accommodation businesses and the number of rooms available increased drastically, as shown in Table 1.
The significant increase in the number of star hotels as well as the number of rooms available in Bali has resulted in increased competition between hotels. Sometimes, competition is counterproductive and tends to be negative occurs, especially during the low season. Observing the average growth in the number of star hotels by 27.23 percent, exceeding the growth of foreign tourist arrivals of 6.54 percent, it is not surprising that the competition between star hotels in Denpasar City - ranked second after Badung Regency from the number of star hotels in Bali, is getting tighter. Efforts to identify and identify the right competitive strategy are absolutely necessary for the accommodation business in Denpasar City, so that business sustainability can be main-
tained.
This paper is intended to determine the perceptions of star hotel managers in the Sanur Tourism Area in responding to the competition between star accommodation businesses in this area. Through this perception, a viable competitive strategy can be identified. Taking into account the number of star hotels in Denpasar City which dominantly has 3-star and 4-star qualifications (BPS Bali, 2019), the object of study was selected a 3-star hotel in Sa-nur, called Respati Beach Hotel.
LITERATURE REVIEW
Strategy needs to be managed properly. Referring to Hunger and Wheelen (2003), strategic management has at least 3 domains of discussion, including (a) precisely formulating the problems at hand; (b) implement the selected solution from the problem formulation; and (c) evaluate the outcomes and impacts for the organization from the implemented solutions. Strategy, according to Boyd (2000), can be interpreted as the optimal use of organizational resources through its interactions with markets, competitors, and various internal and / or external factors of the organization. By paying attention to this definition, strategy is an effort to match internal factors with organizational external factors that can affect organizational performance and its
Table 1. Number of Star-Rated Accommodations and Rooms in Bali, Year 2014-2018
|
Number of Star |
Year |
Annual Growth (percent) | ||||||||||
|
2014 |
2015 |
2016 |
2017 |
2018 | ||||||||
|
Hotel |
Room |
Hotel |
Room |
Hotel R |
oom |
Hotel |
Room |
Hotel |
Room |
Hotel |
Room | |
|
5 Star |
58 |
12,122 |
65 |
13,172 |
65 |
N/A |
73 |
17,357 |
73 |
13,388 |
6.09 |
2.09 |
|
4 Star |
71 |
9,354 |
76 |
9,287 |
76 |
N/A |
144 |
20,954 |
144 |
18,418 |
24.13 |
19.38 |
|
3 Star |
75 |
5,304 |
89 |
6,513 |
89 |
N/A |
229 |
19,713 |
229 |
14,846 |
43.99 |
35.98 |
|
2 Star |
25 |
1,469 |
30 |
2,014 |
30 |
N/A |
79 |
6,548 |
79 |
5,283 |
45.83 |
51.93 |
|
1 Star |
20 |
562 |
21 |
610 |
21 |
N/A |
26 |
1,705 |
26 |
992 |
7.20 |
15.30 |
|
Total |
249 |
28,811 |
281 |
31,596 |
281 |
N/A |
551 |
66,277 |
551 |
52,927 |
27.23 |
16.74 |
|
N/A: Data not available | ||||||||||||
Source: Bali Statistics Office (2019)
sustainability. A slightly different definition of strategy, which emphasizes the organization to focus on its strengths and weaknesses, was proposed by Hitt et al. (2011) which states that strategy is a commitment from all parts of the organization in realizing coordinated and integrated actions to elaborate on the core competencies of the organization and gain a competitive advantage over competitors.
Marketing is one of the activities commonly carried out by industry as a strategy to maintain and/or expand the market it already has. Referring to the definition from Kotler and Keller (2009), the marketing mix is a set of tools that companies can and usually use in gaining market advantage over their competitors. Kotler’s traditional marketing theory known as 4P’s emphasizes that the company is: (a) able to provide products and/or services according to what consumers need at a quality level that exceeds consumer expectations; (b) able to provide a fair price for the product/ service being offered in accordance with the willingness of the consumer to pay for it; (c) able to attract consumers to buy the products and/or services it offers through the delivery of information about the superiority of the product or service compared to competitors’ products/services; and (d) able to facilitate consumers who wish to consume the products and/or services produced by providing an effective and efficient distribution channel.
Observing 4P’s Kotler’s theory, it is implied that the competitive strategy of star hotel accommodation business in Sanur requires an understanding of effective techniques and methods in ‘selling’ the resulting accommodation products and/or services. Marketing effectiveness will only be achieved if the internal and external environment of the business is well understood, as stated by Boyd (2000) and Hitt et al. (2011). One technique commonly used is an analysis of Strengths, Weaknesses, Opportunities, and
Threats (SWOT). Strengths and Weaknesses describe the internal conditions of the organization, and Opportunities and Threats describe the external environmental conditions faced. These two types of environment play a very vital role in identifying the problems faced and in choosing a suitable strategy to solve organizational problems (Kotler and Keller, 2009).
METHODS
In order to identify the problems faced by the star accommodation business in Sanur and choose the appropriate competitive strategy, a 3 star hotel was assigned as the research object and involving 8 division managers and 14 employees as respondents. All division managers and employees were interviewed separately to find out the internal and external environmental conditions of the hotel. All respondents were given a questionnaire which must be filled in independently (self-administered questionnaire). The questionnaire contains a number of questions that describe the SWOT of the hotel with answers prepared in the form of a Likert scale choice. Similar method was undertaken by Sugandi, Patu-rusi and Wiranatha (2020) to study about homestay management in Lombok, and Rumere, Wiranatha and Pujaastawa (2020) to establish the development strategy of tourism destination in Jayapura City.
The hotel competitive strategy is identified using the following 3 stages: Identify the strengths, weaknesses, opportunities, and threats faced by the hotel by using the opinions of division managers. Consensus on SWOT items was obtained using the Delphi Method, in the form of a round-table meeting; Evaluating the current situation faced by the hotel by utilizing the perceptions of managers and employees. The results of the situation evaluation were arranged in a matrix form and divided into 2, namely: (a) Internal Factor Evaluaton
(IFE) Matrix, and (b) External Factor Evaluation (EFE) Matrix; Determine the hotel competitive strategy by looking at the com-binaton of he IFE Matrix and EFE Matrix, called I-E Matrix (David and David, 2016).
RESULTS AND DISCUSSIONS
The Internal Factors
Using the Delphi method, obtained 16 strength indicators and 12 weakness indicators that represent the internal environment of the hotel. The ranking results of the 16 strengths and 12 weaknesses of the hotel are shown in Table 2.
The five indicators that were perceived as dominant strengths indicate the importance of hotel accessibility, accessibility to available tourist attractions, and the factors of employee friendliness and empathy for the needs and services to tourists. Accessibility and service quality were the main determinants of industry sustainabili-
ty. On the other hand, the three indicators that were perceived as having the lowest level of importance were the location of the hotel close to the tour agent, terraced rooms, and quality human resources (HR). The last two indicators had a low level of importance (amounting to 0.038) considering that most of the competing hotels in Sanur also have them, so that the two indicators can no longer be relied upon to be a competitive advantage in the competition. The proximity of hotels to tour agents was an indicator that was considered the least important in competing. The rapid development of information technology (IT) that was used in the industry, was able to ‘get closer’ customers to product and/or service providers. It was not surprising that this indicator was perceived as having the lowest level of importance by respondents.
At the hotel weakness factors, three indicators that were considered to have the lowest level of importance for improve-
Table 2. Ranking of Strengths and Weaknesses Faced by the Hotel
|
Strengths |
Value |
Weight (W) |
Rating (R) |
Weaknesses |
Value |
Weight (W) |
Rating (R) |
|
Strategic location |
220 |
0.043 |
3.667 |
Crowded |
136 |
0.026 |
2.542 |
|
Direct access to the beach |
233 |
0.045 |
3.958 |
Performances still low |
148 |
0.029 |
2.583 |
|
Near shopping center |
199 |
0.039 |
3.542 |
Uncompetitive workers |
155 |
0.030 |
2.708 |
|
Room with terrace |
198 |
0.038 |
3.250 |
Limited facilities |
163 |
0.032 |
2.583 |
|
Qualified workers |
198 |
0.038 |
3.167 |
Lack of entertainment |
147 |
0.029 |
2.667 |
|
Quality of services |
222 |
0.043 |
3.750 |
Overbooked |
172 |
0.033 |
3.000 |
|
Hospitality |
225 |
0.044 |
3.708 |
Education |
148 |
0.029 |
2.583 |
|
Availability of Wi Fi |
207 |
0.040 |
2.833 |
Disciplines |
153 |
0.030 |
2.417 |
|
Bungalow choice |
210 |
0.041 |
3.208 |
Old equipment |
155 |
0.030 |
2.375 |
|
Room price |
199 |
0.039 |
3.250 |
Lack of meeting room |
114 |
0.022 |
2.458 |
|
Beach restaurant |
214 |
0.042 |
3.625 |
Restaurant too near with room |
138 |
0.027 |
2.833 |
|
Hotel atmosphere |
208 |
0.040 |
3.333 |
Limited breakfast menus |
174 |
0.034 |
2.500 |
|
Good reputation |
216 |
0.042 |
3.500 |
Total |
1,803 |
0.350 | |
|
Responsiveness |
222 |
0.043 |
3.542 | ||||
|
Have repeater guests |
206 |
0.040 |
3.417 | ||||
|
Near the tour agent |
172 |
0.033 |
2.833 | ||||
|
Total |
3,349 |
0.650 |
Source: Primary data (2019)
ment, respectively, were the unavailability of meeting rooms, congestion in the Sanur area, and the location of restaurants was near to tourist rooms. The unavailability of meeting rooms that had the lowest importance weight was inseparable from the type of tourists targeted not as tourists who would carry out meeting, incentive, conference, or exhibition (MICE) activities. The results of interviews with operational managers found that the market niche that the hotel targets was tourists in the elderly category (elderly tourists).
The External Factors
In the external environment of the hotel it was agreed that there were 10 indicators of opportunity along with 9 indicators of threat. The ranking results of these two types of indicators are shown in Table 3.
Observing the rating of 10 indicators of opportunities for star hotels to face competition, it was clear that the utilization of the tourist market growth (opportunity number 7) had not been optimal and the number of room orders (opportunity
number 2) was the two opportunities with the lowest average rating. With a high rating, it was clear that Bali’s popularity as a world-class destination was the greatest opportunity for hotels to address their external environment. The indicator with the second highest rating was IT development and its impact on the accommodation business. Noting that the hotel has prepared adequate IT resources and infrastructure, this indicator was a second opportunity that should be utilized optimally.
At the hotel’s threat factors, the lowest rating were found in three factors, namely the construction of new hotels in Sanur, issues regarding natural disasters, and the safety of traveling in the area. In the perception of respondents with high ratings, it can be seen that the two threats with the highest rating that describe the current situation were reduced hotel revenue from the F&B and restaurant business due to the increase in restaurant or restaurant businesses in Sanur, and an increase in hotel budgets in the area. These two indicators outperform the indicators of unhealthy
Table 3. Ranking of Opportunities and Threats Faced by the Hotel
|
Opportunities |
Value |
Weight (W) |
Rating ® |
Threats |
Value |
Weight (W) |
Rating ® |
|
Visitors increase |
180 |
0.051 |
3.208 |
Hotels’ location |
176 |
0.050 |
2.583 |
|
Room reservation increase |
179 |
0.051 |
3.125 |
Operational budget increase |
175 |
0.050 |
2.958 |
|
Online reservation |
196 |
0.056 |
3.500 |
New hotels |
156 |
0.044 |
2.375 |
|
Tourists’ activities increase |
194 |
0.055 |
3.208 |
Government’s regulation |
168 |
0.048 |
2.542 |
|
Easy to make room reservation |
219 |
0.062 |
3.542 |
Natural disaster |
181 |
0.051 |
2.375 |
|
TIC development |
215 |
0.061 |
3.583 |
Visitors’ safety |
184 |
0.052 |
2.375 |
|
Some markets have not been penetrated |
175 |
0.050 |
2.792 |
Unfair price competition |
194 |
0.055 |
2.917 |
|
Popularity of Bali |
220 |
0.062 |
3.625 |
External F&B |
183 |
0.052 |
3.042 |
|
Government promotions increase |
198 |
0.056 |
3.250 |
Negative reviews |
158 |
0.045 |
2.458 |
|
Free visa policies |
180 |
0.051 |
3.250 |
Total |
1,575 |
0.446 | |
|
Total |
1,956 |
0.554 |
Source: Primary data (2019)
room price competition, which were in the third place.
The IFE-EFE Matrix
Utilizing the previous IFAS and EFAS matrices, Internal Factor Evaluation (IFE) and External Factor Evaluation (EFE) can be prepared as a foundation for developing a hotel competitive strategy by paying attention to the internal and external environment of the hotel. IFE and EFE values are calculated using equations (1) and (2) and are used to determine the competitive position as shown in Figure 1.
IFE = Weighted Strength + Weighted Weakness(1)
IFE = = (0.043x3.667 + … + 0.033x2.833) + (0.026x2.542 + … + 0.034x2.500) IFE = 2.228 + 0.913 = 3.141
EFE = Weighted Opportunity + Weighted Threat(2)
EFE = = (0.051x3.208 + … + 0.051x2.500) + (0.050x2.583 + … + 0.045x2.458) EFE = 1.843 + 1.175 = 3.018
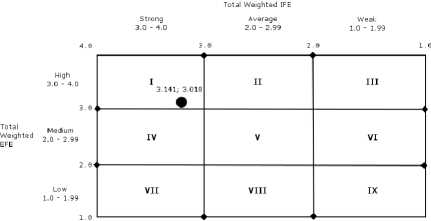
Figure 1. Choice of Hotel Competitive Position Based on IFE-EFE (I-E Matrix)
Taking into account the weighted value of IFE and EFE, respectively 3.141 and 3.018, in I-E Matrix as in Figure 1 it can be seen that the competitive position of the research object hotel is in quadrant I. Hotel must aggressively penetrate the market they have mastered, target new markets, and diversify and development of new products and or services. In addition, hotels should start to have the courage to integrate, upstream through cooperation with travel agents; downstream with tourist
attraction providers within and or outside the area.
Considering the external and internal factor, the competitive strategy for the hotel was an aggressive competitive strategy by penetrating into new markets and maintaining traditional markets and can be implemented through intensifying off-line and on-line promotions, increasing cooperation with tour operators or agents in the form of Information Technology-based e-marke-ting as an effort to increase hotel branding for tourists, and intensify the use of Information Technology in hotel operations so as to increase hotel competitiveness against similar accommodation businesses.
CONCLUSIONS
The rapid development of tourism in Bali Province has led to an increase in the number of businesses and the number of accommodation rooms available and offered to tourists. This implies that an optimal competitive strategy was needed so that business sustainability can be guaranteed. A study on the competitive strategy of star hotels in the Sanur area, by taking the research object of a three star hotel in this area, concluded: The dominant strengths of the hotel were safe and comfortable accessibility to Sanur Beach, employee friendliness, and the hotel’s strategic location very close to Sanur Beach, shopping centers and traditional markets and equipped with quality services; The main weaknesses identified included the lack of readiness of the hotel in preparing MICE facilities as well as congestion that often occurs due to the accumulation of tourism businesses in the Sanur area; The popularity of Bali as an international destination and the massive use of Information and Communication Technology with reliable service quality was an opportunity for accommodation businesses in the Sanur area; The occurrence of unhealthy price competition during the
low season and the increasing number of budget hotels were the two main threats faced by star hotels in this region; Considering the internal and external environment of the hotel, using IFE and EFE matrices, the appropriate competitive strategy used by hotels wass an aggressive competitive strategy by penetrating into new markets and maintaining ‘traditional markets’, in addition to diversifying existing products and or services offered.
This strategy could be implemented through: Increase offline and online promotions; Increasing cooperation with tour operators or agents in the form of e-mar-keting based on Information Technology as an effort to increase hotel branding for tourists; and intensifying the use of Information Technology in hotel operations, so that to increase hotel competitiveness against similar accommodation businesses.
REFERENCES
Boyd, H. W. (2000) Manajemen Pemasaran: Suatu Pendekatan Strategis dengan Orientasi Global. Jilid 1. Jakarta: Erlangga.
BPS Bali (2019) Provinsi Bali Dalam Angka 2019. Bali: BPS – Statistics of Bali
Province.
David, F. and David, F. R. (2016) Strategic management: A competitive advantage approach, concepts and cases. Pearson–Prentice Hall Florence.
Hitt, M. A. et al. (2011) ‘Strategic entrepreneurship: creating value for individuals, organizations, and society’, Academy of management perspectives, 25(2), pp. 57–75.
Hunger, J. D. and Wheelen, T. L. (2003) Strategic Management. Edisi Tiga. Yogyakarta.
Kotler, P. and Keller, K. L. (2009) ‘Manajemen Pemasaran, Jakarta: Erlangga’, Laksana. Terjemahan Fajar.
Rumere, N., Wiranatha, A. S. and Pujaasta-wa, I. B. G. (2020) ‘Planning of Country Border Area as A Tourism Destination in Jayapura City’, E-Journal of Tourism, pp. 384–398.
Sugandi, Y. B. W., Paturusi, S. A. and Wi-ranatha, A. S. (2020) ‘CommunityBased Homestay Management in the Village Tourism of Tete Batu, Lombok’, E-Journal of Tourism, pp. 369– 383.
http://ojs.unud.ac.id/index.php/eot
76
e-ISSN 2407-392X. p-ISSN 2541-0857
Discussion and feedback