The Role of Local Government in Fostering the Economic of Community:
on
E-Journal of Tourism Vol.6. No.1. (2019): 119-129
The Role of Local Government in Fostering the Economic of Community: A Lesson from Tourism Development at Nusa Penida Islands of Bali
Eka N. Kencana
Center of Excellence in Tourism Udayana University
Corresponding author: i.putu.enk@unud.ac.id
ARTICLE INFO ABSTRACT
|
Received 25 February 2019 Accepted 04 March 2019 |
For Bali and its administrative territories, tourism and the related sectors are very important for their development agendas. Referring to Bali Statistic Office, the agricultural sector and food and beverages services, contribute more than one-third of Bali’s gross regional |
|
Available online 18 March 2019 |
domestic product (PDRB) for the year 2017. It is not surprising, then, tourism and the related industries have been positioned as the important pillars for the economic development of Bali. Consisting of nine regencies or city, Klungkung, after Denpasar city as the capital of Bali, is the second smallest region with its area is 315 km square or approximately 5.59 percent of Bali area as much as 5,366.66 km square. In the last five years, the local government of Klungkung is intensively developing Nusa Penida district as a marine tourists destination. The aim of this essay is to study the causal relationship between government roles and the economic benefit of tourism for the local people. A hundred and thirteen people of Nusa Penida were questioning their perception regarding the benefits of tourism for their families. Applying variance-based SEM, this work found the roles did not directly affect the economy of local people. However, by the mediation of tourists' behavior as well as the tourism industries at Nusa Penida, the role of Klungkung’s government is significantly influence the economy of Nusa Penida people. Keywords: coastal tourism, economic benefits, Klungkung, PLSc, roles. |
INTRODUCTION
Background
Klungkung is the smallest regency amongst nine regencies/city in Bali Province. Its area covers about 5.58 percent of Bali area which is as much as
5,366.66 km squares. Refers to Klungkung Statistic Office, the economic of Klungkung in the year 2017 is dominated by the agricultural sector (BPS, 2018) with its contribution as much as 22.43 percent, then is followed by accommodation services and food and
beverage supplies around 14.44 percent. Comparing to the economic growth of Bali Province, the growth of Klungkung in the year 2017 is slightly less than Bali, i.e. 5.59 percent and 5.34 percent, respectively (BPS, 2018)(BPS Provinsi Bali, 2018). Despite these figures, tourism at Klungkung grows very fast. The number of domestic and foreign tourists visit the destinations at Klungkung increase 41.7 percent for period 2013-2017. In the year 2013, the number of domestic and foreign visitors to Klungkung was recorded 298,979; increase to 423,626 visitors in the year 2017 (BPS, 2018).
Nusa Penida islands of Klungkung is located at the southern part of this regency, is very popular for its beach panorama. In the year 2017, this district contributes almost 70 percent to the total visitors of Klungkung. Besides the beach, Nusa Penida island is well-known for the natural dolphin attraction as well as for other coastal attraction. Based on the three favorite destinations or villages on this island, i.e. Toyapakeh, Lembongan, and Jungutbatu village, tourism at Nusa Penida can generate 1.025 billion rupiahs in 2016 (BPS, 2017).
From the macroeconomic angle, no one doubts the importance of tourism development at Nusa Penida for fostering the economies of the local community. http://ojs.unud.ac.id/index.php/eot
However, to the best of our knowledge, no research has been conducted to study the influences of tourism at the microeconomic level. In addition, if the effects exist, the mechanism of tourism could give benefits to the economies of local people is still unclear. Noting these facts, our work aims to reveal the role of Klungkung’s government in fostering the economies of local people at Nusa Penida islands.
A recent study regarding the effect of local regulation on business behavior showed the local government of Badung, the center of Bali tourism, has been successfully regulated the hospitality businesses at Kuta and Nusa Dua areas. According to the leaders in both areas, tourism industries in Badung have been successful in implementing the philosophy of sustainable tourism development. Through the combination of the community needs and government development goals, by hearing the community voice and as well as in getting the local bodies to involve in local tourism development; the active participation of local people in the development process has been built and promoted (Kencana, 2016).
In accordance with the economic impacts of tourism, many researchers argued, despite the positive influences to increase people income at the destination, 120 e-ISSN: 2407-392X. p-ISSN: 2541-0857
tourism also triggers unfair competition among small-scale businesses and the increasing of consumable prices, as the two dominant negative impacts of tourism from economic views. Okazaki in his research at Palawan, the Philippines, believed the importance of community participation in tourism activities is essential for the community to get more benefits than the burden costs of it (Okazaki, 2008). The community participation as an effect of local government roles and businesses behavior has been proved significantly influence the positive as well as negative impacts the economies of host people (Chiang and Huang, 2012)(Tosun, 2002), with proper and active participation, these positive impacts would increase whilst the negative effects would reduce (Kencana, 2017)(Sanchez, 2009).
Research Objectives
Referring to the paper by Sanchez (Sanchez, 2009), there are four important elements in determining the successfulness of the development process of tourism, namely the communities’ attitudes, participation mechanism, tourism benefits, and the challenges in realizing participation. In general, there are exist some push as well as pull factors to make people want to participate and/or barrier http://ojs.unud.ac.id/index.php/eot 121
their participation. In short, economic benefits are argued as the primary motive for positive participation.
Based on those arguments, this work aims to study the roles of local Klungkung government in fostering the economic benefits for people at Nusa Penida islands regarding tourism development at this destination. The primary hypothesis in this work is the roles of local government has impacts on the economy of local people, and two secondary hypotheses are the behavior of tourists’ industries and visitors’ attitudes contribute to the people income, significantly.
METHODOLOGY
To study the influence of local government roles to the economic benefits for the local community, a hundred and fifteen people of Nusa Penida were selected as the respondents. A tested questionnairé with 5-scaled Likert’s items is administered to collect people perception regarding the proposed model which is involved 4 constructs, i.e. (1) the government's role, (2) the businesses’ behavior, (3) visitors’ attitude, and (4) the economic benefits for the local community. Prior to the distribution, the instrument was tested on a pilot study conducted at Pantai Berawa in the e-ISSN: 2407-392X. p-ISSN: 2541-0857
southern of Badung regency. This area is relatively homogenous with the beach and people of Nusa Penida. The pilot study is aimed to elaborate on the items’ validity and the instrument’s reliability.
The data for this work were collected on July 2018 at Nusa Penida by questioning the respondents about the perception regarding the government roles, the attitudes of visitors as well as the businesses’ behavior on tourism activities at this destination. They were also asked either tourism gives benefits or not for them and their family as well. The data were analyzed by implementing variancebased structural equation modeling (VB-SEM) technique in SmartPLS 3.2.4 from Ringle et al. (Ringle, Wende and Will, 2017). The structural model for this work that involves four constructs is depicted on fig. 1 with the hypotheses as follows:
H1: the local government role in developing Nusa Penida tourism successfully increase the economic benefits for the community;
H2: the local government role in developing Nusa Penida tourism is significantly affecting industries’ behavior;
H3: the local government role in developing Nusa Penida tourism is significantly influencing visitors’ attitude;
H4: the behavior of hospitality industries or businesses that are operating at Nusa Penida island is significantly contributing to the economic benefit of tourism; and
H5: visitors’ attitude is significantly contributing to the economic benefit of tourism at Nusa Penida.
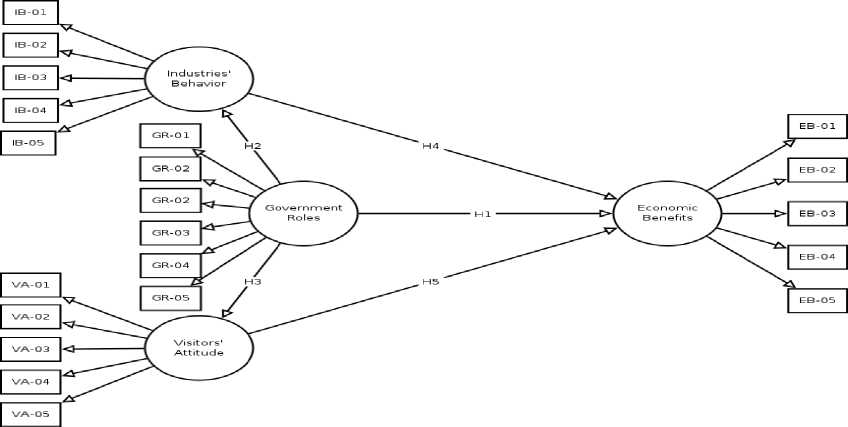
Figure 1. The Operational Model of the Research
RESULTS AND DISCUSSION
Characteristics of Respondents
After careful inspection, two of the 115 questionnaires that are filled were not eligible to be included in the analysis because of incomplete responses. The average age of the respondents is 40 years with the smallest and largest age recorded are 20 and 70 years, respectively. Judging from the length of life at Nusa Penida, on the average the respondents have lived in their village for 37 years, with a standard deviation of 14 years. In addition, most of the respondents have completed a high school or higher education level, and most of them support their families by working on the agricultural sector (7.5 per cent), micro/small industries (12.7 per cent), transportation (10.0 per cent), as well as general trade, hotels and restaurants industries (17.3 percent).
The Structural Equation Model (SEM)
Basically, the SEM consists of two sub-models, the outer or measurement model, and the inner or structural model. Referring to Hair et al. [11], both models must be checked before the inferential
were made. On SEM, the outer model will represent the relationship between a construct with its indicators, and the inner or structural model outlines the causality amongst constructs. For the outer model, the mathematical representation of the relationship between construct and its reflective indicators as follows:
xi = γ0j + γ1j ξj + δi; i = 1, …, p; j =1, …, q (1)
In equation (1), p and q represent the numbers of indicators of respective latent and the number of constructs on the developed SEM, respectively. At the analysis stage, xi and ξj are stated in the standardized form so that the γ0j is eliminated from equation (1). The summary of the analysis for the measurement model by utilizing SmartPLS 3 (Ringle, Wende and Will, 2017) is shown in Table 1. This analysis is doing by applying the consistent partial least square technique (PLSc) from (Dijkstra and Henseler, 2015) that was proven more powerful than the traditional PLS.
Table 1. The Summary of Measurement Model Analysis
Latent Variable Code and Item Description
Outer p-
Loading Value
|
Government Role |
GR-01 |
High and clearly commitment |
0.741 |
0.000 | |
|
GR-02 |
Combining top-down and bottom-up approaches |
0.547 |
0.000 | ||
|
α Value ρA Value CR |
= 0.809 = 0.860 =0.805 |
GR-03 GR-04 GR-05 |
Develop effective regulation in sustainable tourism Consistent law enforcement Actively in fostering the local participation |
0.784 0.735 0.588 |
0.000 0.000 0.000 |
|
AVE |
= 0.432 | ||||
|
GR-06 |
Actively in fostering the involvement of local bodies |
0.499 |
0.000 | ||
|
Industries’ |
IB-01 |
Prioritizing the local workforce |
0.521 |
0.000 | |
|
Behavior |
IB-02 |
Manage waste properly |
0.716 |
0.000 | |
|
α Value |
= 0.774 |
IB-03 |
Respect the local values and traditions |
0.820 |
0.000 |
|
ρA Value CR |
= 0.808 =0.781 |
IB-04 |
Actively in maintaining destination security |
0.820 |
0.000 |
|
Contributes financially to traditional activities and rituals held by local communities | |||||
|
AVE |
= 0.426 |
IB-05 |
0.454 |
0.000 | |
|
VA-01 |
Visitors easily mingle with the local community |
0.609 |
0.000 | ||
|
Visitors’ Attitude |
VA-02 |
Visitors are able to communicate with the host |
0.698 |
0.000 | |
|
α Value |
= 0.820 | ||||
|
ρA Value CR |
= 0.839 =0.820 |
VA-03 |
Visitors appreciate the traditions and culture of local people |
0.852 |
0.000 |
|
AVE |
= 0.484 |
VA-04 |
Visitors respect the holy areas in the destination |
0.756 |
0.000 |
|
VA-05 |
Contribute financially to traditional activities |
0.515 |
0.000 | ||
|
Host Perception of |
EB-01 |
Increasing employment opportunities |
0.791 |
0.000 | |
|
Economic Benefit |
EB-02 |
Increasing business opportunities |
0.973 |
0.000 | |
|
α Value |
= 0.758 | ||||
|
ρA Value |
= 0.881 |
EB-03 |
Increasing the income of family members |
0.727 |
0.000 |
|
CR |
=0.789 |
EB-04 |
Increasing the quality of public facilities |
0.375 |
0.002 |
|
AVE |
= 0.466 |
EB-05 |
Increasing the number of public facilities |
0.297 |
0.002 |
Note:
α value = Alpha (Cronbach) coefficient
ρA Value = Rho (Dijsktra) coefficient
CR = Composite Reliability
AVE = Average Variance Extracted
The highlighted numbers are below the threshold
Table 1 shows all of the constructs have some invalid items (the outer loading values is less than 0.70 as the lowest threshold (Hair et al., 2014)) and the average variance extracted (AVE’s) of all constructs less than suggested as much as 0.50 (Peng and Lai, 2012). Referring to
this finding, the indicator with the smallest outer loading for each respective construct is eliminated, and then the outer model is re-analyze sequentially until the remaining items have values fall within desirable criteria. At the final stage, one indicator of visitors’ attitude, two indicators of
industries’ behavior and the economic benefit constructs, and three indicators of government roles were eliminated. The
final measurement (after the invalid indicators were eliminated) quality of each construct is depicted in Fig. 2:
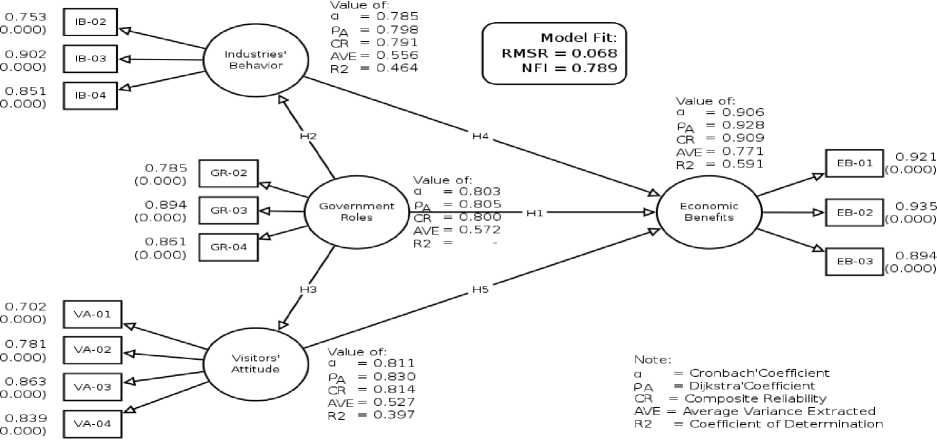
Figure 2. The Measurement Quality of Constructs
For a latent variable or construct with reflective indicators, besides the loading values and the AVE’s, the researcher has to validate the composite reliability (CR), the ρA or Dijkstra’s coefficient, and the discriminant validity of a construct. The lower bound of the CR and ρA are 0.70 (Park, 2009) and 0.70 (Dijkstra, Ringle and Henseler, 2015), respectively. As depicted in Fig. 2, all the remaining indicators have outer values above 0.70 and four constructs have the AVE’s, the α’s, the ρA’s, and the CR’s are greater than the thresholds were suggested. From this finding, the inner or structural model is valid to be analyzed.
Utilizing the bootstrap procedure
on SmartPLS that was set to run for 5,000 sub-samples, we checked our structural model. This model represents the significance of the causal relationship between exogenous and endogenous construct, directly or indirectly through mediation or moderation of another construct. The results are listed in Table 2. Referring to Fig. 1 and Fig. 2, there are five hypotheses about the direct effects of an exogenous to its respective endogenous one. Table 2 showed two out of these hypotheses could not be accepted at 5 percent of significance level, namely the direct effect of government roles and industries’ behavior on the economic benefits perceived by the local community.
The other three paths demonstrate the significance of exogenous’ effect on its respective endogenous construct.
To infer the determination coefficient of an endogenous construct (R2), we follow the criterion suggested by Chin (1998) in Kencana and Manutami (2017). According to Chin, the threshold values to declare an endogenous construct is weak, moderate, or substantial are 0.19, 0.33, and 0.67. Noting the R2s of three endogenous constructs are greater than 0.33 but less than 0.67, we argued all of them have been moderately explained by its exogenous one.
The last step in conducting SEM is assessing the model fit. Some criterion has been proposed to approximate the fitted model. According to Henseler, Hubona and Ray (2016), currently, the only available model criterion fit is the standardized root mean square residual (RMSR) with the cut-off value of 0.08 is accepted for stating the PLS model has an adequate power to explain the causal relationship amongst constructs. For the final model, we got the RMSR of 0.068, is less than the cut-off value. This finding assures us to go further in establishing the interpretation of the hypotheses.
Table 2. The Summary of Structural Model Analysis
|
Type of Effect |
The Constructs |
Hypothesis |
Path value |
p-value | ||
|
Exogenous |
Mediation |
Endogenous | ||||
|
Direct Effects |
Visitors’ attitude |
— |
Economic benefits |
H5 |
0.529 |
0.000 |
|
Industries’ behavior |
– |
Economic benefits |
H4 |
0.192 |
0.141 | |
|
Government roles |
— |
Visitors’ attitude |
H3 |
0.515 |
0.000 | |
|
Government roles |
– |
Industries’ behavior |
H2 |
0.546 |
0.000 | |
|
Government roles |
— |
Economic benefits |
H1 |
0.023 |
0.855 | |
|
Indirect Effects |
Government roles |
Industries’ behavior |
Economic benefits |
– |
0.105 |
0.149 |
|
Government roles |
Visitors’ attitude |
Economic benefits |
— |
0.272 |
0.008 | |
|
Total Effects |
Visitors’ attitude |
— |
Economic benefits |
— |
0.529 |
0.000 |
|
Industries’ behavior |
– |
Economic benefits |
– |
0.192 |
0.141 | |
|
Government roles |
— |
Visitors’ attitude |
— |
0.515 |
0.000 | |
|
Government roles |
– |
Industries’ behavior |
– |
0.546 |
0.000 | |
|
Government roles |
Industries’ Behavior and Visitors’ Attitude |
Economic benefits |
– |
0.400 |
0.000 | |
Source : own calculation (2018)
Note : the highlighted numbers showed an insignificant effect
Discussion
Our work revealed the direct effects of the government roles and industries’ behavior did not significantly contribute to the economic benefits of tourism at Nusa Penida islands, as perceived by the local communities (H1 and H4 could not be accepted). However, contrary to these findings, the local people perceived the visitors of Nusa Penida brought some positive effects on their economic (H5 is accepted).
Fig. 2 showed, from the economic perspective, the local people perceived tourism activities at their villages increase the business as well as job opportunities as the dominant impacts. The outer values for both indicators (EB-02 and EB-01) are 0.935 and 0.921, respectively.
However, by looking at the
dominant reflective indicator of the
industries’ behavior with the biggest outer loading is the industries respect the local values and traditions (IB-03), it is clear that local people did not perceive the significant effect of the tourism industries’ existence. An analogous explanation can also be made to reveal the insignificant effect of government roles in enhancing the local economies. The greatest value for the outer loading of three reflective indicators of the roles is found in developing effective regulation to assure tourism at Nusa Penida sustain (GR-03). http://ojs.unud.ac.id/index.php/eot
The insignificant effect of the local government roles in enhancing the economies of local people, directly, can not be separated from the characteristic of this research is conducted in a short time manner. Referring to Mansuri and Rao (2004), to develop community-based driven tourism, a long time horizon is needed so that the local people get the economic benefits as well as socio-cultural and environmental benefits. Meanwhile, the regulations in the short run, directly and significantly, affect industries’ behavior and visitors’ attitude. Through the power ‘to control and manage’ the tourism resources, the local government has been perceived successful in building sustainable tourism of Nusa Penida islands by developing effective business regulations and law enforcement. However, our work showed the direct (significant) effect of visitors’ attitude on the local economies. The appreciation of visitors to local traditions and/or culture in the ‘entrance fee’ as well as donation, people feel the tourists have made a direct contribution to their economies.
Despite the insignificant effect of government roles to enhance the
economies of local people directly, the roles are effectively regulated the
industries’ behavior as well as visitors’ attitudes in tourism activities at Nusa Penida islands. Noting these facts, H2 and 126 e-ISSN: 2407-392X. p-ISSN: 2541-0857
H3 cannot be rejected. Furthermore, through the roles were developed to regulate industries’ behavior and visitors of Nusa Penida, the roles of Klungkung government in fostering the economies of people at Nusa Penida have a significant effect.
In addition, by combining topdown and bottom-up philosophies to the development of the destination, the people of Nusa Penida believe their voices will be recognized and be considered in tourism planning. Leksakundilok in his research stated that combining the power of local government, tourism industries, and the capacity of local people is necessary to improve the positive impacts of tourism for the community (Leksakundilok, 2004). By the mediation of tourists’ attitudes and industries’ behavior, the effect of local government roles on the economic benefits of tourism become significant with the path value of 0.400.
CONCLUSIONS AND FURTHER RESEARCH
This work reveals the insignificant effect of business’ behavior and government’ roles, directly, in improving the economic benefits of people at Nusa Penida islands regarding the tourists’ activities in their own yards. The immediate effects of tourism at this http://ojs.unud.ac.id/index.php/eot
destination especially for the improvement of economic benefits have come from visitors’ activities. However, to make it sustainable, the local people must also empower their capacity as well as their competencies in providing qualified tourism products/services. The collaboration works amongst industries, government, the local bodies, and the other stakeholders are important to realize Nusa Penida as a community-based sustainable destination. In addition, another important finding of this work is the ability of local government roles to foster the economic benefits of tourism for people of Nusa Penida islands, in the short-run, only by the mediation of visitors’ attitude and tourism-related businesses’ behavior.
The limitation of this work is the assumption about people’s perception of villages with massively tourist’s activity is indifference from the villages that are newly developed as tourism destinations. Future researches should consider this assumption by differentiating the people according to the development phase at their village. In addition, future research is also suggested to categorize the respondents according to their status in the community. Community leaders might have a different opinion regarding the impact of tourism when it is compared to the opinion from community members.
ACKNOWLEDGMENT
This work is funded by the Faculty of Mathematics and Natural Sciences – the Udayana University of Indonesia, based on contract No. 2034/UN14.2.8.II/LT/2018, dated March 26, 2018.
REFERENCES
BPS (2017) Kecamatan Nusa Penida Dalam Angka 2017. Semarapura: BPS Kabupaten Klungkung.
BPS (2018) Kabupaten Klungkung Dalam Angka 2018. Semarapura: BPS
Kabupaten Klungkung.
BPS Provinsi Bali (2018) Provinsi Bali Dalam Angka 2018. Denpasar: BPS Provinsi Bali.
Chiang, C. and Huang, K. (2012) ‘An Examination of Antecedent Factors in Residents’ Perceptions of Tourism Impacts on a Recreational Fishing Port, Asia Pacific Journal of Tourism Research, 17(1), pp. 1–20. doi:
10.1080/10941665. 2011.613204.
Dijkstra, T. K. and Henseler, J. (2015) ‘Consistent Partial Least Squares Path Modeling’, MIS Quarterly, 39(2), pp. 297–316. doi:
10.25300/MISQ/2015/39.2. 02.
Dijkstra, T. K., Ringle, C. M. and Henseler, J. (2015) ‘Consistent and asymptotically normal PLS estimators for linear structural equations’, Computational Statistics & Data Analysis, 43, pp. 115–135. doi:
10.1007/s11747-014-0403-8.
Hair, J. F. et al. (2014) A Primer on Partial Least Squares Structural Equation Modeling (PLS-SEM). London, UK: SAGE Publications, Inc.
Henseler, J., Hubona, G. and Ray, P. A. (2016) ‘Using PLS path modeling in new technology research: updated guidelines’, Industrial Management & Data Systems, 116(1), pp. 2–20. doi: 10.1108/IMDS-09-2015-0382.
Kencana, E. N. (2016) ‘Participation of Balinese Toward Tourism Can Government and Tourism Industries Affect Participation?’, in
International Tourism Conference: Promoting Cultural and Heritage Tourism. Bali: Udayana University and SORBONNE University, pp. 1–3.
Kencana, E. N. (2017) ‘Participation of Balinese Toward Tourism and Its Impacts: Case Study at Kuta and Nusa Dua Areas of Bali, Indonesia’, in International Statistic Conference. Denpasar: International Statistical
Institute, pp.1–12.
Kencana, E. N. and Manutami, T. (2017) ‘Structural Model to Evaluate the Effect of Community Participation on Ecotourism Sustainability’, Journal of Physics: Conf. Series, (012030), pp. 1–6. doi: 10.13140/RG.2.1.4527.7525.
Leksakundilok, A. (2004) Ecotourism and Community-based Ecotourism in the Mekong Region. 10. Sydney.
Mansuri, G. and Rao, V. (2004) ‘Community-based and -driven development: A critical review’,
World Bank Research Observer, 19(1), pp. 1–39. doi: 10.1093/wbro/ lkh012.
Okazaki, E. (2008) ‘A community-based tourism model: Its conception and use’, Journal of Sustainable Tourism, 16(5), pp. 511–529. doi:
10.1080/096695808021 59594.
Park, S. Y. (2009) ‘An analysis of the technology acceptance model in
understanding university students’ behavioral intention to use e
learning’, Journal of Educational Technology & Society, 12(3), pp. 150– 162. doi: 10.1007/ s00340-009-3513-0.
Peng, D. X. and Lai, F. (2012) ‘Using partial least squares in operations management research: A practical guideline and summary of past research’, Journal of Operations Management. Elsevier B.V., 30(6),
pp. 467–480. doi: 10.1016/j.jom.
2012.06.002.
Ringle, C. M., Wende, S. and Will, A. (2017) ‘SmartPLS 3.2’.
Sanchez, J. (2009) Local participation as a tool for tourism development in La Guajira, Colombia, MA European Tourism Management. Universidad Rey Juan Carlos, Madrid.
Tosun, C. (2002) ‘Host perceptions of impacts: A comparative tourism
study’, Annals of Tourism Research, 29(1), pp. 231–253. doi:
10.1016/S0160-7383(01) 00039-1.
http://ojs.unud.ac.id/index.php/eot
129
e-ISSN: 2407-392X. p-ISSN: 2541-0857
Discussion and feedback