Rapid Growth of Hotels in Yogyakarta and Its Relation to the City's Water Supply
on
E-Journal of Tourism Vol.6. No.1. (2019): 43-51
Rapid Growth of Hotels in Yogyakarta and Its Relation to the City's Water Supply
Odilia Renaningtyas Manifesty
Department of Architecture and Planning, Faculty of Engineering Universitas Gadjah Mada
Corresponding author: odilia.r.m@ugm.ac.id
ARTICLE INFO ABSTRACT
|
Received 10 December 2018 |
As a tourist destination, Yogyakarta offers a complete tourism package from man-made environments such as Ullen Sentalu Museum and the |
|
Accepted 07 February 2019 Available online 18 March 2019 |
ancient temples to natural environment such as Mount Merapi. Roughly five million tourists, both locals and foreigners, were visiting the city in 2017. The high number of tourist visits generates high demand for accommodation and as a result, the hospitality business is flourishing and more hotels are to be built. This phenomenon is causing public unrest regarding the environmental carrying capacity. This paper would like to explore the scientific background of the people’s concern regarding the growth of hotels development and its relation towards water shortage in several parts of the city. In this study, two sets of urban layer related to water supply and numerical data related to water demand are presented. The data shows that water demands for hotels keep increasing from time to time while the water supply and distribution system are clearly limited. Additionally, the water need for hotels is ten times higher than those of residential areas, indicating that the aforementioned public unrest makes sense and that further solution needs to be considered. Keywords : tourist accommodation, clean water supply, urban tourism |
|
INTRODUCTION |
journalist. The movie discussed the social unrest in Miliran and Karangwuni district |
|
Background Cited from viva.co.id, in August 2016, a documenter video was launched at |
of Yogyakarta who was experiencing water shortage after hotels and apartments were built in the surrounding area. On the |
|
the Universitas Gadjah Mada’s university club titled “Jogja Darurat Air” (lit. Jogja Water Emergecy). The movie was made by Teguh Supriyadi, an independent |
following year, a theatrical protest involving mud and sand bath was performed in front of a hotel in Umbulharjo, Yogyakarta. |
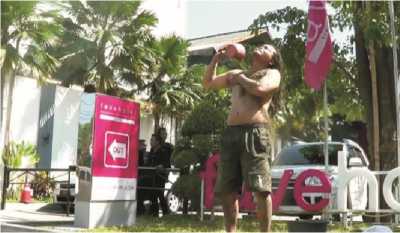
Figure 1. Theatrical protest about water
crisis issue by a resident of Yogyakarta (source: Amrta Institute of Water Literacy).
As one of the main tourist destinations in Indonesia, tourists visiting Yogyakarta rose up 100% for foreign tourist and 150% for domestic tourist in the last 10 years (Dinas Kepariwisataan DIY 2016). The high tourist visit is followed by the tourism-related industry with one of them being tourist accommodation. Since 2011, there has been a rapid growth of hotel development in Yogyakarta. On one side, the booming of tourism contributes positively to the city’s Regional Own-source Revenue, since 25.38% of the revenue comes from the tourism sector. However, on the other side, the excessive hotels development started to worry about the city’s residents. Many of the hotels are middle to high rise buildings that accommodate more than 100 rooms. Since the people of Yogyakarta live in landed and detached houses, the tall hotel buildings seem strange for them. Not only it feels like
‘visual pollution’ for several people, but the concern also gets serious when several areas are having water shortage issue and the people started to blame the hotels.
Research Objectives
Social unrests are sometimes surfaced and developed by more of public opinion than by scientific ground (Schröter, Jovanovic, and Renn 2011), even though scientific justification is important to decide the logical solution for the problem. This study does not attempt to prove whether the public claim is true or not, but rather to provide 1) deeper understanding and scientific perspective of the social unrest occurs in Yogyakarta regarding clean water shortage that is caused by the rapid growth of hotels and any other tourist accommodations, as well as 2) a partial study on the impact(s) of urban tourism towards urban livability.
LITERATURE REVIEW
Cities worldwide provide fuller amenities to both locals and tourists compared to those of suburban areas. This might be the reason why urban tourism is getting more famous today than ever (Ashworth 2012). Especially for short escape of daily routine, tourist destinations in city can provide a full service for its
visitors. Greater area of Yogyakarta, as an already famous tourist destination, offers various entertainments from nature-related spots such as Parangtritis Beach and mountain, and man-made environments such as Prambanan Temple and Kotagede Historic District. This has made Yogyakarta as one of the most visited urban areas in Indonesia according to Indonesia’s Tourism Bureau.
Tourism and city have a complicated relationship. In a way tourism may be used as a catalyst in urban development, for example to revitalize and improve decaying urban areas, bringing investment and environmental improvements (Manifesty 2017). Beside the good impact, uncontrollable urban tourism development might bring some negativity towards the city. According to Butler (1974), there are four major impacts of tourism that can influence an urban area where tourism takes place. Those are socio-cultural, economic, political, and environment (Butler 1974). The last impact has the closest relation to the built environment where people dwell. In relation to tourism, overload infrastructure development of tourist amenities might cause disturbance in urban area in term of transportation network, waste disposal, buildings regulation, and water supply (Hunter, Colin. Green 1995).
If it is not managed properly, hotels and any other touristic development and activities might take effect on the environmental carrying capacity. In urban area, there is a certain capacity which is characterized as “a property of the environment and its ability to accommodate a particular activity without unacceptable impact” (Gausset Q. 2005). This capacity needs to be maintained to keep the balance between what people need and what the city can provide. In relation to this study, excessive tourist-oriented developments may deplete urban resources, such as water, fresh air, and even public space, for the local people. And when the said impact is felt by the citizens, it almost certainly will cause social unrest. A thorough study must be conducted to minimalize the negative impacts of tourism development towards the city.
METHODOLOGY
In correlation with the research background, the locus of study is Greater Area of Yogyakarta, which consists of Yogyakarta city and its surrounding neighborhoods. Within the locus, two phases of study are conducted in 2018. The first phase is the secondary data analysis to gain raw data related to the clean water shortage. The intended data, which include the city’s piping route, e-ISSN: 2407-392X. p-ISSN: 2541-0857
clean water source, groundwater depth, and water demand, are gathered from various period of time and are received from Yogyakarta’s planning, statistic, and tourism authorities. A quantitative approach is used to compare various data, especially the ones showing water need of those of hotels and other building typologies, such as housings.
The second phase of observation is analyzed with qualitative approach in the form of theoretical discussion over maps showing water distribution from its source and groundwater depth in the city areas. The maps are presented through series of periodical layers to give sense on overtime development. From the two data sets (map layers and tables), the relation between tourist accommodation and water shortage issue can be observed. Literature review and early study show indication that the aforementioned social unrest in Yogyakarta city is not just driven by public opinion but have deeper roots towards the city’s water supply.
RESULTS AND DISCUSSION
Current Condition of Yogyakarta’s Water Resources
Yogyakarta is located at the lower slope of Merapi volcano and surrounded by three rivers, Winongo in the west,
Code in the middle, and Gadjahwong in the far east. The rivers are filled with water all year, which mean their discharges are supplied by the groundwater in the surrounding area (Sudarmadji 1994). In terms of hydrogeology, the Merapi volcano plays a role as a good aquifer, an underground layer of water-bearing permeable rock, for the city. Also, the high intensity of the rainfall around the Merapi (2500mm/year), forming a good groundwater area.
This groundwater area is used by the PDAM (Perusahaan Daerah Air Minum), the national drinking water authority, as one source of their supply. The first series of maps presented on this paper show that there is a decrease in the amount of water source points from the aquifer since 1960’s till today. The decrease of the water source gives a rather serious impact on the quantity of clean water supply. In relation with the water shortage issue, many things might be the cause, for example is the increase of population. However, the physical development of the city also holds the potential to contribute as the cause of water shortage issue. Hotels, resorts, and any other tourist amenities are the kind of development that needs a lot of water in the operation. The number of the stated buildings is getting higher every year, yet
the source of water is going down.
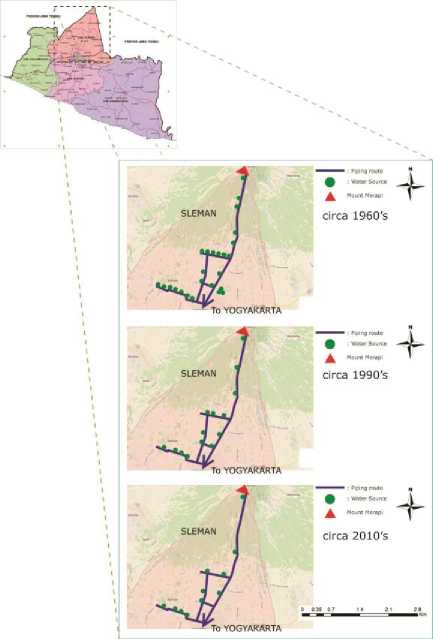
Figure 1. Distribution of water source from aquifer, drilled and developed by PDAM ( source: Author’s drawing with data from BAPPEDA DIY)
Due to the high demand of water for the said development, most of commercial buildings in Yogyakarta don‘t rely on the provision of PDAM. Instead, they make their own water source by drilling the soil to find groundwater. Of the approximately 418 hotels that are located in Yogyakarta, there were only 156 hotels up to January 2018 that are installing water supply from the Tirtamarta regional water company (PDAM) to support their businesses (Ais 2018).
However, identical with water source from aquifer, the depth where water can be extracted from ground is getting deeper every year. According to the United States Geological Survey, the deeper it needs to gain water from the ground, the worse the quality of the water is. This is because water in deep underground can contain dissolved minerals exceeds 1,000 mg/L (milligrams per liter) and can be classified as saline water which is not healthy as daily water supply (US Geological Survey 1999). Figure 2 below provides the information on the ground depth where water can be harvested. It is clearly depicted that shallow groundwater area is getting smaller, despite the higher tendency for non-residential buildings to use groundwater. Both figure 1 and 2 tell us the condition of the water source in Yogyakarta which has the tendency to go less over time.
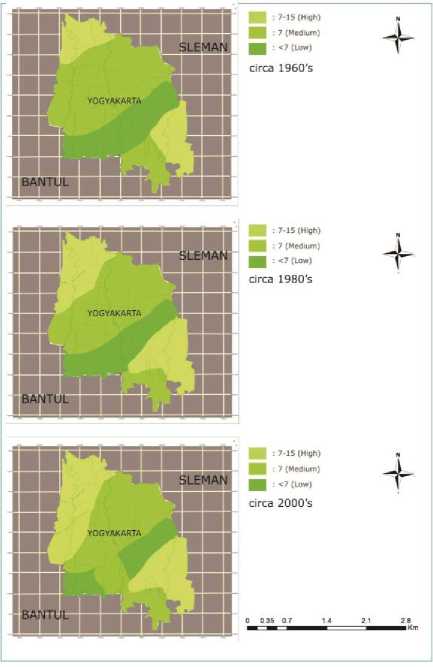
Figure 2. Groundwater depth in Yogyakarta from time to time, unit is in meter (source: Author’s drawing with data from BAPPEDA
DIY)
Clean Water Demand: Hotels vs Residentials
In the contrary with the presented figures, the number of tourist hotels in Yogyakarta climbs every year. The next three tables describe the high water demand of hotel buildings, compared to the demand by the resident’s households. The first table below shows the quantity of water needed for every urban sector per
day. The ratio of water needs for hospital and hotel is only 4:3, yet the ratio of the number of hospitals compared to hotels, according to the city statistic authority, is almost as big as 1:10. It means in Yogyakarta, even though the water demand is high for hospitals, the total number is still far behind compared to hotels.
Table 1. Standard of clean water needs in Indonesian cities
|
Sector |
Value |
Unit |
|
School |
100 |
Liter/student /day |
|
Hospital |
200 |
Liter/bed/day |
|
Clinic |
2000 |
Liter/unit/day |
|
Mosque |
3000 |
Liter/unit/day |
|
Office |
10 |
Liter/person/day |
|
Wet market |
12000 |
Liter/hectare/day |
|
Hotel |
150 |
Liter/bed/day |
|
Restaurant |
100 |
Liter/seat/day |
|
Military Complex |
60 |
Liter/person/day |
|
Industrial Area |
1.2 - 1.8 |
Liter/hectare/second |
|
Tourism Area |
0.1 – 0.3 |
Liter/hectare/second |
Source : Kriteria Perencanaan Ditjen Cipta
Karya Dinas PU, 1996 (Planning Criteria by Ditjen Cipta Karya PU, 1996)
From the aforementioned ratio we can conclude that the need of water for all hotels in Yogyakarta is huge. Moreover, in
relation to the background of this study, two tables are presented as comparison. Table 2 below shows that the demand for daily water consumption of the residents of Yogyakarta. Although it shows great amount (approximately 29,591,240 liters of daily water needed by the city population), the rate of the increase is low, about 21.8% in 30 years. Meanwhile, shown in table 3, the difference of water needs between hotels and residential is quite steep. In 30 years, the daily water need for hotels in Yogyakarta soars up from 576,952 liters to 3,401,577 liters. It means the rate increase is about 300%, more than ten times higher than the water demand rate increase of those residential areas.
Table 2. Clean Water Consumption by the Residents of Yogyakarta
|
Year (a) |
Population (b) |
Average Water Usage (Liter/day) (c) |
Average Water Needs per day (liter) (d) |
|
1980 |
398,192 |
60 |
23,891,520 |
|
1990 |
412,059 |
60 |
24,723,540 |
|
1995 |
418,944 |
60 |
25,136,640 |
|
2000 |
396,711 |
70 |
27,769,770 |
|
2005 |
435,236 |
70 |
30,466,520 |
|
2010 |
388,627 |
70 |
27,203,890 |
|
2014 |
400,467 |
70 |
28,032,690 |
|
2017 |
422,732 |
70 |
29,591,240 |
Explanation:
-
(a) = Year of the data
-
(b) = Yogyakarta City in Figures (2015)
-
(c) = Kriteria Perencanaan Ditjen Cipta
Karya Dinas PU, 1996 – 2015
-
(d) = (b) x (c)
Source : Author
Table 3. Daily water consumption for hotels in Yogyakarta
|
Room |
Average Water |
Occu pancy |
Average Water | |
|
Year |
Availa |
Usage |
Rate |
Needs |
|
(a) |
ble |
(liter/bed |
(d) |
(liter/ |
|
(b) |
/day) |
day) | ||
|
(c) |
(e) | |||
|
1980 |
5,372* |
150 |
35.8%* |
576,952 |
|
1990 |
6,107 |
150 |
36.2% |
663,220 |
|
1995 |
8,150 |
150 |
37.5% |
916,875 |
|
2000 |
8,467 |
150 |
38.4% |
975,398 |
|
2005 |
9,132 |
150 |
45.5% |
1,246,518 |
|
2010 |
9,666 |
150 |
44% |
1,275,912 |
|
2014 |
18,178 |
150 |
44% |
2,290,428 |
|
2017 |
19.847 |
150 |
57.13% |
3,401,577 |
Explanation:
-
(a) = Year of the data
-
(b) & (d) = Tourism Statistic of
Yogyakarta City (1990 - 2015)
-
(c) = Kriteria Perencanaan Ditjen Cipta Karya Dinas PU, 1996 – 2015
-
(e) = (b) x (c) x (d) x 2 (beds in 1 room, assumption)
*projected number, no data recorded for this year.
Source : Author
CONCLUSION
The overall data presented on this study shows that there is contrasting development in Yogyakarta’s clean water supply and growth of hotels. Water demands for hotels keep increasing from time to time while the supply and distribution system are limited. Furthermore, there is a high unbalance demand between the clean water for hotels and for households. In relation with the study objective, a deeper understanding regarding the social unrest is formed. Based on the data, water shortage issue raised by the people of Yogyakarta does make sense and actually is supported by scientific data. This study also provides a partial study on the impacts of urban tourism towards the city which is that rapid growth of hotels might violate certain environment carrying capacity, in the case of this study is ground water supply.
Policy Implications
The social unrest mentioned on the beginning of this paper might not be happening if there is specific and rigid law that regulates water supply for each building sector in the city. Whether a building is required to be fully supported by the public water authority or permitted http://ojs.unud.ac.id/index.php/eot 50
to use groundwater for partial need, it needs to be stated clearly in the public law. Moreover, in a more general aspect, government should takes more action in controlling the growth of hotels and possible other tourist accommodations, so that it will not disturb the citizens.
Recommendation for Future Study
To decide whether the claim made by the people of Yogyakarta is true or not, deeper analysis still need to be done and in broader and multidiscipline context such as between urban design and social science. Additional to the conclusion of this study, it’s safe to say that the water resources in the city is still able to fulfill the needs of both tourist accommodations and residential for now. The indication is that there is no news about water scarcity yet. However, looking at the data and how the demand and supply of water goes conversely, anticipation of further water issues need to be done in the form environmental research and policy making.
Acknowledgement
I would like to thank you Prof. Johannes Widodo of School of Design and Environment, National University of Singapore, for his guidance when I did the e-ISSN: 2407-392X. p-ISSN: 2541-0857
research of tourism impacts on urban livability in which this paper is partially based on.
REFERENCES
Ais. 2018. “Ratusan Hotel Di Jogja Pilih Sedot Air Tanah Ketimbang Pakai Air PDAM.” Tribun Jogja. http://jogja.tribunnews.com/2018/01/ 15/ratusan-hotel-di-jogja-pilih-sedot-air-tanah-ketimbang-pakai-air-pdam.
Ashworth, GJ. 2012. “Do We Understand Urban Tourism?” Journal of Tourism & Hospitality 01(04): 1–2.
Butler, R.W. 1974. “The Social Implications of Tourist
Development.” Annals of Tourism Research 2(2): 100–111.
https://www.sciencedirect.com/scienc e/article/abs/pii/0160738374900255.
Dinas Kepariwisataan DIY. 2016. “Statistik Dinas Kepariwisataan DIY 2016.” Statistik Kepariwisataan DIY 2016.
Gausset Q., M. Whyte and T. Birch-Thomsen. 2005. Beyond Territory and Scarcity: Exploring Conflicts over Natural Resource Management. Uppsala: Nordic Africa Institute.
Hunter, Colin. Green, Howard. 1995. Tourism and Environment: A
Sustainable Relationship? London: Routledge.
Manifesty, Odilia Renaningtyas. 2017. “The Impact of Tourism
Development towards Urban
Livability Case Study of
Yogyakarta.” National University of Singapore.
Schröter, Regina, Aleksandar S. Jovanovic, and Ortwin Renn. 2011. “Social Unrest.” OECD/IFP Project on “Future Global Shocks” 33(December): 101.
http://www.oecd.org/gov/risk/468900 18.pdf.
Sudarmadji. 1994. “Some Notes on Groundwater As A Domestic Water Supply of The Yogyakarta Municipality.” Indonesian Journal Of Geography 26(28).
https://jurnal.ugm.ac.id/ijg/article/vie w/2204.
US Geological Survey. 1999. “Quality of Ground Water.” U.S. Geological Survey General Interest Publication. https://pubs.usgs.gov/gip/gw/quality. html (August 29, 2018).
http://ojs.unud.ac.id/index.php/eot
51
e-ISSN: 2407-392X. p-ISSN: 2541-0857
Discussion and feedback