MICROBIAL ENRICHMENT PROCESS IN THE ANODE OF MICROBIAL FUEL CELL SYSTEM USING TOFU WASTEWATER (TWW) ANAEROBIC SLUDGE
on
Microbial Enrichment Process in The...
[Ibdal Satar, dkk]
MICROBIAL ENRICHMENT PROCESS IN THE ANODE OF MICROBIAL FUEL CELL SYSTEM USING TOFU WASTEWATER (TWW) ANAEROBIC SLUDGE
Ibdal Satar1*), Adi Permadi2), Siti Latifatunajib1)
1Department of Food Technology, Faculty of Industrial Technology Universitas Ahmad Dahlan (UAD) 2Department of Chemical Engineering, Faculty of Industrial Technology Universitas Ahmad Dahlan
*Email: ibdal@tp.uad.ac.id
ABSTRACT
Microbial fuel cell consisting two main components which are anode and cathode materials. In the microbial fuel cell, both anode and cathode compartments are separated with a separator. Anode generates the protons and electrons while cathode converts protons into water with the presence electrons and oxygen. During the Microbial fuel cell operation, the performance of anode is very crucial due to it provides the protons and electrons. Hence, the high efficiency microbial fuel cell is very related with the high anode performance. This work addressed to assess the enrichment process of electroactive bacteria (EAB) in anode of microbial fuel cell. In this work, some parameters such as current generations, the reduction of chemical oxygen demand (COD) content, and pH changes were used to assess the enrichment process of EAB was reached. In addition, the presence of EAB on the anode surface was identified based on the morphology of anode surface. The removal of COD and the pH value were determined by using the American public health analysis method and pH tester, respectively. The morphology of anode surface was analysed by using a scanning electron microscope. Whereas, current generation was tested by using a mustimeter. The removal of COD and final pH were obtained 71.4 % and 5.7, respectively. The optimum current generation was observed 0.19 mA. The surface morphology of anode before enriched with microbes was clear surface, while after enriched with microbes was attached by microbes. The removal of COD, pH changes, current generation and morphology of anode surface could be used to assess the EAB in the anode compartment.
Keywords: Microbial fuel cell; anode; cathode; electroactive bacteria; pH changes.
In general, a microbial fuel cell (MFC) is designed by anode and cathode compartments. Both anode and cathode are separated by specific separator such as proton exchange membrane (PEM), anion exchange membrane (AEM) or cation exchange membrane (CEM) (Greenman et al. 2021; Koók et al. 2020). Electrons can be generated by microorganisms through substrate degradation, and then they are pumped to the anode and transported to the cathode via external circuit. Meanwhile, protons are transported through membrane from anode to cathode (Pandit et al. 2017). Therefore, the presence of microorganisms on the anode
surface is one of crucial factors in the MFC systems.
Microorganisms such as mix-culture or single culture can be applied in the anode MFC systems to generate currents and protons during organic substrates degradation. However, the enrichment process is needed for enriching the microorganism community in the anode so that the electricity generation and substrates degradation are maximum (Kim et al. 2004). In the enrichment process, microorganisms must be supplied with the appropriate and sufficient substrates at the certain pH and temperature condition, thus microorganisms will rapidly proliferate. A various of organic compounds such as acetate, cellulose and glucose can be used as substrates
in the enrichment process (Gezginci et al. 2016).
The presence of microorganisms on the anode surface is known as biofilm and acts as bio-catalyst. The biofilm on the anode surface can generally be detected after the enrichment process was completed (Greenman et al. 2021). The consistence and optimum current generations, COD removal and pH reductions indicate the enrichment process is reached. In addition, the biofilm formation on the anode surface can be detected by using the scanning electron microscopy (SEM). These types of microbes in the MFC system are known as electroactive bacteria (EAB) group that can degrade organic substrate and at the same time generate protons and electrons (Borolea et al. 2009).
Surface characteristics of anode affects the biofilm formation and electroactive bacteria communities (Katuri et al. 2020). Several researches reported that carbon materials were most popular used as anode in MFC systems. The carbon materials such as carbon granules, carbon fibre, carbon paper, graphite felt, graphite foam and carbon nanomaterials can be applied and their have no negative impact on the EAB (Mustakeem 2015; Zhoua et al. 2011). Therefore, graphite foam is used as anode in this work in this work. In addition, the biofilm formation on the surface of graphite anode can be predicted using COD removal, pH change and SEM analysis. Although the many researches have been reported on the enrichment process, but there were no reports related with the enrichment process using tofu wastewater (TWW) anaerobic sludge as EAB sources. Therefore, this work tries to use TWW as EAB source and graphite foam as anode material. The results will provide a good
information on the MFC performance in term of biofilm formation.
In this work, TWW anaerobic sludge was used as mix-cultures or EAB source. TWW anaerobic sludge was collected from the TWW treatment pond located at central industry of tofu Barepan Margoagung Sayegan Sleman Yogyakarta. The location of TWW treatment pond as shown in Figure 1. A total 3.0 L of TWW anaerobic sludge was manually collected and placed in a plastic bottle with size of 5.0 L. Then, TWW sample bottle was closed and kept at room temperature. In the inoculation stage, a total 25 mL of TWW anaerobic sludge was mixed with the phosphate-buffer medium (PBM). The mixed TWW anaerobic sludge and PBM were then placed in the refrigerator for further experiment.
All chemicals were purchased by using online shop application. The PBM consisting (all in L); 1.0 g CH3COONa, 4.2 g KH2PO4 , 3.3 g K2HPO4, and 8.8 g NaCl and then pH was adjusted at 7.0. The PBM was heated at 60 oC and mixed with magnetic stirrer for 15 minutes. After the PBM was cooled, the TWW anaerobic sludge was mixed with the PBM with formulation of 50 : 50 and was placed into the anode compartment of MFC. This process was performed at room temperature for overnight. Then, the fresh PBM was used to replace the half of anode solution and was run for overnight. This stage was conducted for 400 h until the current generation was stable.
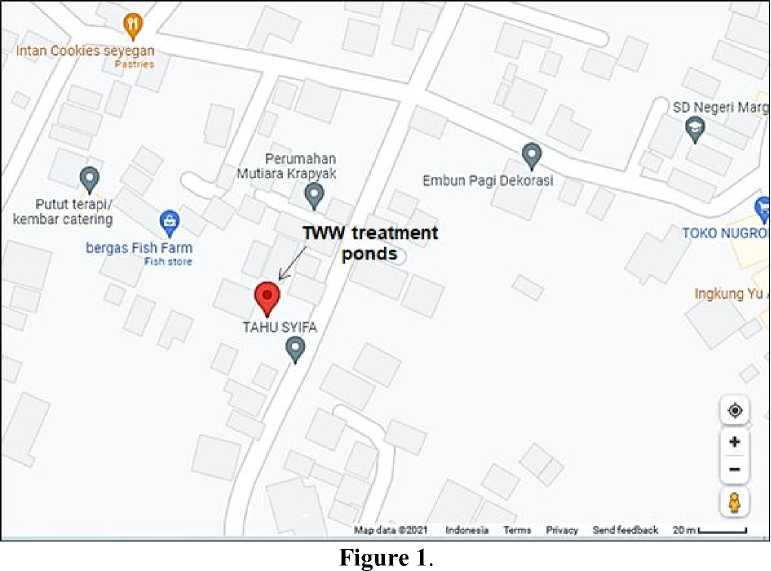
Map of TWW treatment pond at central industry of tofu Barepan Margoagung Sayegan Sleman Yogyakarta. The location is collected from google map.
Some important materials for fabricating MFC such as acrylic blocks, cation exchange membrane (CEM, CMI 7000s) and electrodes were obtained from the laboratory of Fuel Cell Institute, Universiti Kebangsaan Malaysia (UKM). Whereas, the resistors and iron mesh were purchased from the shop nearby Campus 4 of Univeritas Ahmad Dahlan (UAD), Banguntapan, Bantul Yogyakarta. The MFC system was fabricated by using acrylic blocks with size 10 cm x 10 cm. In this work, the MFC system was designed in the dual chamber system. Whether the anode and cathode compartments were designed with volume of 55 mL. The photograph of MFC was presented in Figure 2(a). The anode and cathode materials were fabricated from graphite foam (GF) with size of 2.5 cm x 2.5 cm, respectively (Figure 2(b). Each anode and
cathode were installed with a current collector mesh (iron mesh). Both anode and cathode materials were treated using high purity ethanol (96.0 %) for overnight. Then, both anode and cathode were washed using deionized water (DW) for thrice. The aim of electrode treatment was to remove the biological and physical impurities. Anode and cathode were then connected by 1 kΩ resistor after 48 h enrichment proses was conducted. The anode and cathode compartment were separated by using a CEM (CMI 7000s) with size of 10 cm x 10 cm (Figure 2(c)). Whereas, the CEM was treated using 5.0 % (w/v) sodium chloride for overnight and was then washed with the deionized water for thrice. The aim of CEM treatment using sodium chloride was to activate the separator permeability (Satar et al. 2018). During the MFC operation, anode compartment was conditioned in anaerobic while the cathode in aerobic condition.
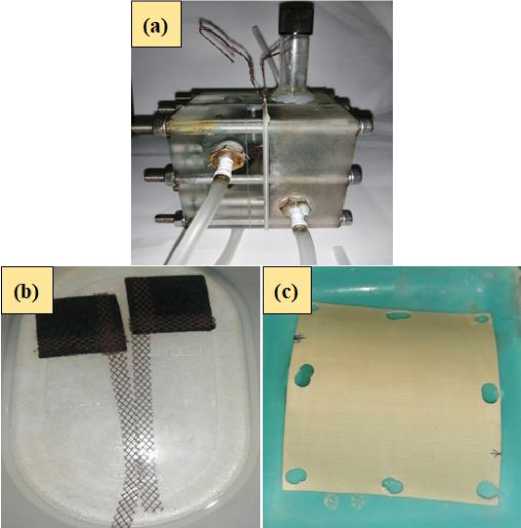
Figure 2.
Photograph of (a) the microbial fuel cell (MFC) setup, (b) anode (left) and cathode (right) materials and (c) cation exchange membrane (CEM, CMI 7000s)
Morphology of anode surface was analyzed by using a scanning electron microscopy and energy dispersive X-ray spectroscopy (SEM-EDX, JEOL JSM 5800). Before the morphology analysis, dried anode was mounted on the SEM-EDX stubs coated with gold. Different sections of the matrices were scanned and imaged with the SEM-EDX using an accelerated voltage of 20.000 V at a distance of 1.0 cm. The images were captured with a resolution of 1280 x 960 and dwell time of 160 s. Whereas, the elemental compositions on the anode surfaces were analyzed by using an incorporated Inca, Point and Analysis software (Satar et al. 2018).
The performance of MFC was measured based on the current generation (mA) during the enrichment stages. In addition, pH changes and COD removal (%) of substrate were evaluated. The high of MFC performance was associated with the high of current generation and the high COD removal. The current generation was measured by using a digital multimeter (Landeks 9250). The pH
of substrate was measured by using a pH tester (HI98103, Hanna Instruments). Whereas, the COD removal was determined by using the American Public Health Analysis (APHA) method as described by Soto et al. (Soto et al. 2020). The COD removal was calculated based on the exchange of COD (ΔCOD) initial COD (COD0) and the final COD (CODt) as described by formula of; COD removal (%) = ∕ΔCODλ
∣77T"Jx 100 %.
∖CODqz
The COD is one of main parameters that can be used to assess the wastewater quality. The high COD value indicates the worse wastewater quality otherwise the low COD indicates the good wastewater quality (He et al. 2021). Based on the National Standard of Indonesia (SNI) 6982.15:2019 that the maximum of COD value of wastewater is 300 mg/L before it is discharged into the environment (Kambuaya 2019). Generally, the COD can be defined as amount of oxygen equivalent of organic matter in a sample that is sensitive to the strong chemical oxidant (Soto et al. 2020). By enriching microorganism in the anode compartment, the MFC system can
degrade the complex organic matter and generate electrons and protons at the same time. The protons will pass through the membrane while the electrons will be pumped to the anode and reach the cathode via external circuit (Ni et al. 2020; Prathiba et al. 2021). Based on Table 1, the COD0 and CODt of
PBM substrate were obtained around 1.060 g/L and 303 g/L, respectively. From these data, the COD removal was observed about 71.4 %. The change in COD from high value into low value might be due to the activity of EAB at the anode compartment that consumed a lot of organic matters.
Table 1. The initial and final conditions during the electroactive bacteria (EAB) enrichment
process in anode of MFC
|
Parameters |
Initial |
Final |
|
pH |
7.1 ± 0.1 |
5.7 ± 0.1 |
|
COD (mg/L) |
1060 ± 10.1 |
303 ± 5.0 |
|
I (mA) |
0.001 ± 0.000 |
0.19 ± 0.03a |
|
J (mA/m2) |
1.6 ± 0.0 |
304.0 ± 0.3b |
|
V (mV) |
1.0 ± 0.0 |
190 ± 1.0c |
|
Elemental composition of |
C (100) |
C (92.1), F (6.2), Zr (1.4 Zr), |
|
anode (%) |
S (0.3) |
Note: All tests were caried out in triplicate;
To ensure the optimum conditions for EAB enrichment process, all data must be collected after the current generations, COD removal and pH changes were quite constant for three consecutive tests. Generally, this stage known as steady state condition for the enrichment process of MFC. As reported by Logan et al. (2006) that the trend of current generation will stable when the enrichment of EAB is reached. Hence, this stage was then assumed as the optimal conditions for EAB enrichment process in anode of MFC.
In addition to the COD removal, the change of pH can also be used to investigate the microbial activity. The pH changes influence the distribution and occurrence of microorganisms. Typically, the microbes survive over a range of 3 – 4 pH unit and categorized as acidophiles, neutrophiles and alkaliphiles depending on the optimum pH for growth (Jin et al. 2018; Zhang et al. 2011).
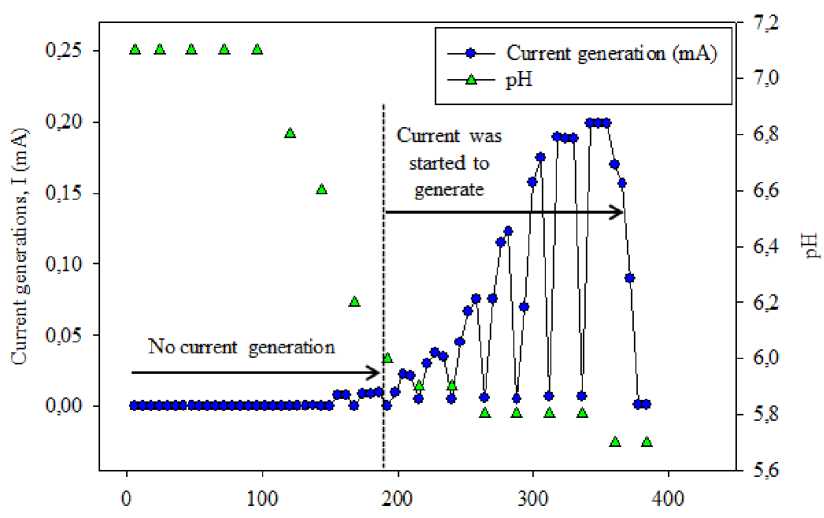
The acidophiles can growth in the acidic condition, neutrophiles growth in neutral and alkaliphiles growth in the alkali condition. In terms of MFC operation, the type of microbes used in the anode are generally neutrophiles and/or acidophiles microbes. Therefore, pH of anode electrolyte (anolyte) is decreased during the MFC operation. It well known the pH change may cause direct effect on the microbes growth and consequently affects the generation of electrons and protons (Jin et al. 2018; Zhang et al. 2013). Based on Figure 3. The pH anolyte was started to decrease from 7.1 to 6.8 after 124 h of enrichment process. The maximum of pH change was found 5.8 after 336 h. The pH changes were then stable at least for three consecutive tests. These facts can be used to assess the enrichment proses. The complex organic matters in substrate are degraded by microorganisms to chemical or simple organic acids, hence the pH is decreased.
Time (h)
Figure 3.
The pH change and current generation during the anode enrichment stage
The current generations in MFC system during enrichment process were shown in Figure 1. The high current was produced around 0.19 ± 0.03 mA (correspond to a voltage of 190 mV) and open circuit voltage (OCV) was observed 0.54 V. These results indicated that the enrichment process can be reached within 300 h experiment run. After 300 h, the current production was higher than that of 250 h of enrichment process. Columbic efficiency (CE) was 30.6 %, this value showed that the proportion of the current produced normalized to the maximum current when all acetate converted to electrons. Both COD and pH of media were decreased from 1060 mg/L to 303 mg/L (71.4 % COD removal) and 7.1 to 5.7, respectively. These facts describe the acetate was degraded and converted by microorganisms into the electrons and protons. Based on few studies, the current generation in MFC system has a positive correlation with the pH changes and type of substrate as well as the EAB activities (Zhang et al. 2011). Therefore, the current generation can be used to assess the EAB enrichment on the anode surface. The high attached EAB populations on the anode surface resulting the high current generation. 209
The current or electrons can be transported to the cathode when the EAB was attached on the anode surface. The electrons are transferred from anolyte to the anode through EAB nanowires and are then transported to the cathode via external circuit (Meshram et al. 2017). The SEM images of anode surfaces were presented in Figure 4. Figure 4(a) was shown the anode surface before EAB enrichments were reached. The anode surface was clear and there were no microbes attached on the anode surface. Different with Figure 43(b) at where the anode surfaces were attached and covered by microbes. Based on the several reports, the type of microbes can be categorized as electroactive bacteria group such as Simplicispira, Variovorax, Comamonas, Acinetobacter (Zhang et al. 2011), Geobacter sulfurreducens or Shewanella oneidensis (Sydow et al. 2014). The EAB mainly are mainly used in MFC for converting the complex organic matters in wastewater to the simple organic compound. It was clear that the presence of high EAB communities resulting the high COD removal and decrease the pH value from neutral (7.1) to acidic (5.7).
In addition, the presence of EAB on the anode surface might be described by the decrement elemental compositions. At the initial enrichment run, the carbon composition on anode surface was observed 100 % of carbon (C). Meanwhile, the carbon composition of anode surface was obtained 92.1 % C and 7.9 % others (Table 1). Although the EDX results cannot precisely be
used to analyse the elemental compositions, but the decrement carbon composition describes the anode surface was covered by other chemical or biological components. Due to the EAB enrichment have been successfully reached, so the MFC system was ready to use for tofu wastewater treatment in the further experiment.
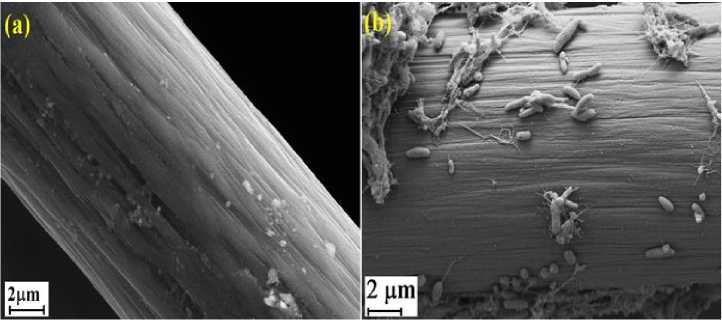
Figure 4.
Image of anode surface morphologies (a) before enrichment and (b) after enrichment was reached
The process of EAB enrichment in anode of MFC using TWW anaerobic sludge as mix-culture source was successfully performed in this work. The enrichment process was performed for 400 h using 1.0 g acetate as single substrate. The COD and pH of substrate decreased after the enrichment process was reached. The results show the maximum current generation (I), final pH and COD removal were obtained 0.19 mA, 5.7 and 71.4 %, respectively. The current generations were increased with increasing the COD removal. In addition, the SEM image shows the EAB colonies were attached on the anode surface. Based on these facts, the COD removal, pH changes, current generation and morphology of anode surface could be used to assess the enrichment process in MFC system.
It well known that the EAB was strict sensitive to the presence of high oxygen
concentration in the anode compartment. Therefore, the author recommended the anode compartment must always be in anaerobic condition in order the enrichment process can be reached in short duration in the future experiment. Anaerobic condition could be maintained by sparging inert nitrogen gas to the anode compartment.
ACKNOWLEDGMENT
The authors gratefully acknowledge financial support given by the Universitas Ahmad Dahlan (UAD) via research sponsorship of PDP-341/SP3/LPPM-UAD/VI/2021
REFERENCES
Borolea, A. P., Hamilton, C. Y., Vishnivetskaya, T. A., Leak, D., Andras, C., Morrell-Falvey, J., Keller, M. & Davison, B. 2009. Integrating Engineering Design Improvements with Exoelectrogen Enrichment Process to Increase Power Output from Microbial Fuel Cells. J Power Source 191(520-527.
Gezginci, M. & Uysal, Y. 2016. The Effect of Different Substrate Sources Used in Microbial Fuel Cells on Microbial Community. JSM Environ Sci Ecol 4(3): 1-8.
Greenman, J., Gajda, I., You, J., Mendis, A., Obata, O., Pasternak, G. & Ieropoulos, I. 2021. Microbial Fuel Cells and Their Electrified Biofilms. Biofilm xx(xx): 100057.
He, W., Jin, W., Wang, Q. & Feng, Y. 2021. Electron Flow Assisted Cod Removal in Wastewater under Continuous Flow Conditions Using Microbial
Electrochemical System. Sci Total Environ 776(145978.
Jin, Q. & Kirk, M. F. 2018. Ph as a Primary Control in Environmental
Microbiology: 1. Thermodynamic
Perspective. Front Environ Sci 6(21): 1-15.
Peraturan Menteri Lingkungan Hidup Dan Kehutanan Republik Indonesia Nomor P.16/Menlhk/Setjen/Kum.1/4/2019 Tentang Baku Mutu Air Limbah, 2019
Katuri, K. P., Kamireddy, S., Kavanagha, P., Muhammad, A., Conghaile, P. O., Kumar, A., Saikaly, P. E. & Leech, D. 2020. Electroactive Biofilms on Surface Functionalized Anodes: The Anode Respiring Behavior of a Novel Electroactive Bacterium,
Desulfuromonas Acetexigens. Water Res 185(116284.
Kim, B. H., Park , H. S., Kim, H. J., Kim, G. T., Chang, I. S., Lee, J. & Phung, N. T. 2004. Enrichment of Microbial
Community Generating Electricity Using a Fuel-Cell-Type
Electrochemical Cell. Appl Microbiol Biotechnol 63(672–681.
Koók, L., Dörgő, G., Bakonyi, P., Rózsenberszki, T., Nemestóthy, N., Bélafi-Bakó, K. & Abonyi, J. 2020. Directions of Membrane Separator Development for Microbial Fuel Cells: A Retrospective Analysis Using Frequent Itemset Mining and
Descriptive Statistical Approach. J Power Source 478(229014.
Logan, B. E., Hamelers, B., Rozendal, R., Schroder, U., Keller, J., Freguia, S., Aelterman, P., Verstraete, W. & Rabaey, K. 2006. Microbial Fuel Cells: Methodology and Technology. Environ Sci Technol 40(17): 5181-5192.
Meshram, R. & Jadhav, S. K. 2017. Bioelectricity Production and
Comparative Evaluation of Electrode Materials in Microbial Fuel Cells Using Indigenous Anode-Reducing Bacterial Community from Wastewater of Rice-Based Industries. Int J Renew Energy Dev 6(1): 83-92.
Mustakeem. 2015. Electrode Materials for Microbial Fuel Cells: Nanomaterial Approach. Mater Renew Sustain Energy 4(22): 1-11.
Ni, H., Wang, K., Lv, S., Wang, X., Zhuo, L. & Jiaqiao Zhang, J. 2020. Effects of Concentration Variations on the Performance and Microbial
Community in Microbial Fuel Cell Using Swine Wastewater. Energies 13(2231): 1-11.
Pandit, S., Chandrasekhar, K., Kakarla, R., Kadier, A. & Jeevitha, V. 2017. Basic Principles of Microbial Fuel Cell: Technical Challenges and Economic Feasibility. Dlm. Kalia, V. C. & Kumar, P. (pnyt.). Microbial
Applications, Vol 1 hlm. 165-188. Gewerbestrasse 11, 6330 Cham,
Switzerland: Springer Nature
Prathiba, S., Kumar, P. S. & Vo, D.-V. N. 2021. Recent Advancements in Microbial Fuel Cells: A Review on Its Electron Transfer Mechanisms,
Microbial Community, Types of
Substrates and Design for BioElectrochemical Treatment
Chemosphere 286(3): 131856.
Satar, I., Daud, W. R. W., Kim, B. H. K., Somalu, M. R., Ghasemi, M., Bakar, M. H. A., Jafary, T. & Timmiati, S. N. 2018. Performance of Titanium–Nickel (Ti/Ni) and Graphite Felt-Nickel
(Gf/Ni) Electrodeposited by Ni as Alternative Cathodes for Microbial Fuel Cells. J Taiwan Inst Chem Eng 89(67-76.
Soto, M. F., Diaz, C. A., Zapata, A. M. & Higuita, J. C. 2020. Bod and Cod Removal in Vinasses from Sugarcane Alcoholic Distillation by Chlorella Vulgaris: Environmental Evaluation
Biochem Eng J 176(108191.
Sydow, A., Krieg, T., Mayer, F., Schrader, J. & Holtmann, D. 2014. Electroactive Bacteria—Molecular Mechanisms and Genetic Tools. Appl Microbiol Biotechnol 98(20): 1-15.
Zhang, E., Liu, L. & Cui, Y. 2013. Effect of Ph on the Performance of the Anode in Microbial Fuel Cells. Adv Matter Res 608-609(884-888.
Zhang, L., Li, C., Ding, L., Xu, K. & Ren, H. 2011. Influences of Initial Ph on Performance and Anodic Microbes of Fed-Batch Microbial Fuel Cells. J Chem Technol Biotechnol 86(1226– 1232.
Zhoua, M., Chi, M., Luo, J., He, H. & Jin, T. 2011. An Overview of Electrode Materials in Microbial Fuel Cells. J Power Source 196(4427–4435.
ECOTROPHIC • 15(2): 204-212 p-ISSN:1907-5626,e-ISSN: 2503-3395
212
Discussion and feedback