ESTIMATION AND MAPPING OF ABOVE GROUND BIOMASS OF MANGROVE FOREST USING ALOS-2 PALSAR-2 IN BENOA BAY, BALI, INDONESIA
on
Estimation and Mapping of Above Ground…
[IGA Indah Mahasani, dkk]
ESTIMATION AND MAPPING OF ABOVE GROUND BIOMASS OF MANGROVE FOREST USING ALOS-2 PALSAR-2 IN BENOA BAY, BALI, INDONESIA
IGA Indah Mahasani1*), Takahiro Osawa2), I Wayan Sandi Adnyana3) 1)Enviromental Science, Udayana University
2)Center for Remote Sensing and Ocean Science (CReSOS), Udayana University 3)Faculty of Agriculture, Udayana University
*Email: indahmahasani@gmail.com
ABSTRACT
Mangrove forests are distributed in limited areas around along costlines, but they play important role in carbon fixation and carbon storafe in the tropic areas. Mangrove forests are a transitional ecosystem between land-based oceans, most of which are well-known along the tropic and subtropical coastlines. Mangrove ecosystems have an ecological function as an absorber and storage of carbon in the form of biomass. Remote sensing technology can include data spatially and temporally. This makes it easy to predict the overall extent and carbon stock. So that in the context of sustainable management of mangrove ecosystems it can be utilized to monitor mangrove carbon balance and become the basis for policy development. The objective of this study was to determine the potential above ground biomass model from ALOS-2 PALSAR-2 data in mangrove forests of Benoa Bay, Bali. In this research, the filter used is frost filtering. AGB model was constructesd by using dual-polarization L-band SAR of ALOS-2 PALSAR-2 data and field inventory plots. 40 plots were collected in the field and the allometric equation. The prediction model for aboveground biomass potential based on the ALOS-2 PALSAR-2 image on HV polarization in the mangrove Benoa Bay area, the correlation value (r) of 0.82, the coefficient of determination (R2) of 0.68. Validation model aboveground biomass-based, correlation value (r) of 0.90, the coefficient of determination (R2) of 0.82, and RMSE of ± 39.85. The potential of aboveground biomass and carbon stock in the mangrove Benoa Bay area is 364,241.87 Mg and 171,193.67 Mg C with the ability to absorb carbon dioxide (CO2) of 628,280.81 Mg CO2 Sequestration same with 3 bottles in 2020.
Keywords: Mangrove; Aboveground biomass (AGB); HV Polarization; ALOS-2 PALSAR-2.
Mangrove forests are transitional ecosystems between land and sea which mostly occur along tropical and subtropical coastlines (Liu et al. 2014). Mangrove forests have several physical, biological and ecological functions. Ecologically, mangroves function as carbon sinks, where their function makes mangroves store large amounts of carbon
both in vegetation (biomass) and other organic material found in mangrove forests (Cahyaningrum et al. 2014). Mangroves store carbon above ground and below ground, with most of it allocated below ground level (Alongi, 2012). From various studies, the total carbon stock in mangrove forests is 0.18-673.01 tons C ha-1 and mangrove carbon sediment stock ranges between 0.06-6.77% or equivalent to 0.90-66.12 Mg ha-1 (Afiati et al. 2014). Mangrove forests in coastal areas are very
effective and efficient in reducing the concentration of carbon dioxide (CO2) in the atmosphere, because mangroves can absorb CO2 through photosynthesis by diffusion through stomata and then store carbon in the form of biomass. Mangrove forests are the most dominant forests for storing carbon from other forests, with most of it allocated proportionally in the form of biomass.
Indonesia is an archipelagic country that has a mangrove forest ecosystem. The total area of mangrove forests in Indonesia was 3,156,744.78 ha, making Indonesia the country that has the largest mangrove forest (Rahadian, 2019), one of the mangrove ecosystems in Indonesia is on the island of Bali. Bali Island is an areathat has the greatest potential for mangrove ecosystems. There are three large mangrove areas on the island of Bali, the first is located along Benoa Bay which is often called the Bali Ngurah Rai Forest Park (TAHURA Ngurah Rai) with an area of 1,373.5 ha including Serangan Island, the second is the West Bali National Park with an area of 602 ha, and the last is in Nusa Lembongan with an area of 202 ha (Widagti et al. 2011).
Mangrove Forests in TAHURA Ngurah Rai, Bali is one of the ecosystems mangroves that suffer damage and change due to natural factors and human activities. In the TAHURA Ngurah Rai area, the vegetation area was rehabilitated around 402 ha which was formerly a pond area (Kitamura et al. 1997). Planting is not only intended to increase land but to help succession so that the benefits of rehabilitation can support the recovery of ecosystems and can function properly. One of the objectives of rehabilitation activities is to restore the function of mangrove ecosystems as carbon storage. Remote sensing technology can be used to detect mangrove forest ecosystems from tree canopies. Remote sensing technology can include data spatially and temporally.
This makes it easy to predict the overall extent and carbon stock.
Carbon stock monitoring has been attempted in recent years using remote sensing technology. The use of optical images such as Wordview-2 provides benefits in these activities. However, the constraints of cloud cover cause the pixel value which is still under the influence of clouds and thin cloud shadows cause the value is not a reflection of the actual vegetation value (Candra et al., 2016). By utilizing radar images from Synthetic Aperture Radar (SAR) techniques, the problem of cloud cover can be overcome. ALOS PALSAR L-Band image delay, with a wavelength of 23 cm and a frequency of 1.3 GHz has advantages compared to the use of optical images. There is a strong correlation between radar wave backscattering on L-Band SAR images and biophysical vegetation in a forest cover (Richards, 2009; Lee and Pottier, 2009). By correlating the backscattering value with the carbon stock from the field survey, a volume of carbon stock can be obtained. The use of HV (Horizontal-vertical) polarization will increase the accuracy of backscattering correlations with carbon stocks (Jaya et al. 2017). Therefore, the use of ALOS PALSAR satellite imagery to estimate aboveground biomass deposits spatially in the Benoa Bay mangrove forest area is important to do because carbon storage in mangrove forest areas has implications for various aspects related to global weather and climate. The objective of this study was to determine the potential above ground biomass model from ALOS PALSAR data in mangrove forests of Benoa Bay, Bali.
The study was conducted in the mangrove forests of Benoa Bay Bali,
which is located between 08041’ – 08047’ namely in the Denpasar City and Badung
S and 115010’– 115015’ E (Figure 1). This Regency.
mangrove area in two regencies/cities,
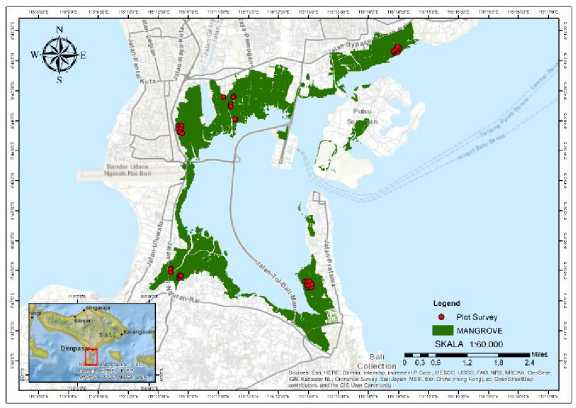
Figure 1.
Research Location
2.2 ALOS-2 PALSAR-2 Imagery Processing
Table 1. Acuired satellite remote sensing data.
|
Satellite sensor |
Date of acquisition |
Level of Process |
Spatial resolution |
Polarizations |
|
ALOS-2 PALSAR-2 |
January 23, 2020 |
1.1 |
7.96 meter |
L band (HV) |
Source: JAXA, Japan.
ALOS-2 PALSAR-2 data level 1.1 were provided by the Remote Sensing Technology Centre of Japan. ALOS-2 PALSAR-2 data were acquired on January 23, 2020, as shown in Table 1. The conversion of these values uses a logarithmic scale with decibels (dB) which is 10log10 and can be done using the following equation (Shimada et al. 2009):
σ°[dB]=10 ×log10 (DN2) + CF (1) Where CF = -83.0 (dB)
σo is the backscattering coefficient and the CF is a calibration factor that depends on the image acquisition date. After converting the pixel value of PALSAR images to dB, filtering is carried out to reduce errors that occur when
recording data that can affect the appearance of images in the form of dark and bright pixels. The disturbance can be seen in the image in the form of blurred points called speckle noise. This filtering process uses a type of Frost filter which is considered to have a more established algorithm.
The data was collected by conducting a field survey to obtain diameter at breast height (DBH). The DBH value is obtained by measuring the circumference of the tree trunk at breast height or 1.3 meters from the ground surface. DBH value measurement
performed on all individuals in plot size 10 m x 10 m. Field data collection was carried out from August to October 2020 in low tide conditions. The number of
field observation plots was 40 plots, of which 30 plots were used to form the model and 10 plots were used to validate the model.
Table 2. Above Ground Biomass Allometric for Mangrove Species
|
Spesies |
Equation |
Reference |
Wood density (ρ) |
|
Sonneratia alba |
0,3841*ρ*D2,101 |
Kauffman and Cole (2010) |
0,6443 |
|
Rhizophora apiculate |
0,043* D2,63 |
Amira (2008) |
0,8814 |
|
Rhizophora mucronate |
0,128* D2,60 |
Fromard et al. (1998) |
0,94 |
|
Bruguiera gymnorrhiza |
0,0754* ρ*D2,505 |
Kauffman and Cole (2010) |
0,741 |
|
Xylocarpus granatum |
0,1832* D2,2 |
Komiyama et al. (2005) |
0,6721 |
The data used in the model validation were 10 plots of total plots obtained. Validation data selector is separated by modeling plots to get good representation. Validation tests were carried out to determine the deviation of the carbon estimator values obtained through the regression equation model. The validation testing criteria are using the calculation of the difference between RMSE (Root Mean Square Error).
RMSE (Root Mean Square Error) is used to find out how much error occurs in the calculation results of the model when compared to the actual value. The smaller the RMSE value, the smaller the errors that occur in the use of the model. The RMSE calculation uses the following formula:
R MS E = ^SE^. (2) n
where E is above ground biomass value from the regression model, O is above ground biomass values observed in the field, and n is number of validation observation.
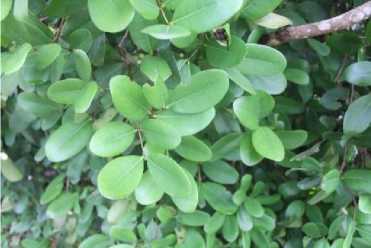
The mangrove area in Benoa Bay is located in two regencies/cities, namely in the City of Denpasar and Badung Regency which includes three subdistricts including South Denpasar, Kuta, and South Kuta. The Benoa Bay mangrove area is surrounded by 12 villages/wards, each of which is six villages/wards in Denpasar City and Badung Regency. The distribution of mangrove vegetation in the Benoa Bay area consists of natural vegetation and rehabilitation vegetation. The condition of mangrove vegetation in the Benoa Bay mangrove area is relatively good as indicated by the thickness of the visible mangrove vegetation. Analysis of mangrove vegetation was carried out in 40 observation plots which were divided into 5 data plot areas including Mertasari, Mangrove Information Center (MIC), Tukad Mati, Tukad Sama, and Tanjung Benoa. The types of mangrove vegetation found at the site include Sonneratia alba, Rhizophora apiculata, Rhizophora mucronata, Bruguiera gymnorrhiza, and Xylocarpus granatum (Figure 2).
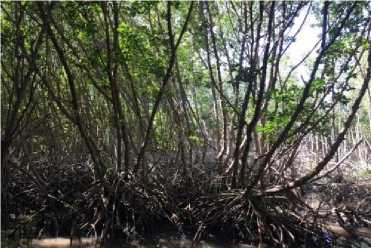
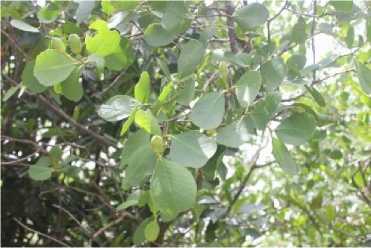
b. Sonneratia alba
a. Rhizophora apiculata
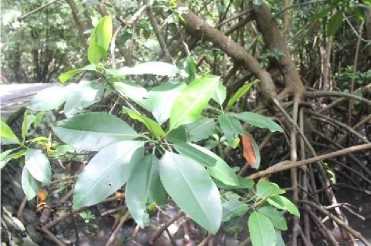
c. Rhizophora mucronata d. Xylocarpus granatum

e. Bruguiera gymnorrhiza Figure 2.
Spesies Mangrove in Study Area
There are differences in tree distribution patterns between natural mangrove vegetation areas and rehabilitated mangrove vegetation. The mangrove vegetation rehabilitation area is dominated by Rhizophora, it has a neat and structured pattern. This pattern does not occur in natural mangrove vegetation areas, which are dominated by Sonneratia. In this area, the position of the trees is not neat and the boundaries between areas dominated by Sonneratia and other
species do not have clear boundaries. Based on Andika et al. (2018) research, the Bali Mandara highway road construction affects environmental parameters of mangrove vegetation in Benoa Bay area. However, mangrove ecosystem in Benoa Bay area has not changed significantly in 5 years.
-
3.2 The Relationsship between
backscattering values with
aboveground biomass in Mangrove forest Benoa Bay, Bali
Biomass can be divided into two categories, namely aboveground biomass and belowground biomass. In taking field data, only measurements were made of the mangrove stands (aboveground biomass). The observation plot is adjusted to the conditions in the field based on the accessibility. The observation plots varied in natural mangrove vegetation and
rehabilitated mangrove vegetation. The results obtained were in the form of mangrove stands and trunk circumference at breast height, which was then converted into tree diameter (DBH).
Based on the results of measurements using allometries, it is known that the average biomass potential of trees with a diameter of <10 cm in the field is 115.83 ± 79.05 Mg/ha. A comparison of the total biomass potential above the surface in each observation plot can be seen in Figure 3.
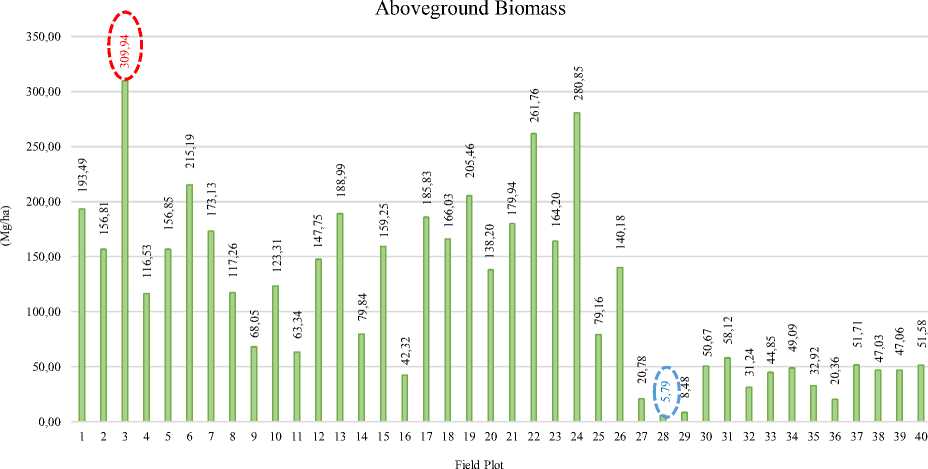
Figure 3.
Value of Aboveground Biomass in Field Plot Survey
Figure 3. shows that the highest AGB value is found in plot 3 with content of 309.94 Mg/ha, while the lowest value is found in plot 28 with a content of 5.79 Mg/ha. The results of the calculation of the 40 observation plots that were carried out varied, this result was influenced by the tree diameter, the number of mangrove stands, and the types of mangrove vegetation found in the observation plot. Not only that, but the type of mangrove area also affects the biomass content in tree stands. According to Husna et al. 80
(2018), the value of biomass will be influenced by the diameter of the tree trunk, tree density, and mangrove species. The greater the trunk diameter and tree density, the greater the biomass that can be stored. However, the same diameter value does not necessarily have the same biomass value if it has different mangrove species because the biomass calculations between mangrove species have different allometric equations.
The development of aboveground biomass estimates for various mangrove
species provides an alternative method for obtaining biomass in a timely and costeffective manner. The techniques and methods used can be replicated for other mangrove forest types with similar characteristics, stand structure, and various biophysical parameters. The results of research by Pham, T. D, and Kunihiko, Y (2017) state that ALOS PALSAR can be used in predicting AGB of mangrove species. In this research, the filtering used is Frost filtering. The use of frost filtering on HV polarization can describe the variation in biomass above the soil surface. The frost filter smooth out the noise and retaining edges or shape feature that appropriates with the field condition that has diverse relief also the polarization of HV has horizontal energy
is attenuated by the vertical canopy of vegetation especially streams, leaves, branches, or trunks (Frost et al. 1982; Yuan et al. 2018). Also, cross-polarization is less sensitive for use on multiple slopes, and it is advisable to use crosspolarization as it is best done for monitoring vegetation. Next, the ALOS PALSAR image calibration was carried out to produce the NRCS (Normalized Radar Cross Section) value or sigma naught (σ0). After obtaining the sigma naught (σ0) value, a digital value is performed to obtain the backscatter value coefficient for each of the plot coordinates (40 plots) on the predetermined HV polarization. The results of the backscatter value extraction can be seen in Figure 4.
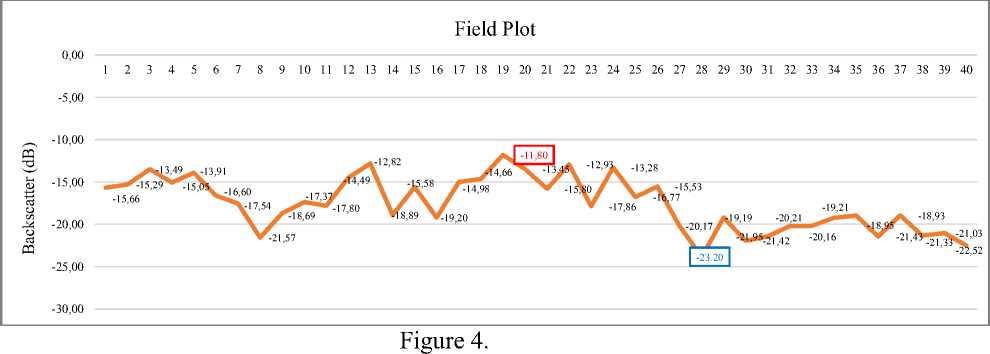
Value of Backscatter in Field Plot Survey
Figure 4 shows the lowest backscatter coefficient value, which is -23.20 dB on plot 28, and the highest backscatter coefficient value is -11.80 dB on plot 20. The results show that HV polarization has better sensitivity, so that information can be obtained about the volume of vegetation scattering using HV compared to other polarizations (Jaya et al. 2017).
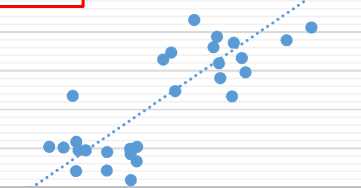
The data used in building the regression model were obtained from 30 field data plots in the Benoa Bay Mangrove area along with the backscatter extraction results in the same plot location. The formation of the regression line and the relationship between the aboveground biomass in the field and the HV polarization backscatter coefficient value can be seen in Figure 5.
y = 21.576x + 500.62 R² = 0.68
-30,00 -25,00 -20,00 -15,00 -10,00
Backscatter
350,00
300,00
250,00
200,00
150,00
100,00
50,00
0,00
-5,00 0,00
-
Figure 5.
Relationship between Aboveground biomass (AGB) field and backscatter coefficients of HV
Figure 5 shows the results of linear regression on HV polarization. The form of the regression equation generated as an estimation model for potential aboveground biomass (AGB) based on the backscatter value of the HV polarization of ALOS PALSAR images in the mangroves of Benoa Bay, Bali, is Y = 21.576 X + 500.62, where Y is the aboveground biomass and X is the backscatter value of HV polarization. The determinant coefficient (R2) is 0.68 and the correlation coefficient (r) is 0.82. The results show that the HV polarization has a positive correlation, which shows that the backscattering value is directly proportional to the aboveground biomass value. The coefficient of determination shows that the effect of the independent
variable (HV polarization) on aboveground biomass in the study area is 68%, while the remaining 32% is influenced by other variables not included in this study.
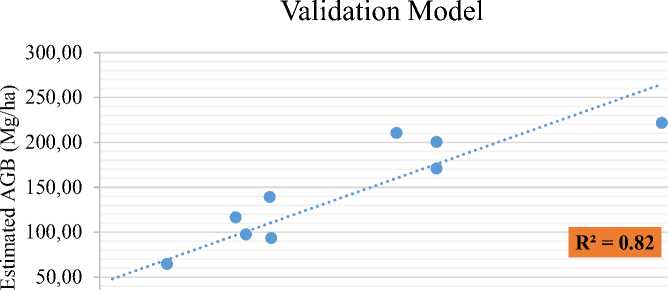
The selected aboveground biomass estimation used to determine the distribution of the aboveground biomass is a linear regression model. The sample used to validate the model is 10 sample plots that are left over from the entire sample obtained in the field, where most of the other samples have been used to build the model. Model validation can be seen in Figure 6. The accuracy value is determined based on the amount of Root Mean Square Error of estimates between the measurement results of aboveground biomass in the field with image data.
0,00 •-----------------1---------------------1---------------------1---------------------1---------------------1---------------------1
0,00 50,00 100,00 150,00 200,00 250,00 300,00
Observed AGB (Mg/ha)
-
Figure 6.
Relationship between Observed Aboveground biomass (AGB) and Estimated Aboveground biomass (AGB)
Figure 6 shows the Relationship between Observed Aboveground biomass (AGB) and Estimated Aboveground biomass (AGB). The results of the validation value of the aboveground biomass model have a correlation value (r) of 0.90, a determinant coefficient (R2) of 0.82, and Root Mean Square Error (RMSE) ± 39.85. The estimated aboveground biomass value is an estimate for January 2020, while the value of the field aboveground biomass is the result of the value based on data from August to October 2020. This difference contributes to the magnitude of the error that occurred in the calculation.
Aboveground biomass (AGB) provides the best estimate using the diameter breast height (DBH) parameter (Alemayehu et al. 2014). Determining the value of AGB is an important step in planning the protection and utilization of mangrove natural resources (Meideros and Sampaio 2008). Differences in AGB and BGB values were seen among mangrove species, depending on geographic location, tree density and ecology (Sahu et al. 2016; Alongi 2012). The distribution of aboveground biomass in 2020 can be seen in Figure 7.
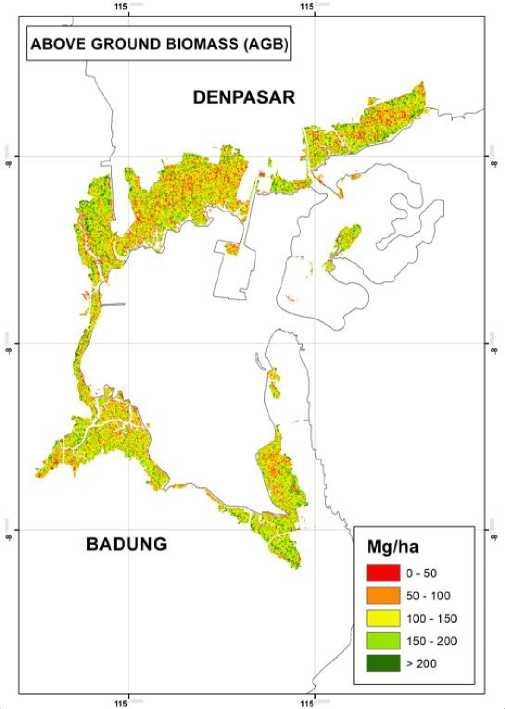
Figure 7.
Map of Value and Distribution of Aboveground biomass (AGB) in Mangrove Benoa Bay, Bali
The value and distribution of AGB in 2020 is presented in Figure 7. It is known that the value of AGB concentration varies from 0 to 499.04 Mg/ha in 2020. Overall the potential AGB in 2020 was 364,241.87 Mg. Carbon is closely related to biomass, so estimating the potential carbon storage of a forest can be done by estimating its biomass potential. Biomass is the amount of organic material produced by organisms per unit area at a certain time. Mangrove forests have an important role in dynamic carbon storage, because the presence of forests will reduce CO2 gas in the atmosphere through the process of
photosynthesis and store it in plant tissue as organic material in plant biomass (Hairiah et al. 2007). The absorption of carbon by mangroves is greatly influenced by environmental factors around it. The estimated carbon storage of a stand can be seen from the amount of biomass potential the stand has. Carbon stock is directly proportional to its biomass content. According to IPPC (2006), the concentration of carbon contained in organic matter is 47%, so the estimated amount of carbon stored is multiplying 0.47 by the biomass. The distribution of total carbon stock in 2020 can be seen in Figure 8.
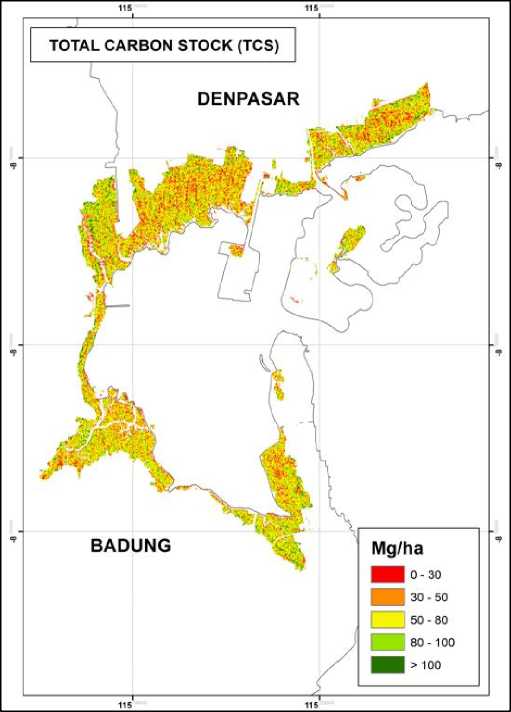
Figure 8.
Map of Value and Distribution of Total Carbon Stock (TCS) in Mangrove Benoa Bay, Bali
The value and distribution of TCS in 2020 is presented in Figure 8. It is known that the value of TCS concentration varies from 0 to 234.55 Mg/ha in 2020. Overall the potential AGB in 2020 was 171,193.67 Mg C. High carbon stock values are mostly distributed in mangrove forests near the sea. One of the high carbon values is the dominance of Sonneratia alba species which have higher carbon stocks compared to other species. This is also related to ecology, mangroves that receive circulatory water input will grow better because they are supplied with sufficient water which can accelerate vegetation growth. This type of mangrove Sonneratia alba grows on natural mangrove vegetation that gets good water circulation input. Hastuti et al.
-
(201 7) stated that the production of high carbon stocks in natural mangrove vegetation was compared to mangrove vegetation that was replanted in former ponds.
Lower value of carbon stock, scattered in mangrove areas adjacent to the mainland. The species that predominantly have low carbon stock are Rhizophora apiculata and Rhizophora mucronata. Low carbon stocks can be influenced by terrestrial or anthropogenic activities, such as garbage that flows through rivers so that it accumulates in mangrove areas. Human activity waste affects the inhibition of mangrove growth adjacent to the mainland due to inhibition of mangroves in absorbing nutrients from the soil and from waste pollutants.
Inhibition of mangrove growth causes the ability to store carbon stocks lower. The variation of carbon stock depends on several physical and chemical factors of the environment, the diversity and density of the existing plants, the type of soil and the way it is managed. The high ability of trees to store free carbon from the air depends on the tree diameter (Imani et al. 2017) and tree height (Fu and Wu 2011).
Plants absorb carbon from the air and convert it into organic compounds through photosynthesis. The results of photosynthesis are used for growth vertically and horizontally. The larger the
tree diameter is caused by the storage of biomass from the conversion of carbon, which increases in size the more carbon is absorbed by the tree. The absorption of CO2 shows the ability of the stands to absorb CO2 from the respiration process into organic compounds through the photosynthesis process, which is stored as biomass. The potential for CO2 gas absorption is obtained by calculating the multiplication of carbon content against the amount of CO2 absorption. The distribution of the amount of CO2 Sequestration in 2020 can be seen in Figure 9.
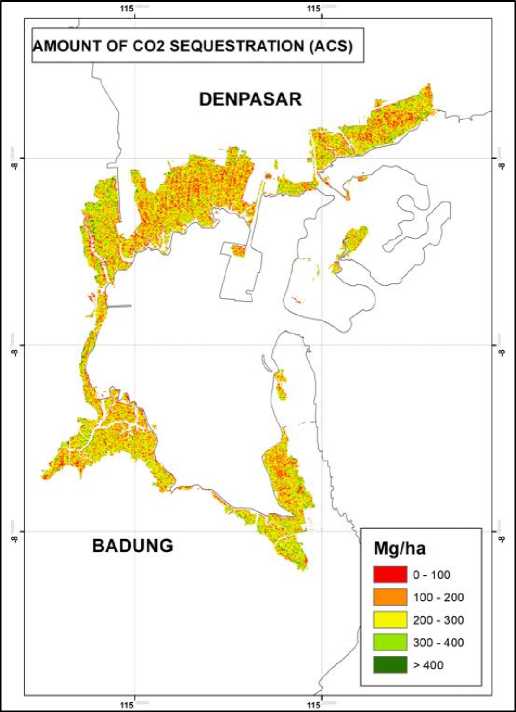
Figure 9.
Map of Value and Distribution of The Amount of CO2 Sequestration (ACS) in Mangrove Benoa Bay, Bali
ACS values and distribution in 2020 are presented in Figure 8. It is known that the value of ACS
concentration varies from 0 to 860.80 Mg/ha in 2020. Overall the total CO2 Sequestration in 2020 was 628,280.81 Mg
CO2. Estimated total CO2 content Sequestration in 2020 is simulated in estimating the number of bottles. From 628,280.81 Mg CO2 divided by the CO2 density of 0.00198 in the form of gas into 3 bottles.
The prediction model for above ground biomass potential based on the ALOS-2 PALSAR-2 image on HV polarization in the mangrove Benoa Bay area, the correlation value (r) of 0.82, the coefficient of determination (R2) of 0.68. Validation model above ground biomass based, correlation value (r) of 0.81, the coefficient of determination (R2) of 0.65 and RMSE of ± 56.44. The potential of aboveground biomass and carbon stock in the mangrove Benoa Bay area is 364,241.87 Mg and 171,193.67 Mg C with the ability to absorb carbon dioxide (CO2) of 628,280.81 Mg CO2
Sequestration same with 3 bottles in 2020.
Determination of appropriate management and policies as well as the role of the government and the community are the main keys in maintaining and preserving the mangrove ecosystem in order to improve the ecological function of the mangrove ecosystem in the Benoa Bay area.
REFERENCES
Afiati, R. N., Rustam, A., Kepel, T. L., Sudirman, N., Astrid, M., Daulat, A., Suryono, D. D., Puspitaningsih, Y., Mangindaan, P., Hutahaean, A. (2014). Karbon Stok dan Stuktur Komunitas Sebagai Blue Carbon di Kepulauan Derawan, Kalimantan
Timur. Prosiding Seminar Hasil Penelitian Terbaik Tahun 2014. Badan Penelitian dan Pengembangan Kelautan dan Perikanan.
Alemayehu F., Richard O., James KM, Wasonga O. 2014. Assessment of Mangrove Covers Change and Biomass in Mida Creek, Kenya. Open Jurnal of Forestry. 4: 398 – 413. http//dx.doi.org/10.4236/ojf.2014.440 45.
Alongi, D. M., 2012. Carbon
Sequestration in Mangrove Forests. Carbon Manage. 3: 313-322.
Andika, I.B.M.B. 2018. “Dampak Pembangunan Jalan Tol Bali Mandara Terhadap Ekosistem Mangrove di Teluk Benoa Bali”. (tesis). Bogor: Institut Pertanian Bogor.
Cahyaningrum S. T., Hartoko A., Suryanti. 2014. Biomassa Karbon Mangrove Pada Kawasan Mangrove Pulau Kemujan Taman Nasional Karimunjawa. Diponogoro Journal of Maquares. Management of Aquatic Resources. Vol 3, No 3: 34-42.
Candra, E., D., Hartono and Wicaksono, P. 2016. Above Ground Carbon Stock Estimates of Mangrove Forest Using Worldview-2 Imagery in Teluk Benoa, Bali. 2nd International Conference of Indonesian Society for Remote Sensing (ICOIRS). IOP Conference Series: Earth and Environmental
Science.
Frost, V. S., Stiles, J.A., Shanmugan, K.
S., and J. C. Holtzman, 1982. A Model for Radar Images and Its Application to Adaptive Digital Filtering of Multiplicative Noise. IEEE Transactions on Pattern Analysis and Machine Intelligence, 4(2):157-166.
Fu W., and Wu Y., 2011. Estimation of Above Ground Biomass of Different Mangrove Trees Based on Canopy Diameter and Tree Height. 3rd International Conference on
Enviromental Science and
Information Application Technology (ESIAT 2011). Procedia
Environmental Sciences, 10 (2011) 2189 – 2194.
Hairiah, K., Rahayu, S., 2007.
Pengukuran Karbon tersimpan di berbagai macam pengunaan lahan. World Agroforestry Centre ICRAF. Bogor.
Hastuti, A., W., Suniada, K., I., Islamy, F. 2017. Carbon Stock Estimation of Mangrove Vegetation Using Remote Sensing in Perancak Estuary, Jembrana District, Bali. International Journal of Remote Sensing and Earth Sciences Vol.14 No. 2. 137 – 150.
Husna, V. N., Vincentis, P. S., Syamsul, B. A., Taslim, A. 2018. Estimasi Cadangan Karbon di Atas Permukaan Tanah Pada Mangrove Menggunakan Pengindraan Jauh di Tongke – Tongke, Sulawesi Selatan. Journal of Natural Resources and
Environmental Management. 9(2):
456-466. E-ISS: 2460 – 5824.
Imani G., Boyemba F., Lewis S., Nabahungu NL, Calders K., Zapfack L., et al. 2017. Height – Diameter Allometry and Above Ground Biomass in Tropical Montane Forests: Insights from the Albertine Rift in Africa. PLOS ONE 12(6): e0179653. https://doi.org/10.1371/journal.pone.0 179653.
Jaya, L.M.G, Wikantika, K., Sambodo, A.K., dan Susandi, A.
-
(2017) Comparison of PolSAR and PolInSAR Method to Estimate Mangrove Carbon Stocks in Southeast Sulawesi Indonesia, using ALOS PALSAR Dual-Polarizations in the Perspective of Climate Change Mitigation, International Journal of Tomography and Simulation, CESER Publication, Vol. 30, No. 3, ISSN: 2319-3336.
Kitamura, S., Anwar, C., Chaniago, A. and Baba, S. 1997. Buku Panduan Mangrove Indonesia, Bali dan Lombok. Proyek Pengembangan Manajemen Mangrove Berkelanjutan. Departemen Kehutanan Republik Indonesaia dan Japan Internasional Cooperation Agency.
Lee, Jong-Sen and Pottier, Eric (2009): Polarimetric Radar Imaging from Basics to Applications, CRC Press, ISBN 978-1-4200-5497-2.
Liu, H., Hai, R., Dafeng, H., Wenqing, W., Baowen, L., Qingxia, C. 2014. Carbon stocks and potential carbon storage in the mangrove forests of China. Jurnal of Envirinmental Management 133: 86-93.
Meideros TCC, Sampaio E. 2008. Allometry of Aboveground
Biomasses in Mangrove Species in Itamaraca, Pernambuco, Brazil. Wetlands Ecology and Management 16 (4): 323-330.
Phan, T. D. and Kunihiko, Y. 2017. Aboveground Biomass Estimation of Mangrove Species Using ALOS-2 PALSAR Imagery in Hai Phong City, Vietnam. Journal of Applied Remote Sensing. 11(2). 026010 (2017). doi: 10.1117/1.JRS.11.026010.
Rahadian, A. 2019. “Model Spasial
Pendugaan Biomassa dan Karbon
Mangrove di Indonesia” (tesis).
Bogor: Institut Pertanian Bogor.
Richards, J. A. (2009): Remote Sensing with Imaging Radar, Signals and Communication Technology, ISBN: 978-3-642-02019-3, Springer.
Sahu SC, Kumara M., Ravindranath NH. 2016. Carbon Strock in Natural and Planted Mangrove Forests of Mahanadi Mangrove Wetland, East Coast of India. Current Science, Vol. 110, No. 12, 25 June 2016.
Shimada M, Isoguchi O, Tadono T, Isono K. 2009. PALSAR radiometric and Geometric calibration. IEEEE
Transactions on geoscience and remote sensing 47(12):3915-3932.
Widagti, N., Trityulianti, I., Manessa, M. D. M. 2011. Changes in density of mangrove forest in Nusa Lembongan, Bali. Proceeding of the 2ND CReSOS International Symposium on South East Asia environmental problems
and satellite remote sensing. Denpasar, Bali–Indonesia, 21 – 22 February 2011. Hal. 171-176.
Yuan, J., Lv, X., & Li, R., 2018. A Speckle Filtering Method Based on Hypothesis Testing for Time-Series SAR Images. Remote Sensing, 10(9), 1383. doi:10.3390/rs10091383.
89
Discussion and feedback