AN APPLICATION OF SEGNET FOR DETECTING LANDSLIDE AREAS BY USING FULLY POLARIMETRIC SAR DATA
on
An Application Of Segnet For Detecting Landslide Areas By Using Fully Polarimetric Sar Data
[I Made Oka Guna, dkk.]
1. INTRODUCTION
The study of landslide location is in Hokkaido, Japan, which occurred due to the Iburi Earthquake 2018. The Earthquake occurred on September 6th, 2018 at 03:08 JST (local time) with magnitude 6.7. The epicenter located at 42.72° North, and 142.0° East, where Atsuma-cho was registered as an area that has maximum intensity of 7. This earthquake induced landslide in several areas (Yamagishi and Yamazaki, 2018).
In this study an analysis was carried out using satellite images of ALOS-2/PALSAR-2. ALOS-2/PALSAR-2 is a satellite image of Synthetic Aperture Radar (SAR). SAR synthetically increases the antenna's size or aperture to increase the azimuth resolution through the same pulse compression technique as adopted for range direction. Synthetic aperture processing is a complicated data processing of received signals and phases from moving targets with a small antenna, the effect of which is to should be theoretically
AN APPLICATION OF SEGNET FOR DETECTING LANDSLIDE AREAS BY USING FULLY POLARIMETRIC SAR DATA
I Made Oka Guna Antara1*), Norikazu Shimizu2), Takahiro Osawa3,4), I Wayan Nuarsa5) 1)Graduate Student of Environmental Science, Udayana University 2)Department of Civil and Environmental Engineering, Yamaguchi University 3)Center for Remote Sensing and Ocean Sciences (CReSOS), Udayana University
4)Center for Research and Application of Satellite Remote Sensing (YUCARS), Yamaguchi University 5)Faculty of Agriculture, Udayana University, Denpasar, Indonesia
*Email: okagunaantara@gmail.com
ABSTRACT
The study location of landslide is in Hokkaido, Japan which occurred due to the Iburi Earthquake 2018. In this study the landslide has been estimated by the fully Polarimetric SAR (Pol-SAR) technique based on ALOS-2/PALSAR-2 data using the Yamaguchi’s decomposition. The Yamaguchi's decomposition is proposed by Yoshio Yamaguchi et.al. The data has been analyzed using the deep learning process with SegNet architecture with color composite. In this research, the performance of SegNet is fast and efficient in memory usage. However, the result is not good, based on the Intersection over Union (IoU) evaluation obtained the lowest value is 0.0515 and the highest value is 0.1483. That is because of difficulty to make training datasets and of a small number of datasets. The greater difference between accuracy and loss graph along with higher epochs represents overfitting. The overfitting can be caused by the limited amount of training data and failure of the network to generalize the feature set over the training images.
Keywords: ALOS-2/PALSAR-2, Fully Polarimetric SAR, Yamaguchi Decomposition, SegNet, Landslide
converted to the effect of a large antenna, that is a synthetic aperture length (Japan Association of Remote Sensing, 1996).
SAR has the ability in all weather and also able to work during the day and night, the superiority of this SAR is due to the use of microwaves that can heal clouds and rain to a certain degree.SAR applications have been applied in various fields, depending on their objectives, such as in the field of oceanography, agriculture, geology, disaster mitigation, and so on.In the past few years, the use of the Polarimetric SAR (Pol-SAR) system has increased which is applied to aircraft or satellites, Pol-SAR has become one of the attention of researchers to be developed.
Fully Pol-SAR data has a variety of information when compared with single or dual polarization SAR data, in terms of electromagnetic scattering characteristics to the intended target (Shibayama, T., et.al., 2015).Fully Pol-SAR data provides information in the form of a field scattering matrix, a scattering matrix consisting of
magnitude and phase on four polarizations (HH, HV, VH, VV) sent and received horizontally (H) and vertically (V) by the radar antenna.Various methods have been developed previously to obtain information on the surface characteristics of the earth from Fully Pol-SAR data. In 1997 Cloude and Pottier used coherence or covariance matrices to make eigenvector decomposition. Yamaguchi et.al. in 2005 developed an approach for four components, called Yamaguchi's Decomposition. Satellite observations were made on September 8, 2018.The Satellite observation was in September 8th, 2018.
Here we try to apply Deep Learning with SegNet architecture to the fourcomponent Yamaguchi’s decomposition. Deep learning is part of the field of machine learning, more and more studied in various fields in the early 2010s.A few years after that, the application is growing, producing extraordinary things in solving the perception, such as the problem of seeing and hearing that is now starting like humans, seem natural and intuitive, which was previously impossible for a machine. (Chollet, 2018).
Generally, Deep learning utilizes neural network architecture. Definition of "Deep" relates to the number of layers in the network to be used.Deep neural networks are inspired by the biological nervous system, use simple operating elements in parallel, and combine various layers for nonlinear processing (Mathworks, 2018).
One of the popular algorithms for deep learning in images and videos is Convolutional Neural Networks (CNN). CNN is similar to other neural networks, consists of input and output layers, and also hidden layers (Mathworks, 2018). Many algorithms are developed based on CNN, for example, autoencoder, LeNet, AlexNet, VGG, GoogLeNet, ResNet, SegNet and other.
There are two kind of CNN based on segmentation, first one is instance
segmentation and second one is semantic segmentation. Instance segmentation identifies each object in an image (Watanabe and Wolf, 2019), whereas semantic segmentation identifies and classifies every pixel belong to an object in an image explained byGarcia-Garcia et.al. (2018).
SegNet is a deep learning architecture, the function is for Semantic Segmentation as a labeler for each pixel image according to the class of the object that has been determined (Garcia-Garcia et al., 2018). The advantage of SegNet is that it can classify every pixel in the image, fast and efficient in memory usage. In starting, SegNet was used for self-driving cars (Badrinarayanan et al., 2017). However, we want to adopt this architecture for this research because of its advantages.
The data observed by ALOS-2/PALSAR-2 with level 1.1 SLC (SingleLook Complex) format is used to analyze landslides that occurred due to earthquakes in Hokkaido, Japan. The ALOS-2/PALSAR-2 is a SAR Satellite, which emits microwave and receives the reflection from an object to get information. ALOS-2/PALSAR-2is L-band satellite, which is does not affected by clouds and rains. The all-weather condition capability is suitable for monitoring disasters rapidly. In addition, L-band can reach to the ground partially with penetrating the canopy of vegetation to get information on the ground surface (JAXA, 2019).The earthquake occurred on 6September 2018 at 3:08 JST, with magnitude 6.7 and maximum intensity of 7 at Atsuma-cho (Yamagishi and Yamazaki, 2018). In Figure 1 shown the research location and in the Table 1 shown summary of ALOS-2/PALSAR-2 observation data.
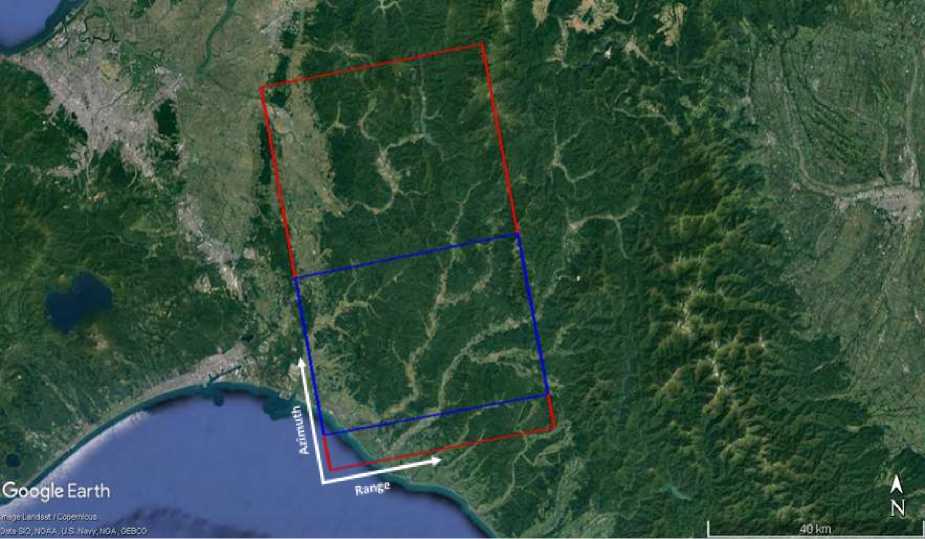
Figure 1.
Research location(Google Earth, 2019)
Red rectangle: shape of Satellite ALOS-2 Blue rectangle: cropping by Region of Interest (ROI)
Table 1. Summary of ALOS-2/PALSAR-2 observation
|
Observation mode |
Flight Direction |
Operation Mode |
Observation Direction |
Observation Date |
|
Full Polarimetry |
Ascending |
SM2 |
Right-side observation |
August 8th, 2018 |
The combination of coherent speckle noise and random vector scattering effects from the surface and volume in the SAR remote sensing application requires a multivariate statistical description. That matter used to identify the average or dominant scattering mechanism from the targets, as classification of the scattering data. The main purpose of target decomposition is: to break down the coherence matrix or covariance matrix into several independent matrices to represent scattering of the intended target.
In its application there are two parts to target decomposition, namely, first, a coherent decomposition (Cameron, 1990; Krogager, 1990; Touzi et al. 2002) applies
when one or two dominant scattering mechanisms are produced. This does not apply to the case of natural targets, moreover, the noise speckle is very influential on the coherent average.
Second, incoherent decomposition, described as the use of statistics to produce finer scatter behavior. This method produces Huynen-based methods (Huynen, 1970), vector-based (Cloude, 1986; Cloude and Pottier, 1996) and model-based decomposition methods (Freeman and Durden, 1998; Yamaguchi, 2005).
Model-based decomposition method with four scattering components proposed by Yamaguchi et al. (2005). The model is based on the Freeman-Durden model (Freeman and Durden, 1998), which is then expanded based on a certain degree of orientation in the case of vegetation and provides a helical
component in accordance with the symmetric case of non-reflection ^ SHHSHV ^≠ 0and {ShvS*vv }≠ 0
matrix or Sinclair matrix of SAR satellite system can defined as:
SHH
SVH
SHV
SVV
transmit
|
H |
V | |
|
H |
HH |
VH |
|
V |
HV |
VV |
(1)
The data set in the pixel area is expressed as a coherence matrix, as follows:
Figure 1. Transmit and receive in SAR satellite system.
H: horizontally; V: vertically
([ T1)HV
|
Γ τ 11 |
T 12 |
T 13 |
|
rτι * T12 |
T 22 |
T 23 |
|
rp* _ T13 |
rp* T23 |
T 33 |
(2)
Based on the transmit and receive in SAR satellite system in Figure 2.7, scattering
HV
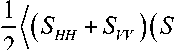
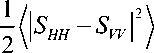
2(lSHH + SVV I
' HH — SVV )( SHH + SVV )
HH
-

— Svv )’)
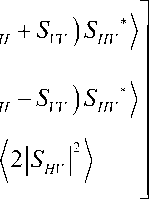
Where * denotes conjugation and <> denotes averaging.
Thescattering power double-bounce (Pd), based on the coherency matrix, is defined as:
Pd = K SHH — Svv Q — 2(∣SHV f) (1 + M2 )
Scattering power volume (Pv) is defined as:
Pv = 8(∣SHV∣2)-4∣Im{SH (Shh -Sw))∣(7)
Scattering power surface (Ps) is defined as:
Ps = T1 - 2T„ + 2 ∣ζ∣ (1 + ∣β2)
Ps = SHH + Sw Γ) - 4(∣SHV i) + 2∣Im(SHv ( Shh - Svv ))|(1 + ∣β 2 )
And, scattering power helix (Ph) is defined as:
P, = 2∣Im{S’Hv (Shh -Svv))∣(11)
Where: α =
and β =
RR
The Bragg coefficient h (horizontally) and v (vertically)polarized wave, defined as:
Rh
(12)
(εr - 1){sin2 θ - εr (1 + sin2 θ)} (εr cos θ + ^εr - sin2 θ )
(13)
whereθ is the incidence angle and εr is the constant of the relative dielectric of the surface.In Figure 2.8 is shown the characteristic of the four-component of Yamaguchi’s decomposition. Table 2 shown scattering mechanism and its correspondence to typical object.
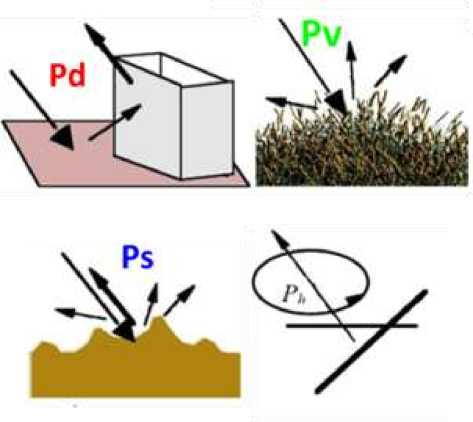
Figure 2.
The scattering power of four component decomposition( Ps , Pd , Pv , and Ph ) (Yamaguchi, 2012;Saepuloh and Bakker, 2017)
Table 2. Scattering mechanism and its correspondence to typical object (Yamaguchi, 2012).
|
Scattering Type Typical objects |
Other candidates |
|
Double- Objects made by human bounce |
Isolated trees, vegetation in row |
|
Volume Vegetations |
Edges that produce the cross polarized HV component |
|
Bare soil surface, crop field, Surface snow, volcano ashes |
Sea surface, water body |
|
Helix Circular polarization state |
No-specific condition |
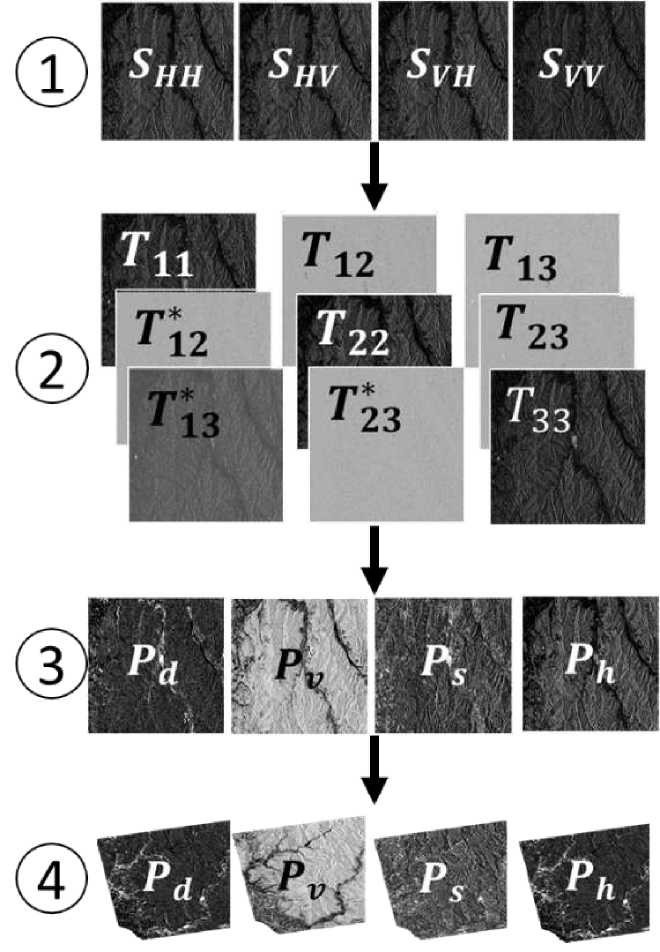
Figure 3.
Flowchart of Yamaguchi’s decomposition (Yamaguchi et al., 2006).
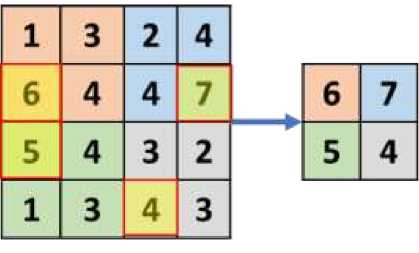
The Deep convolutional neural network for semantic segmentation as known SegNet. Built from the Encoder-Decoder network which is the architecture implementation from VGG16 network with 13 convolutional layers. The encoder network function is to trainable segmentation engine, while decoder function for classification the pixel-wise(Badrinarayanan et al., 2017). In Figure 4. shown the architecture of SegNet.The main idea of SegNet is using max-pooling, it function is to keep greater value in the image and the function of up-sampling is up-samples
image to higher scale(Chollet, 2018). In Figure 5 shown the example of max-pooling (a) and up-sampling (b). In Figure 6 shown flowchart to making datasets, (1) data from Yamaguchi’s decomposition as input; (2) generating composite of color from Pd as red, Pv as green, and Pv as blue, Ph in this case is ignored; (3) color composite image; (4) cutting image with size 360x480 pixel for datasets, datasets divided into 60% (162) training, 20%(54) test, and 20% (54) validation datasets from total (270) of datasets; (5) Labelling datasets.
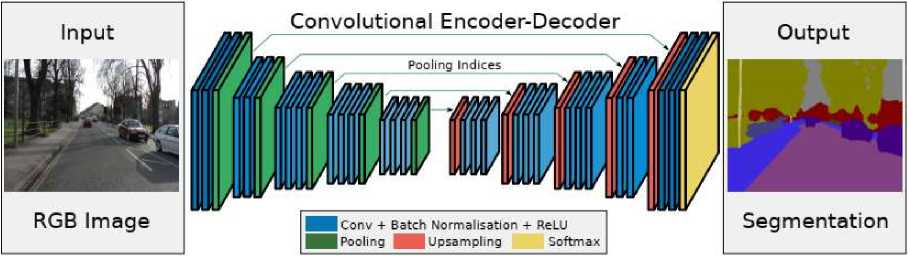
Figure 4.
The illustration of the SegNet architecture. These is only convolutional, there are no fully connected layers. A decoder up-samples its input using the transferred pool indices from its encoder to produce a sparse feature map(s). It then performs convolution with a trainable filter bank to densify the feature map. The final decoder output feature maps are fed to a soft-max classifier for pixel-wise classification (Badrinarayanan et al., 2017).
(a)
Figure 5.
(a) Max-pooling: down-sampling with (2x2) filter;
(b) Up-sampling with (2x2) filter(Chollet, 2018).
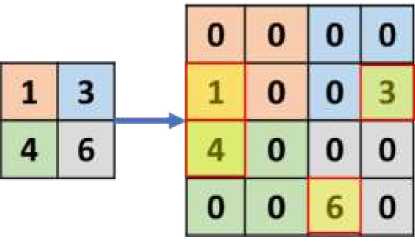
(b)
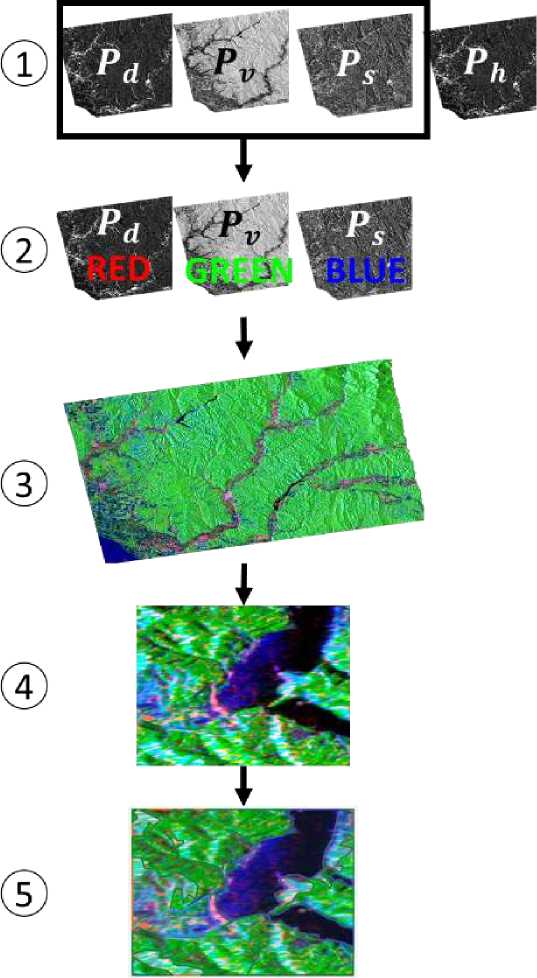
Figure 6.
Flowchart to making datasets.
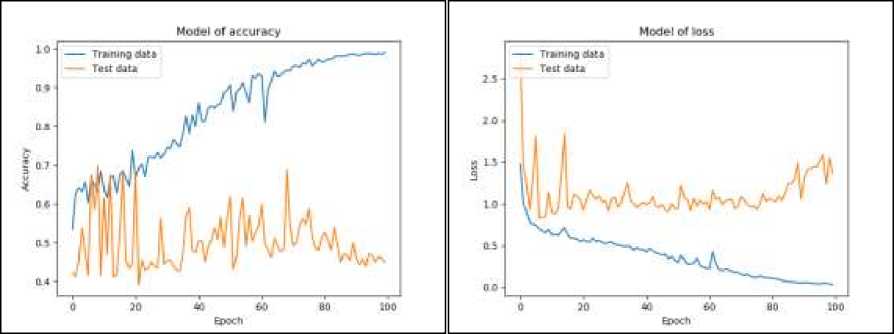
The first will explain the result of training data proses, in this case training data process with 100 epochs, the result shown in graph in Figure 7. The graph showing
overfitting, this because little training data is available (Chollet, 2018). Result of the SegNet implemented in Fully Pol-SAR data shown in Figure 8. In the process to labeling dataset is quite difficult, because of some color is same, for example bare-soil, rice field (before planting or after harvest), and landslide occur.
(a) (b)
Figure 7.
Result of training process. (a) Model accuracy and (b) model loss.
Validation Image (SAR data with color composite)
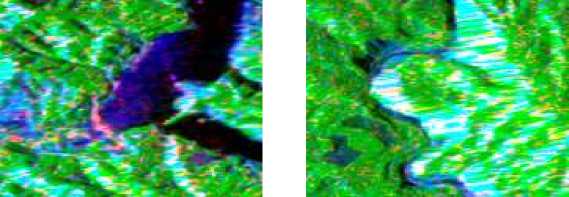
Estimation Image
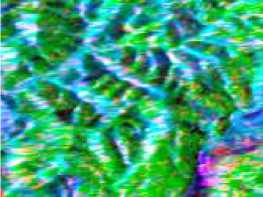
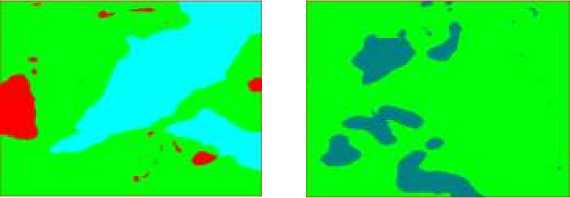
Figure 8.
Estimation result of SegNet architecture in this research.
Information:
Landslide = [255,0,0]
Bareland = [0,128,130]
Forest = [0,255,6]
Ricefield = [0,9,255]
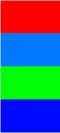
Rural_area = [255,192,128] Water_body = [0,255,255] Farming_area = [255,255,0]
Unlabelled = [0,0,0]

The evaluation of result from the architecture implementation, using IoU. The IoU score is used as a standard for measuring performance on segmentation problems in an object.IoU measurement provides information on the similarity between the estimated area and the ground-truth for the object in the
measured images(Rahman and Wang, 2016; Rezatofighi et al., 2019), the equation as bellow:
A ∩ B I
IoU = = —
A ∪ B U
(14)
where I and U denote the Intersection and Union respectively.
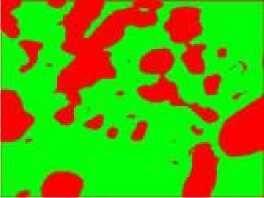
In Table 3 shows the percentage of IoU from Figure 9, the result is quite god, it depends on the quality of ground truth and the number of datasets. Ground truth is the label of data, in the process of labeling it quite difficult because of some color have same characteristic with another color, as for
example color of landslide with bare soil and water-body. But, perform of SegNet is quite good, faster, and efficiency. Quite good because from original dataset perform a good result (Badrinarayanan et al., 2017), faster and efficient because in this research using PC not high hardware configuration.
Real
Situation
Ground truth
(Labeling the real situation)
SAR data
(Color composite)
Estimation
(Results)
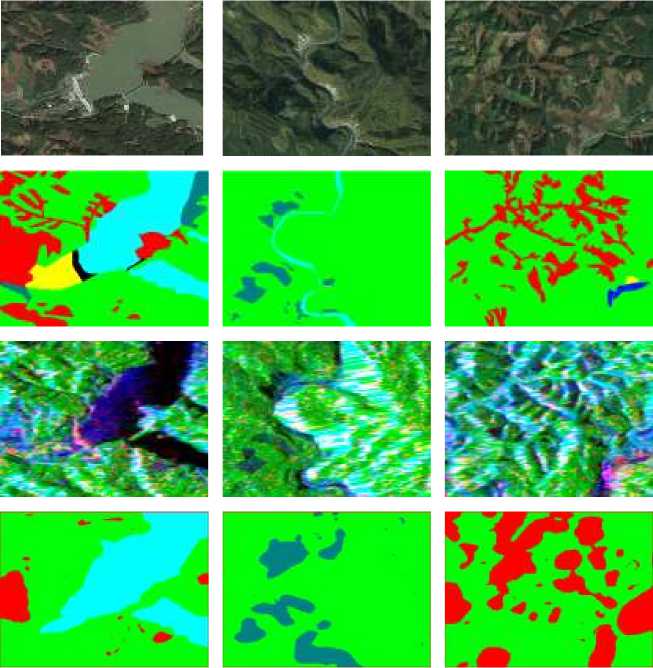
(a)
(b)
(c)
Figure 9.
Quality assessment of SegNet.
Table 3. IoU from Ground truth and Estimations
|
Estimations (Results) |
IoU |
|
(a) |
0.1483 |
|
(b) |
0.0515 |
|
(c) |
0.1388 |
In this research, the performance of the SegNet shows, that it is fast and efficient in memory usage. However, the end-result is not good, this is because of quality of training set as well as smaller dataset. Overfitting is also a problem which may occurs when the training data is limited and less varied.
There are certain ways to the chances of overfitting. Some of them are- having a larger database, using dropout layer in the network architecture, use of ‘early-stopping’ function etc. The quality of dataset also needs to be taken care of as it directly influences the result. For this we can take help of experts and may be random site survey of some places. For further improvement, transfer learning can be considered to utilize the already trained model on the landslide problem, that will help to reduce the time of training.
REFERENCES
Badrinarayanan, V., Kendall, A., Cipolla, R., 2017. SegNet: A Deep Convolutional Encoder-Decoder Architecture for Image Segmentation. IEEE Trans. Pattern Anal. Mach. Intell. 39, 2481–2495.
https://doi.org/10.1109/TPAMI.2016.264 4615
Cameron, W.L. and L.K. Leung. 1990. Feature motivated polarization scattering matrix decomposition. IEEE
International Conference on Radar.
DOI: 10.1109/RADAR.1990.201088
Cloude, S. R. 1986. Group theory and polarization algebra. OPTIK. 75(1), 26– 36.
Cloude, S. R. and Pottier, E. 1996. A review of target decomposition theorems in
radar.
Chollet, F., 2018. Deep Learning with python, Manning.
https://doi.org/10.1017/CBO9781107415 324.004
Freeman, A., and Durden, S. L. 1998. A three-component scattering model for polarimetric.
Garcia-Garcia, A., Orts-Escolano, S., Oprea, S., Villena-Martinez, V., Martinez-Gonzalez, P., Garcia-Rodriguez, J., 2018. A survey on deep learning techniques for image and video semantic segmentation. Appl. Soft Comput. J. 70, 41–65.
https://doi.org/10.1016/j.asoc.2018.05.01 8
Huynen, J. R. 1970. Phenomenological theory of radar targets. Ph.D. thesis. University of Technology, Delft, The Netherlands.
Japan Association of Remote Sensing. 1996. Synthetic Aperture Radar. Available in URL: http://wtlab.iis.u-
tokyo.ac.jp/wataru/lecture/rsgis/rsnote/cp 4/cp4-3.htm accessed April 1st, 2019
JAXA. 2019. ALOS-2 Project PALSAR-2. Available in URL:
https://www.eorc.jaxa.jp/ALOS-2/en/about/palsar2.htm accessed April 1st, 2019
Krogager, E. 1990. New decomposition of the radar target scattering matrix. Electronics Letters. 26, 1525-1527.
Mathworks. 2018. Introducing Deep Learning with MATLAB. Available in URL: https://www.mathworks.com/campaigns/ offers/deep-learning-with-matlab.html. accessed April 1st, 2019
Rahman, M.A., Wang, Y., 2016. Optimizing intersection-over-union in deep neural networks for image segmentation, in: Lecture Notes in Computer Science (Including Subseries Lecture Notes in Artificial Intelligence and Lecture Notes in Bioinformatics). pp. 234–244. https://doi.org/10.1007/978-3-319-50835-122
Rezatofighi, H., Tsoi, N., Gwak, J., Sadeghian, A., Reid, I., Savarese, S., 2019. Generalized Intersection over Union: A Metric and A Loss for Bounding Box Regression.
Saepuloh, A., Bakker, E., 2017. Identifying Successive Eruption of Guntur Volcanic Complex Using Magnetic Susceptibility and Polarimetric Synthetic Aperture Radar (PolSAR) Data. IOP Conf. Ser. Earth Environ. Sci. 71.
https://doi.org/10.1088/1755-1315/71/1/012004
Shibayama, T., Yamaguchi, Y. and Yamada, H. 2015. Polarimetric scattering properties of landslides in forested areas and the dependence on the local incidence angle. Remote Sensing. 7(11), pp. 15424–15442. DOI:
10.3390/rs71115424.
Touzi, R. and Charbonneau, F. 2002. Characterization of symmetric scattering using polarimetric SARs. Proceedings IGARSS. 1. 414–416
Watanabe, T. and Wolf, D. 2019. Instance Segmentation as Image Segmentation Annotation. Available in URL:
http://arxiv.org/abs/1902.05498.
accessed April 1st, 2019
Yamagishi, H., Yamazaki, F., 2018.
Landslides by the 2018 Hokkaido Iburi-Tobu Earthquake on September 6. Landslides 15, 2521–2524.
https://doi.org/10.1007/s10346-018-1092-z
Yamaguchi, Y., 2012. Disaster monitoring by fully polarimetric SAR data acquired with ALOS-PALSAR. Proc. IEEE 100, 2851–2860.
https://doi.org/10.1109/JPROC.2012.219 5469
Yamaguchi, Y., Yajima, Y., Yamada, H., 2006. A four-component decomposition of POLSAR images based on the coherency matrix. IEEE Geosci. Remote Sens. Lett. 3, 292–296.
https://doi.org/10.1109/LGRS.2006.8699 86
Yamaguchi, Y., Yajima, Y., Yamada, H. 2005. Four-component scattering model for polarimetric SAR image decomposition. IEEE Trans. Geosci. Remote Sens. 43. 1699–1706.
226
Discussion and feedback