EVALUATION OF LAND USE WITH REGIONAL SPATIAL PLAN (RTRW) USING SATELLITE DATA AND GIS IN BATUR UNESCO GLOBAL GEOPARK
on
Evaluation Od Land Use With Regional Spatial Plan (RTRW) Using Tellite Data And Gis In Batur Unesco Geopark [I Putu Wira Utama, dkk.]
EVALUATION OF LAND USE WITH REGIONAL SPATIAL PLAN (RTRW) USING SATELLITE DATA AND GIS IN BATUR UNESCO GLOBAL GEOPARK
I Putu Wira Utama1*), Takahiro Osawa2), I Wayan Sandi Adnyana3) 1)BappedaLitbangof Bangli Regency
2)Center for Remote Sensing and Ocean SciencesUdayana University 3)Environment Science Postgraduate Program Udayana University *E-mail: wira_ajus@yahoo.com
ABSTRACT
Development in Batur UNESCO Global Geopark which has an area of 19,422.39 ha has increased significantly in recent years. The existence of land constraints and to determine the suitability of land use, it is necessary to evaluate land use withregional spatial plan (RTRW).Landsat 8 satellite remote sensing data on 27 September 2017is used to create land use maps. Land use maps obtained through the process of image classification using supervised classification method and verified by ground check. From this technique result 11classes of land use. Furthermore, to evaluate of land use suitability wasconducted by comparing land usewith regional spatial plan (RTRW). In this process, there is an overlay between the land use maps with regional spatial plan (RTRW) map usinggeographic information system (GIS). The results of evaluation land use in Batur UNESCO Global Geoparkwith regional spatial plan (RTRW) overall has suitable area 10,863.14 ha (55.93%), not suitable area 8,275.58 ha (42.61%) and not detected/cloud interference 283.67 ha (1.46%).
Keywords: land use, evaluation, land use,satellite data, GIS,geopark.
The recognition of Batur caldera as the first geopark in Indonesia (year 2012) further adds to the commercial value of Kintamani. This attracts entrepreneurs to start making use of tourist arrivals by providing tourism facilities such as restaurants, guest houses, hot spring pools, agro tourism and other tourism facilities. The development of tourism facilities has increased significantly in recent years, but has not been matched by sustainable and professional management. Entrepreneurs build facilities tourism without refers to spatial plan and obstruct natural panorama which is actually the main attraction Kintamani(Agustini, 2015).
Remote sensing data, especially from satellite remote sensing systems, is very effective in identifying land cover for several reasons. This provides a synoptic and comprehensive view for a large area, which is not possible through land surveying (Richards, 2013). Remotely sensed satellite data have been used to monitor and obtain data of land cover and land use(Adnyanaet al., 2006). Landsat satellites have collected and archived moderate resolution data of the entire earth’s land surface long enough to be useful for monitoring trends and evaluating how land use has changed. Applications of Landsat data include agriculture, land mapping and change detection to uses in fresh and coastal waters (Knight and Kvaran, 2014).
The GIS can also provide a spatial overview of
detailed land use and closure (Wirosoedarmoet al., 2014). A GIS technology was developed from 1967 by Roger Tomlinson used for scientific investigation, resource management, development planning, cartography and so on, even more profitable than direct field surveys. GIS can be utilized to help incorporate or overlay between different maps and influence the formation of ground mapping units(Hidayati and Toyibullah, 2011).Using Landsat imagery and GIS process, Naningsi(2016) shows the change of land use in Bangli regency years 1997-2014 that the plantation increased 19,486.33 ha (36.89%) and residential increased 1,872.00 ha (3.47%). Land use should refer to the designation of the space within an area which includes the designation of space for the protection function and the designation of space for the cultivation function.
Efforts to balance the utilization of natural resources and the environment is through spatial planning based on the achievement of environmental function preservation (Wirosoedarmoet al., 2014).Preservation of environmental functions can be guaranteed by spatial use activities that pay attention to the carrying capacity of the environment. The carrying capacity of the environment becomes the most important consideration in spatial planning, both in the regional spatial plan (RTRW) and in the evaluation of land use. The objective of this research is to evaluate land use based on spatial plan (RTRW), so it is known the suitability of land use.
The research location is in Batur UNESCO Global Geopark, KintamaniDistric,Bangli oRegency, Baoli Province. Geogoraphically locao ted in 08 9’48" S – 08 21’26" Sand 115 17’52" E– 115 27’28" E. The total area of Batur UNESCO Global Geopark is 19,422.39ha or 37.29 percent of Bangli Regency (52,081 ha). The administrative boundaries of Batur UNESCO Global Geopark are northern Buleleng Regency, eastern Karangasem Regency, south Bangli Distric and westernManikliyu,Belancan, Bantang, Daup, Serai, and Awan Village (Figure 1).
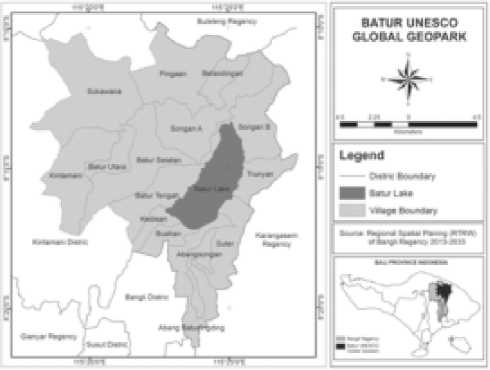
Figure 1.
Research Location
The materials of this research aresatellite data Landsat 8 OLI 30 x 30m and 15 x 15 m Panresolution, date 27 September 2017 Path/Row=116/ 66download from the website www.earthexplorer. usgs.gov.; regional spatial plan map of Bangli Regency (RTRW) scale 1: 60:000 from BappedaLitbang ofBangli Regency; Worldview 2 and Pleiades imagery of Bangli Regency year record 2013 until 2015, resolution 0.5 x 0.5 m, from Geospatial Information Agency (BIG) Bogor.
To conduct land use evaluation of land use with regional spatial plan (RTRW) are processed with GIS according to mechanism as shown in Figure 2.
-
A. Land Use Map
-
1) Cropping
Cropping of imagery was conducted to determine the locations of the research were observed in accordance with the administrative boundaries Batur UNESCO Global Geoparkusing ArcGis 10.5 software.
-
2) Color Composite Image (RGB)
There are three primary colors (red, green and blue) in displaying a color composite image. When
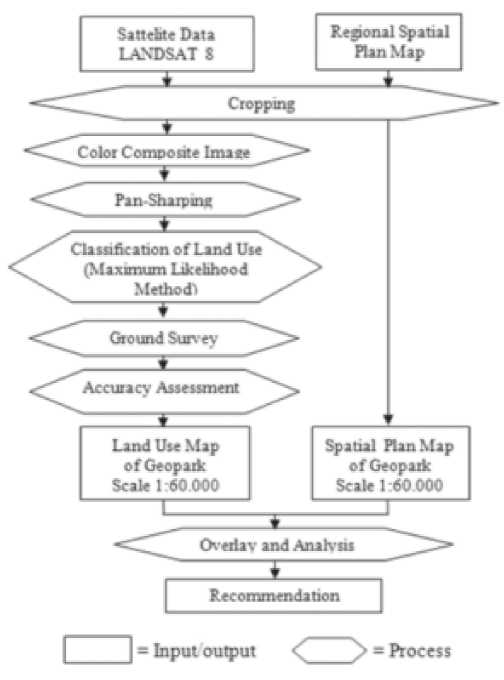
Figure 2.
Data Analysis Mechanism
these three colors are combined invarious proportions, they produce different colors inthe visible spectrum.Each spectrum band associates (not necessarily a visible band) to aseparate primary color results in a color composite image. This research used false color composite with 652 RGB bands and is combined usingArcGis 10.5 software.
-
3) Pan-sharpening
Pan-sharpening is a technique that merges high-resolution panchromatic data with mediumresolution multispectral data to create a multispectral image with high resolution features (Jaya, 2010).The Brovey transformation is based on spectral modeling and was developed to increase the visual contrast in the high and low ends of the data’s histogram (ESRI, 2005) It uses a method that multiplies each resample, multispectral pixel by the ratio of the corresponding panchromatic pixel intensity to the sum of all the multispectral intensities. Pansharping is process usingArcGis 10.5 software.
-
4) Classification of Land Use (Maximum Likelihood Method)
A maximum likelihood classification algorithm is one of the well known parametric classifies used for supervised classification. According to (ERDAS, 1999), the weighted distance or likelihood D of unknown measurement vector X
belong to one of the known classes Mc is computed based on the Bayesian equation:
D = ln (ac) - [0.5 ln(%Covc%)] – [0.5(X-Mc) T (Covc – 1) (X-Mc)]
(1)
where:
D = weighteddistance (likelihood) c = a particular class
X = unclassified vector based
Mc = predetermined class
ac = percent probability that any candidate pixel is a member of class
c (defaults to 1.0, or is entered from a priori knowledge)
Covc= the covariance matrix of the pixels in the sample of class c
|Covc| = determinant of Covc (matrix algebra) Covc-1 = inverse of Covc (matrix algebra) T = transposition function (matrix algebra)
-
5) Ground Check
Ground check activities were conducted by using random sampling method proportionally of area of each class. Determination of coordinates of observation points in accordance with existing land use objects accompanied by observation of objects and imagery of land use visibility on the actual conditions in the ground check. In addition, topographic conditions and accessibility also support for point coordinate retrieval. Coordinate point taken in ground check as much as 86 points. This observation aims to match the land use that has been interpreted in the imagery visually with actual land use conditions in the field. Intake of coordinates of ground check data points using Geographic Positioning System(GPS).
-
6) Accuracy Assessment
Accuracy analysis was conducted to determine the accuracy of the classification made. Accuracy is analyzed using a contingency matrix that is a square matrix containing the number of classified pixels, shown in the table. This matrix is often called “error matrix” or “confusion matrix”(Stehman, 1997). In this contingency matrix, the analyst can also calculate the accuracy of the producer (accuracy) and the accuracy of the users (user’s accuracy) of each class. The producer’s accuracy is the accuracy obtained by dividing the correct pixels by the total number of pixels of sample regions per class.The equations used to measure the estimated overall accuracy, user’s accuracy, producer’s accuracy and kappa coefficient are as follows:
Overall Accuracy = ¾J^ x 100%(2)
User’s Accuracy = (Xii /Xi+) x 100%(3)
Producer’s Accuracy = (Xii /X+i) x 100%(4)
n∑Γ ,(Xi+*X+0
Kappa (K) = i^1 r i^1--------x 100% τι2-*^+0
(5)
where:
r = number of row and column in cross classification table,
n = number of pixels in the example,
Xii = number of combinations along the diagonal, Xi+ = observations in row i, and
X+i = observations in columni.
-
B. Evaluation of Land Use
Evaluation of land use suitability is used for current revision of space utilization allocation. Evaluation of land use suitability is conducted by comparing land use with regional spatial plan (RTRW). In this process, there is an overlay between the land use map the regional spatial plan (RTRW)of Geopark map.The result will be shown in map and table.
-
A. Land Use Map
Using GIS analysis, it is obtained the area and percentage of each classes land use in the research area such as Figure 3 and Table 1.
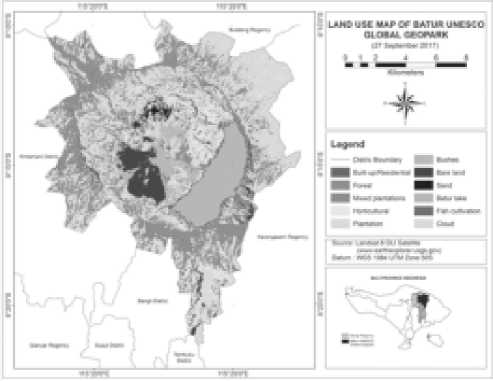
Figure 3.
Land Use Map of Batur UNESCO Global Geopark
Table 1 shown area of each classification in Batur UNESCO Global Geopark area is dominated by plantation with area of 7,317.60 ha (37.68%), followed by forest3,901.22ha (20.09%), mixed plantations 2,107.22ha (10.85%), horticultural 1,736.43 ha (8.94%), Batur lake1,532.09 ha (7.89%), bare land 1,003.63 ha (5.17%), bushes 933.12 ha (4.80%), built-up/residential 430.36ha (2.22%), cloud 283.67ha (1.46%), sand 112.84 ha (0.58%) and fish cultivation 64.21 ha (0.33%).
Table 1.Area and Percentage Based on Classification Results
|
No |
Classes of land use |
Area (ha) |
Percentage |
|
1 |
Built-up/Residential |
430.36 |
2.22% |
|
2 |
Forest |
3,901.22 |
20.09% |
|
3 |
Mixed plantations |
2,107.22 |
10.85% |
|
4 |
Horticultural |
1,736.43 |
8.94% |
|
5 |
Plantation |
7,317.60 |
37.68% |
|
6 |
Bushes |
933.12 |
4.80% |
|
7 |
Bare land |
1,003.63 |
5.17% |
|
8 |
Sand |
112.84 |
0.58% |
|
9 |
Batur lake |
1,532.09 |
7.89% |
|
10 |
Fish cultivation |
64.21 |
0.33% |
|
11 |
Cloud |
283.67 |
1.46% |
|
Total |
19,422.39 |
100.00 |
overall accuracy and kappa coefficient value (Table 2 and Table 3).
The accuracy in Table3 value for mixed plantation, horticultural, and plantation has a value below 100%, this is due to the small area of land ownership for each land use. Plantation and horticultural lands are being planted by other trees as barriers and shade trees to be detected as mixed plantation. From Table 3 if calculated value of Kappa accuracy based on the equation of number 5 obtained value 0.83.
Calculation of the overall accuracy shows that the process of map classification is acceptable because it has an overall accuracy value of more than 85% (Anderson, 1976). Meanwhile, according to Landis and Koch (1977), the coefficient value of kappa 0.81-1 is
Table 2.Confusion Matrix
|
GPS Data Clasifi- A cation data |
B |
C |
D |
E |
F |
G |
H |
I |
J |
Row Total | |
|
A |
3 |
0 |
0 |
0 |
0 |
0 |
0 |
0 |
0 |
0 |
3 |
|
B |
0 |
15 |
0 |
1 |
0 |
0 |
0 |
0 |
0 |
0 |
16 |
|
C |
0 |
1 |
6 |
1 |
2 |
0 |
0 |
0 |
0 |
0 |
10 |
|
D |
1 |
0 |
0 |
5 |
1 |
0 |
0 |
0 |
0 |
0 |
7 |
|
E |
0 |
0 |
3 |
0 |
25 |
0 |
0 |
0 |
0 |
0 |
28 |
|
F |
0 |
0 |
0 |
0 |
1 |
4 |
0 |
0 |
0 |
0 |
5 |
|
G |
0 |
0 |
0 |
0 |
0 |
0 |
4 |
0 |
0 |
0 |
4 |
|
H |
0 |
0 |
0 |
0 |
0 |
0 |
0 |
3 |
0 |
0 |
3 |
|
I |
0 |
0 |
0 |
0 |
0 |
0 |
0 |
0 |
6 |
0 |
6 |
|
J |
0 |
0 |
0 |
0 |
0 |
0 |
0 |
0 |
0 |
3 |
3 |
|
Column Total |
4 |
16 |
9 |
7 |
29 |
4 |
4 |
3 |
6 |
3 |
86 |
|
Overall accuracy: |
(3+15+6+5+25+4+4+3+6+3)/86 = |
86,05% | |||||||||
|
Where: A:Built-up/Residential B: Forest, C: Mixed plantations D: Horticultural |
|
I: Batur lake J: Fish cultivation | |||||||||
Table 3.Assessment Classification Results
|
No |
Classification |
Producer’s Accuracy |
User Accuracy |
|
1 |
Built-up/Residential |
3/4=75% |
3/3 = 100% |
|
2 |
Forest |
15/16 = 93.75% |
15/16 = 93.75% |
|
3 |
Mixed plantations |
6/9 = 66.67% |
6/10 = 60% |
|
4 |
Horticultural |
5/7 = 71.43% |
5/7 = 74.43% |
|
5 |
Plantation |
25/29 = 86.21% |
25/28 = 89.29% |
|
6 |
Bushes |
4/4 = 100% |
4/5 = 80% |
|
7 |
Bare land |
4/4 = 100% |
4/4 = 100% |
|
8 |
Sand |
3/3 = 100% |
3/3 = 100% |
|
9 |
Water body |
6/6 = 100% |
6/6 = 100% |
|
10 |
Fish cultivation |
3/3 = 100% |
3/3 = 100% |
The method used to calculate the accuracy of classification by using the error matrix is then done producer’s accuracy calculation, user accuracy,
included in very high category, this means that the value of the accuracy test on the classification results can be trusted.
-
B. Evaluation of Land Use with Regional Spatial
Plan
Evaluation of land use with regional spatial plan is done to determine the suitability of land use utilization with the planning documents that has been established in regional regulation. With overlay method, the level of suitability for each land use in Batur UNESCO Global Geopark area will be known. Below are the results of the evaluation (Figure 10 and Table 4).
Overall Table 5 shows the land use in Batur UNESCO Global Geopark has deviations with regulation of regional spatial plan (RTRW). Overall
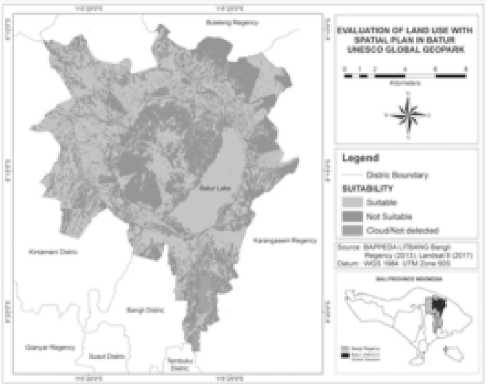
Figure 4.
Map of Evaluation Existing Land Use with Spatial Plan
percentage of suitable area is 10,863.14 ha (55.93%) and not suitable 8,275.58 ha (42.61%) with cloud interference/not detected 283.67 ha (1.46%).To find out more detailed comparison between spatial plans with land use for built-up/residential will be shown in Figure 5 and Figure 6.
Intersect overlay between the land use(Figure 7) with spatial plan resultedsuitable only 114.64 ha or 26.64% of total built-up/residential. So the built-up/ residential in Batur UNESCO Global Geopark 73.36% is not suitable with the regional spatial plan.
Protection of the forests need to be improved in this region, from Figure 12 shown forest condition in Batur UNESCO Global Geopark is very different from the spatial plan. The analysis results in Table 4 shows that only 2,587.98ha (66.34%) suitable with the spatial plan. Figure 8-11are showsthe forest area in spatial plan.
Table 4. Result Evaluation Land Use with Regional Spatial Plan
|
Spatial Plan | |
|
No |
Land Use Total ABCD EF GHIJK |
|
1 |
Built-up/ 50.68 63.96 13.87 19.73 49.72 52.24 167.88 0.04 7.42 - 4.82 430.36 Residential |
|
2 3 |
Forest 5.17 15.62 1,751.40 61.32 273.04 502.22 1,266.82 6.17 10.63 - 8.83 3,901.22 Mixed 14.13 43.10 453.56 54.97 222.57 126.09 1,175.30 3.57 4.14 - 9.79 2,107.22 Plantations |
|
4 5 6 7 8 9 10 11 |
Horticultural 37.47 336.30 134.96 65.85 153.01 119.25 833.49 8.84 28.80 - 18.46 1,736.43 Plantation 55.60 119.75 1,865.92 160.20 784.93 356.81 3911.95 33.61 7.43 - 21.40 7,317.60 Bushes 2.85 22.51 12.07 88.19 25.84 719.73 55.48 3.92 - 2.53 933.12 Bare land 1.05 0.36 118.21 4.73 24.23 716.09 84.54 1.60 17.47 - 35.35 1,003.63 Sand 1.87 3.49 0.46 1.84 64.00 15.22 21.79 - 1.70 - 2.47 112.84 Batur Lake - - - - - - - - 17.09 63.35 1,451.65 1,532.09 Fish Cultivation - - - - - - - - 2.74 1.92 59.55 64.21 Cloud 9.11 3.45 35.03 0.41 21.52 1.43 206.45 6.09 0.09 - 0.09 283.67 Total 177.93 608.54 4,385.48 457.24 1,618.86 2,609.08 7,723.70 59.92 101.43 65.27 1,614.94 19,422.39 |
|
A D G J |
: Built-up/ residential B : Special Tourism Object C : Protected Forest : Limited Production Forest E : Grand Forest Park F : Nature Park Tourism : Plantation H : Horticultural I : Lake Border : Fish Cultivation K : Lake : Suitable : Not Suitable : Cloud/Not detect |
Table 5. Percentage of Suitable Area between Land Usewith Regional Spatial Plan
|
No |
Suitability |
Area (ha) |
Percentage (%) |
|
1 |
Suitable |
10,863.14 |
55.93 |
|
2 |
Not suitable |
8,275.58 |
42.61 |
|
3 |
Cloud/Not detected |
283.67 |
1.46 |
|
Total |
19,422.39 |
100.00 |
Land use for plantations is scattered in the region of Batur UNESCO Global Geopark, considering Bangli Regency is a producer of Kintamani arabica coffee. This plantation is also interspersed with other tree like orange tree (citrus sinensis, citrus nobilis, citrus reticulate, citrus unshiu),mangoes tree (mangifera L.), cashew tree (anacardiumoccidentale), clove tree (syzygiumaromaticum),jack tree(artocarpusheterophyllus). The analysis results obtained the land for plantation and mixed
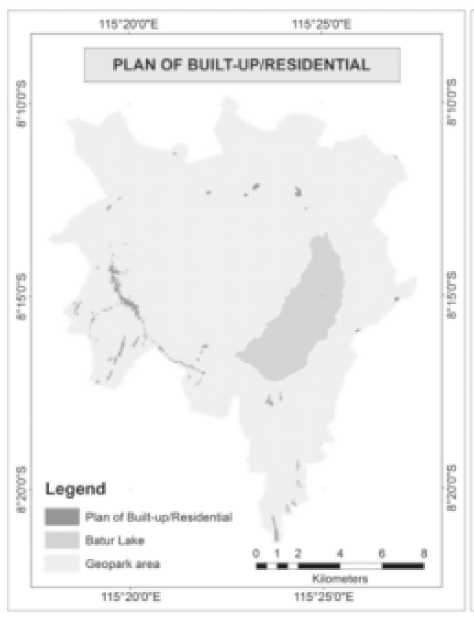
Figure 5 Plan of Built-up/Residential
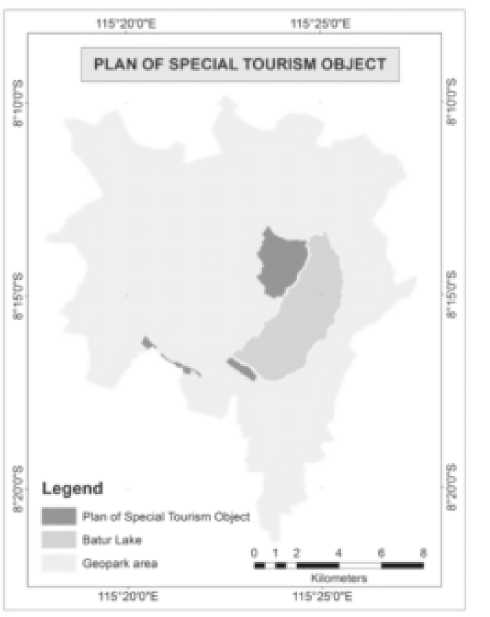
Figure 6
Plan of Special Tourism Object
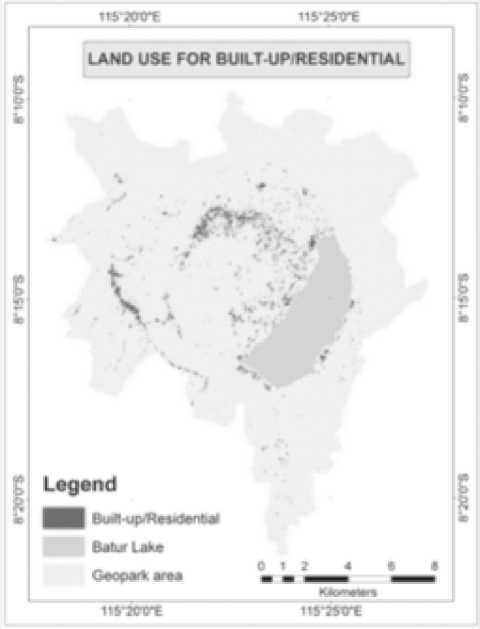
Figure 7.
Land use for Built-up/Residential
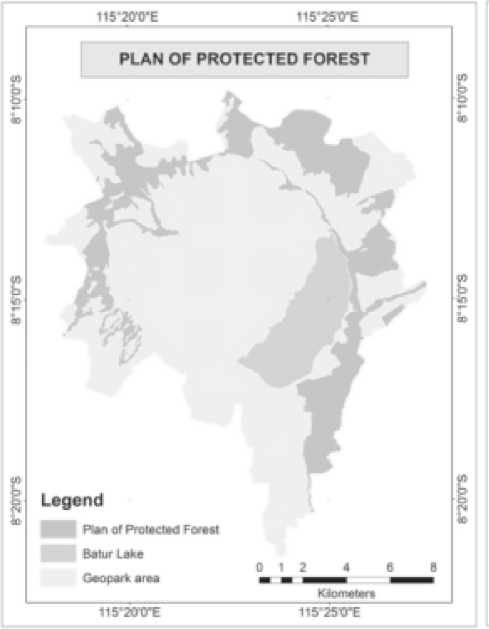
Figure 8.
Plan of Protected Forest
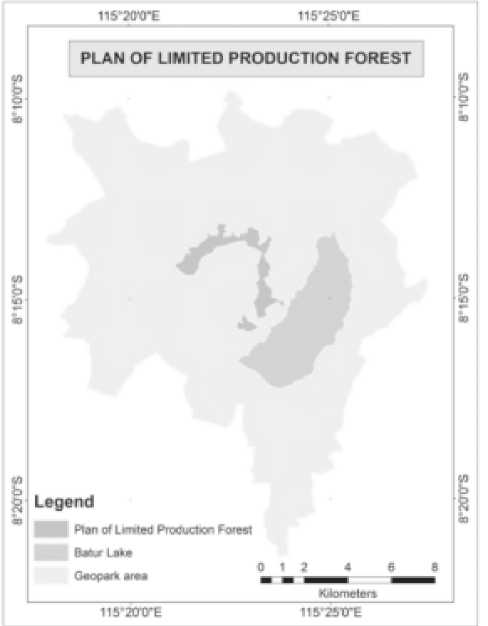
Figure 9.
Plan of Limited Production Forest
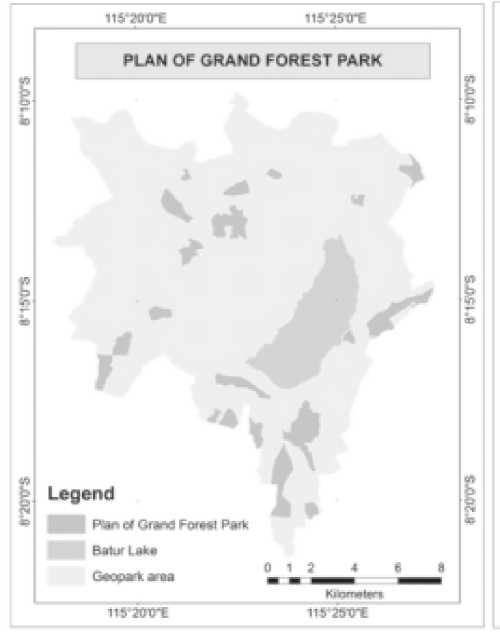
Figure 10.
Plan of Grand Forest Park
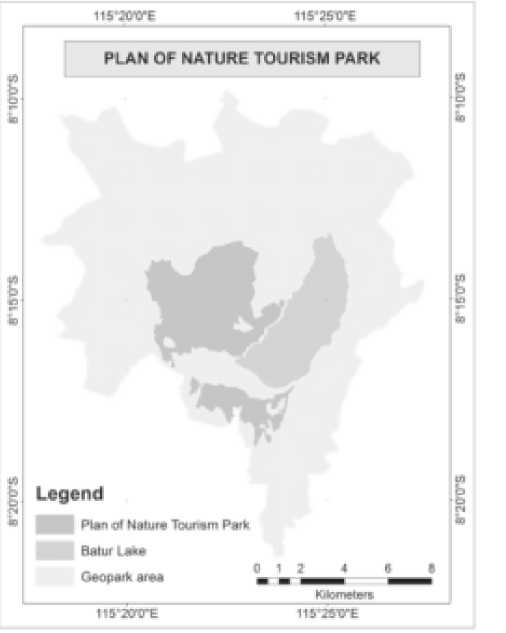
Figure 11.
Plan of Nature Tourism Park
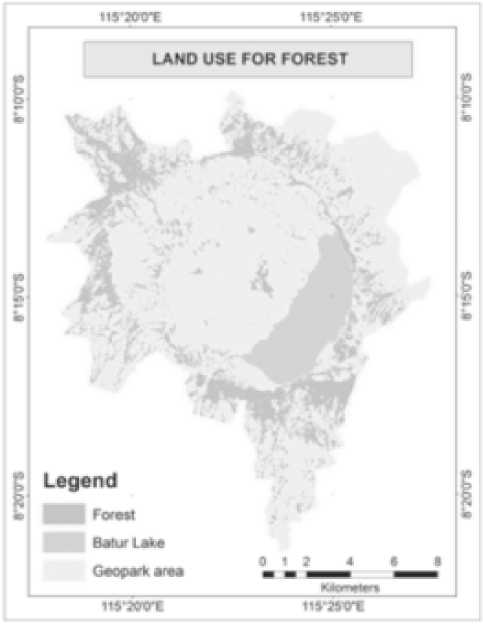
Figure 12.
Land Use for Forest
plantations in this region 7,317.60 ha and 2,107.22 ha. Land use for plantation in the spatial plan layout cover an area 7,723.70 ha, but if intersect overlay with land use is obtain the suitable only 5,087.25 ha (53.98%). Figures 14 and Figure 15showed the spread of land use for plantation and mixed plantations increase of the plan (Figure 13).
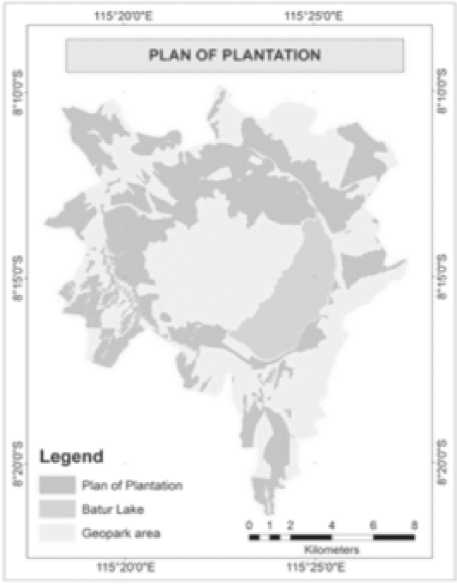
Figure 13.
Plan of Plantation
Land use for horticultural also increase significantly. From the analysis,land use for horticultural resulted 1,736.43 ha from 59.92 ha in the spatial plan document. Land use for horticultural in spatial plan document located in the west of Kintamani district, but in fact the development of horticultural takes place in the east of Kintamani district (Batur UNESCO Global Geopak). The analysis result using intersect overlay land use with spatial plan obtainsuitable8.84 ha or only 0.51% ofland use for horticultural, the remaining 99.49 % land use for horticultural not suitable with the spatial document. Figure 16 and 17 shows the plan and land use for horticultural.
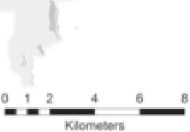
Utilization of the lake for fish cultivation also increased. Fish cultivation in spatial plan located in north of the lake to northeast (Figure 18). In the spatial plan document fish cultivation allocation 65.27 ha, but the land use spread to the south and west of the lake with total area 64.21 ha (Figure 5.19). Overlay result fish cultivation with spatial plan obtained suitable area only 1.92 ha (2.99%), the remaining 97.01 % fish cultivation not suitable with the spatial document.
Batur UNESCO Global Geopark has natural mineral resources. Sand detected by satellite imageshas an area 112.84 ha is mostly located in the northern part of Batur volcano (Figure 20). But the existence of sand in grand forest park and plantation areaare mining by community and sold illegally (Figure 21). In other place of sand minedsite produces large and deep holes. As conservation areas (Geopark) this activity is very contrary to the concept of
Figure 14.
Land Use for Plantation
Figure 15.
Land Use for Mixed Plantation
11S4JOXTE
ιt5∙aoτ
11S4StrtTE 11S25XΓE
PLAN OF HORTICULTURAL

Legend
Plan of Hoocutturil
BaIurLaiia
Gcoparli area
IlS1SO4O4E
115425XTE
Figure 16.
Plan of Horticultural
LAND USE FOR HORTICULTURAL I W


M
E
Legend
Horticultural
Batur Lake
Geopark area
115∙20XTE

012 a β a
■ ■ ^^h ^^v
Keonwter* tiFSvE
Figure 17.
Land Use for Horticultural
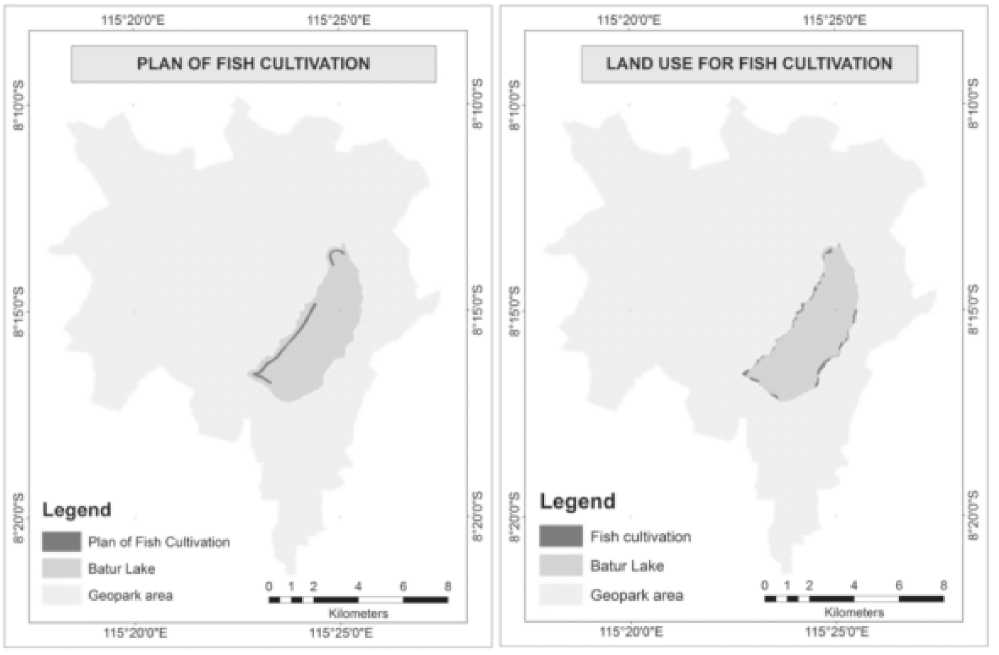
Figure 19.
Fish Cultivation
Figure18.
Plan of Fish Cultivation
protection, education and sustainable development. Geopark is basically aimed at raising awareness and understanding of issues in society, such as sustainable use of natural resources, reducing the impacts of climate change and reducing the risk of natural disasters.
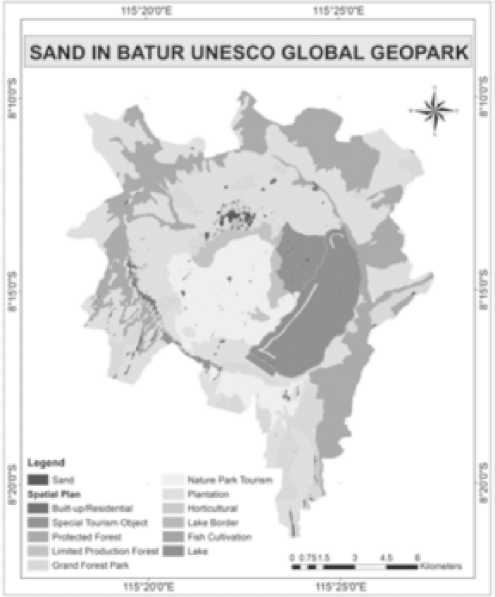
Figure 20.
Sand in Batur UNESCO Global Geopark
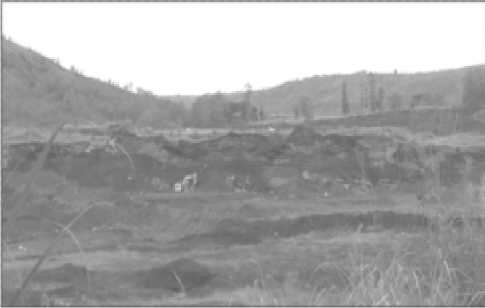
Figure 21.
Mining Activity in Batur UNESCO Global Geopark
Land use in Batur UNESCO Global Geopark area until 27 September 2017 interpretation with Landsat 8 satellite imagery, utilization the area in Batur UNESCO Global Geopark area is dominated by plantation with area of 7,317.60 ha (37.68%), followed by forest 3,901.22 ha (20.09%), mixed plantations 2,107.22 ha (10.85%), horticultural 1,736.43 ha
(8.94%), Batur lake1,532.09 ha (7.89%), bare land 1,003.63 ha (5.17%), bushes 933.12 ha (4.80%), built-up/residential 430.36 ha (2.22%), sand 112.84 ha (0.58%) and fish cultivation 64.21 ha (0.33%). Result of evaluation land use with regional spatial plan (RTRW) in Batur UNESCO Global Geopark overall has suitable area 10,863.14 ha (55.93%), not suitable area 8,275.58 ha (42.61%) and not detected/cloud interference 283.67 ha (1.46%) of 19,422.39 ha total area.
Suggestions for research development and all stakeholders in Batur UNESCO Global Geopark area are: (1) need for further research on the causal factor of land use change in the area of Batur UNESCO Global Geopark, (2) need community awareness in Batur UNESCO Global Geopark area because many threats and problems caused when land use is not suitable with regional spatial plan, (3) to Bangli government, before preparing a Detailed Spatial Plan of Batur needs to be considered changes to the current region spatial plan because the deviation is already very high with the existing land use, and (4) to central and local governments in preparing the master plan in the UNESCO Global Geopark Batur area should pay attention to land capacity and land functions.
REFERENCES
Adnyana, I W.S., Nishio, F., Sumantyo, J.T.S., Hendrawan, G. 2006. Monitoring of Land Use Change Using Aerial Photograph and Ikonos Image in Bedugul, Bali. Remote Sensing and Earth Science 3: 51-57.
Agustini, N.L.P.K. 2015. “Destination Management and Imaging Kintamani Towards Sustainable Tourism” (Dissertation) Denpasar: Udayana University. Available from: http:// erepo.unud.ac.id/10100/1/ 4f6bbe35ad8d7260e6cb25964432a49a.pdf.
Anderson, J.R., Hardy, E.E., Roach, J.T., Witmer, R.E., 1976 Land Use and Land Cover ClassificationSystem for Use with Remote Sensor Data. Washington: Geological Survey Professional Paper 964. Available from:https:// pubs.usgs.gov/pp/0964/report.pdf.
Bangli Government. 2013. Peraturan Daerah KabupatenBangliNomor 9 Tahun 2013 tentangRencana Tata Ruang Wilayah KabupatenBangli 2013-2033. Bangli: Government of Bangli Regency.
ERDAS. 1999. Field Guide Fifth Edition, Revised and Expanded .US: ERDAS Worldwide Headquarters. Available from: http:// web.pdx.edu/~emch/ip1/FieldGuide.pdf.
ESRI. 2005. GIS Solutions for Environmental Management. New York: Environmental
Systems Research Institute, Inc. Available from: http://www.esri.com/library/brochures/pdfs/gis-sols-for-env-mgmt.pdf
Hidayati, I. N., Toyibullah Y. 2011. Kajian Indeks Potensi Lahan Terhadap Pemanfaatan Rencana Tata Ruang Wilayah Menggunakan Sistem Informasi Geografis di Kabupaten Sragen. Globë , 13 (No. 2): 156–164.
Jaya, I N.S. 2010. Analisis Citra Digital Perspektif Penginderaan Jauh untuk Pengelolaan Sumber Daya Alam. Bogor: IPB Press.
Knight, E.J., Kvaran, G. 2014. Landsat-8 Operational Land Imager Design, Characterization, and Performance. Remote Sensing. 6: 10286-10305.
Landi, J., Koch, G. 1977. The Measurement of Observer Agreement for Categorical Data. Biometrics 33:159–74 available from https:// www.dentalage.co.uk/wp-content/uploads/ 2014/09/landis_jr__koch_gg_1977_kappa_ and_observer_agreement.pdf
Naningsi, N. 2016. “Study of Land Use Change From 1997 to 2014 Using Landsat Data InBangli Regency” (tesis). Denpasar:Udayana University.
Richards, J.A. 2013. Remote Sensing Digital Image Analysis: An Introduction. 5th. New York: Springer Heidelberg.
Stehman, S. 1997. Estimating Standard Errors of Accuracy Assessment Statistics Under Cluster Sampling. Remote Sensing of Environment, 60: 258–269.
Wirosoedarmo, R., Widiatmono J.B.R., Widyoseno, Y. 2014. RTRW Arrangement Based on
Environmental Supportability Based on Land Capability. Agritech, 34 (No. 4): 463-472. Available from: https://media.neliti.com/media/ publications/92932-ID-rencana-tata-ruang-wilayah-rtrw-berdasar.pdf.
67
Discussion and feedback