STUDY OF LAND USE CHANGES AND ITS RELATIONSHIP WITH TEMPERATURE AND DENGUE FEVER IN 2003 AND 2016 OVER JAKARTA PROVINCE USING LANDSAT 7+ETM AND LANDSAT 8 OLI
on
ECOTROPHIC • VOLUME 12 NOMOR 1 TAHUN 2018
p-ISSN: 1907-5626, e-ISSN: 2503-3395
STUDY OF LAND USE CHANGES AND ITS RELATIONSHIP WITH TEMPERATURE AND DENGUE FEVER IN 2003 AND 2016 OVER JAKARTA PROVINCE USING LANDSAT 7+ETM AND LANDSAT 8 OLI
Risya Lailarahma1*), I Wayan Sandi Adnyana2)
1)Graduate Study of Environmental Science, Udayana University 2)Faculty of Agriculture, Udayana University *Email: risya_lailarahma@yahoo.co.id
ABSTRACT
Land use changes over Jakarta caused by urbanization affected the increasing of infrastructure and decreasing vegetation from 2003 to 2016. This condition reduced water infiltration and caused inundation when heavy rainfall coming. Then Aedes aegypti would breed.and increased which brought dengue fever desease. This study was about analyzing the land use change in Jakarta Province using Landsat image, and its relationship with land surface temperature and dengue fever distribution. The effects of land use change also analysed by this study which including the effects from temperature and dengue fever that analysed by indices of land use in Jakarta at 2003 and 2016. The temperature analysis could be obtained by TIR band in Landsat and using some algortitma which calculated in band math of ENVI software. Vegetation index value’s average decreased from 0.652 in 2003 to 0.647 2016 in 2016. Built up index value’s average increased from -0.03 in 2003 to -0.02 in 2016. While Bareland index value’s average decreased from 0.16 in 2003 to -0.46 in 2016. Land surface temperature increased 3ÚC from 2003 to 2016. Vegetation area decreased 27.929 ha, bare land area decreased 6.012 ha, while built up area increased 34.278 ha from 2003 to 2016. Increasing of land surface temperature proportional to increasing dengue fever patients 1.187 patients. Increasing of land surface temperature increasing dengue fever cases 1.187 patients. To review and monitor more about the relationship between landuse changes and temperature changes required image with high resolution so that the results obtained more accurate. Complete data of dengue fever per subdistricts also required to analyse further more about relationship between landuse changes, temperature changes, and dengue fever.
Keywords: land use, temperature, dengue fever, Landsat.
Landuse changes over Jakarta caused by urbanization with population pressure and the socioeconomic dynamics that continued to rise. Like many urban areas all over the world, Jakarta, Indonesia, is growing. Since 1976, the population has more than doubled. More people require more housing, more stores, and more streets. This urban growth meant that surrounding, undeveloped land has been transformed. The vegetation areas in Jakarta was decreased, whereas the area of vegetation was a very important area in terms of water infiltration. In 1982, wide area of vegetation was 40% of the area of Jakarta. It was decreased in 2000 become 20%, and it was reached 13% in 2013. (Budiman, 2014)
The settlement areas was increased year by year, it was the opposite with the vegetation areas. In 1950, it was 11.5% of the area of Jakarta. It was increased in 1970 become 61.9% and it was reached 86.3% in 2008. (Kunu, 2010) In reality, this phenomena had an adverse impact on the environment. Decreasing in vegetation into land up causing water catchment areas to be reduced. And the flood would be happen when the heavy rain-fall down. Prolonged flooding make puddles in every where. These conditions favored Aedes aegypti to breed.and their number is
increasing a lot in these conditions. And when they bite humans and suck the blood as food, then it transmit an infection called dengue fever. So many peoples killed by this desease. So in this case, dengue fever become essential for observation (Masahiro, 2012).
In addition to the development of dengue fever, when the settlement areas was increased, so many activities of human also increased. Fuel oil for a review purposes vehicle, carbon fumes from different factory, and other human activities causing temperatures to rise in the city. The burning of fuel not only emited greenhouse gases but also directly affected temperatures because of heat that escapes from sources like buildings and cars. So temperature would be the important thing to measure because of this event (Ghang, 2013).
In this modern era, temperature praticely could be calculated by remote sensing technology. Remote sensing has the accuracy of objective coverage and very spacious. A remote sensing instrument collected information about an object or phenomenon within the instantaneous-field-of-view instantaneous-field-of-view of the sensor system without being in direct physical contact with it. The sensor was located on a suborbital or satellite platform (Hanafi, 2011). The remote sensing technology could be used to showed the growth of the city (NASA, 2005).
The study was conducted in Jakarta, which was located at latitude: 6°122 523 S and Longitude: 106°502 423 E. It was also located on the north coast of the island of Java in the Indonesia archipelago in Southeast Asia. The urban heat island effect was linked to the built environment and threatens human health during extreme heat events. In this study, we analyzed whether characteristic land uses within an urban area were associated with higher or lower surface temperatures.
This concepts of research would analyse how the landuse change in Jakarta affect to the temperature, and what was the effects of landuse change and
temperature change for human. So this research would expected to make in anticipation of damage and disasters that would occured as a result of changes in land use and changes in temperature.
The landuse changes in Jakarta was increasing year by year. It’s affect the temperature which also increasing, and the increasing temperature would affect to global warming. And this phenomena also would affected to social healthy. The crowded area would made a bad condition in environment, for example the liquefaction. The liquefaction would invited the virus to made desease. It would damaged the health of society. The crowded area also could made flood disaster because of accumulation of garbage.
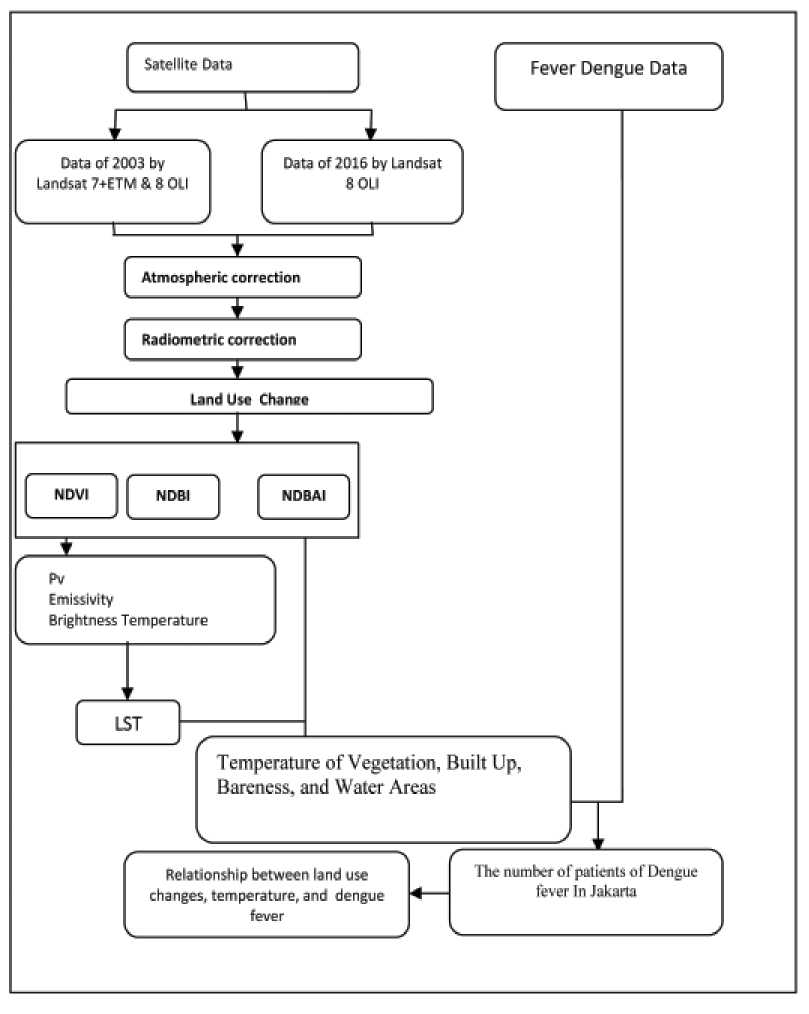
Figure 2.
Research Flowchart
This research used two kind of data:
-
1. Landsat+7ETM data in 2003 and Landsat 8 OLI data in 2015 which got from NASA’s website.
-
2. Dengue fever datas from 2003 until 2016 which B. got from ministry of health. 1)
The variables that used in this research were
Landuse changes (NDVI, NDBI, and NDBaI), emissivity, Brightness temperature, Land Surface Temperature (LST), and the number of patients with dengue fever by districts of Jakarta.
2)
-
A. Landuse Changes
Land use changes devided by four categories:
-
1. Normalized Difference Vegetation Index (NDVI) Vegetation was one of important parameter of landuse changes. The density of vegetation could be interpretated by NDVI. The NDVI numbers are from -1 until 1(Syeda, 2014).
NDVI = (NIR – RED)/(NIR + RED) (1)
-
2. Normalized Difference Buit Up Index (NDBI) Built up was very important thing to observe, because big city is almost contained bybuilding area. The density of the built up index could be interpretated by NDBI. The NDBI numbers are from -1 until 1 (Saad, 2014).
NDBI = (SWIR – NIR)/(SWIR + NIR) (2)
-
3. Normalized Difference Bare land Index (NDBaI) Bare land was one of important parameter in
landuse changes. The density of bare land could Be interpretated by NDBaI. The NDBaI numbers were from -1 until 1 (Chen, 2014).
NDBAI = (Red – TIR)/ (Red + TIR) (3)
Land Surface Temperature
Emissivity
Emissivity can be calculated by this formula:
ε = 0.985 Pv + 0.960 (1 - Pv) + 0.06 Pv (1 - Pv) …………………(8) Where Pv = t ]2 ………………(9…)
v
Brightness Temperature and Land Surfsace Temperature (LST)
Land surface temperature only could be calculated if emissivity and brightness temperature have been calculated. These parameters were related to each other. The LST also affected by center wavelength and Boltzmann constant. So it was closely related to radiation which emitted by the object. Generally, LST is calculated by degree farenheit, so it needs to reduced by 273.15 to obtain the celcius degree.
JCZ
T = ^^- ……………………………………..(10)
Where K1 is 774.885 K2 is 1321.08 for Landsat 8 and K1 is 666.09 and K2 is 1282.71 for landsat 7.
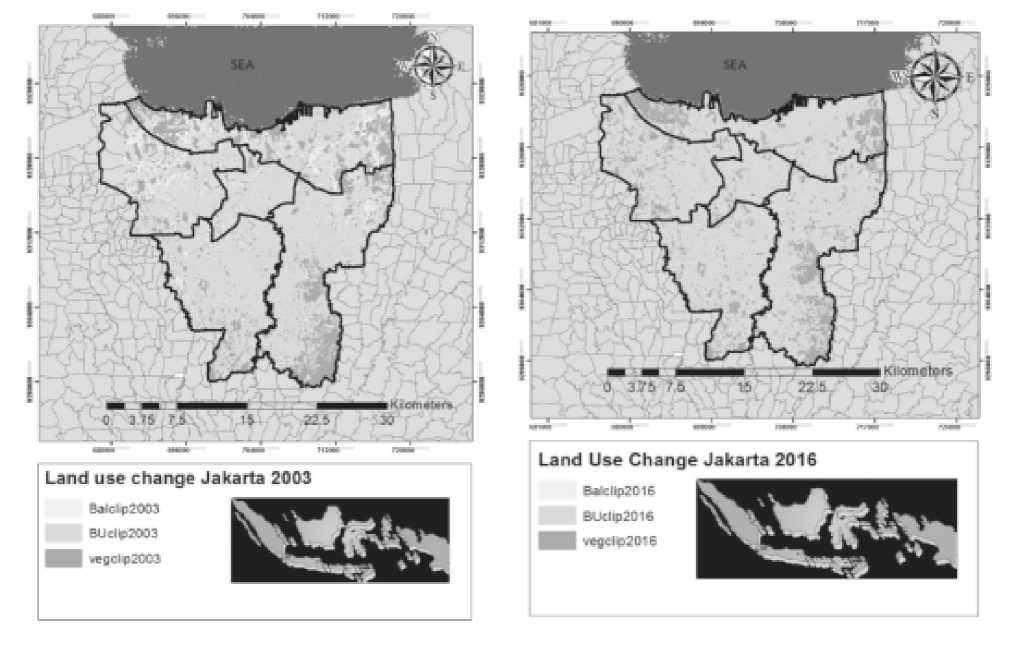
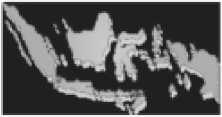
Figure 1.
Land Use Changes of Jakarta In 2003 and 2016
-
3) The number of patients with dengue fever by subdistricts of Jakarta
The number of patients with dengue fever by districts was the number which obtained by ministry of health directly. This number would be an input to Jakarta’s map, so dengue fever level would be seen clearly by sub-districts of Jakarta.
The result of supervised classification showed that bare land area decreased from 2003 to 2016. Most of bare land area converted to built up area about 98%. The results of land use map processing of DKI Jakarta (BPN DKI Jakarta, 1950, 1970, 2003) and field survey 2008 presented that the bare land area decreased from 8.7% to 4.9%. Vegetation area decreased 27.929 ha, bare land area decreased 6.012 ha, while built up area increased 34.278 ha from 2003 to 2016. Increasing of land surface temperature proportional to increasing dengue fever patients 1.187 patients. Nur and Sofan (2014) presented that vegetation area was decreased from 29% in 2007 to 9% in 2013. Land use change of Jakarta could be shown in Figure 1.
In this study, the clouds which covered the vegetation could be shown in the upper left image of 2003. The image of 2016 was almost clear by clouds, it affect the wide of vegetation area that actually was decreased. Built up area was increased about 21.3% from 2003 and 2016 because of many buildings developed. The results of land use map processing of DKI Jakarta (BPN DKI Jakarta, 1950, 1970, 2003) and field survey 2008 presented that the built up area increased from 61% to 86%. Land use pie chart could be shown in Figure 2.
Land Use of Jakarta
2003 e
-
■ Baehnl ■ Suill Up ■ VBgeWiori
-
Figure 2.
Land Use of Jakarta In 2003 and 2016
Land Use of Jakarta
2016

■ Breland ■ BuiltLto ∙VegKXion
Ibrahim (2016) in his research devided the images as six classes including: (1) built up areas, (2) green land, (3) forest land, (4) water bodies, (5) bare land. But in this study, images devided into 3 classes, they are built up, bare land, and vegetation. This classes classified based on their each indices. Each indices value would found to be analysed, they are built up index (NDBI), bare land index (NDBaI), and vegetation index (NDVI). Originally, the supervised classification was used to classify four classes. The calibration of the land cover and land surface temperature was carried out to ensure that the appropriate accuracy was achieved. Atmospheric and radiometric correction also very important thing in this research. Converting digital number to reflectance was done to found the indices of land use in Jakarta. While converting digital number to radiance spectral was done in thermal infra red (TIR) band to found land surface temperature value. Accuracy assessment was critical for a land cover classification to ensure the accurateness of the classification.
-
A. Normalized Difference Vegetation Index (NDVI) 2003 and 2016
NDVI value was decreased from 2003 to 2016 with average value was 0.652 in 2003 and 0.647 in 2016. Value of NDVI for vegetation was above 0.3, for built up was between 0 and 0.075, for bareness was between 0.2 and 0.3. NDVI could be shown in Figure 3.
Red colour showed higher density of NDVI, then yellow, green, and blue sequently from high untill low value of NDVI. The relationship between NDVI and dengue fever was inversely proportional. Dengue fever case per 100 can be shown in Figure 4. This value was corresponding to research of Ling (2006), The value of NDBI corresponded to research of Ling (2006), which present value of built up indix for NDVI <0.2, for NDBI 0.10-0.30, and for NDBaI <-0.2.
-
B. Normalized Difference Built Up Index 2003 and 2016
NDBI value was increased from 2003 to 2016 with average value was increased. Figure 5 also shown that red area in 2016 increased more and more clearly. Even most of area in the images was built up area which spread throughout Jakarta.
NDBI value was directly proportional with dengue fever data. NDBI value was increasing from -0.03462 to -0.02282 in proportion to the increase in
Table 1. Land Use Changes of Jakarta In 2003 and 2016
|
No |
Type of Land |
Area (ha) 2003 |
Area (ha) 2016 |
Difference |
% |
Value |
|
1 |
Bare land |
6,150 |
137,1 |
6.012 |
97.75 |
Ҥ |
|
2 |
Built Up |
15,500 |
49,778 |
34.278 |
68.86 |
§ |
|
3 |
Vegetation |
39,521 |
11,592 |
27.929 |
70.66 |
Ҥ |
|
4 |
Total |
61,171 |
61,507 |
336 |
- |
Ҥ |
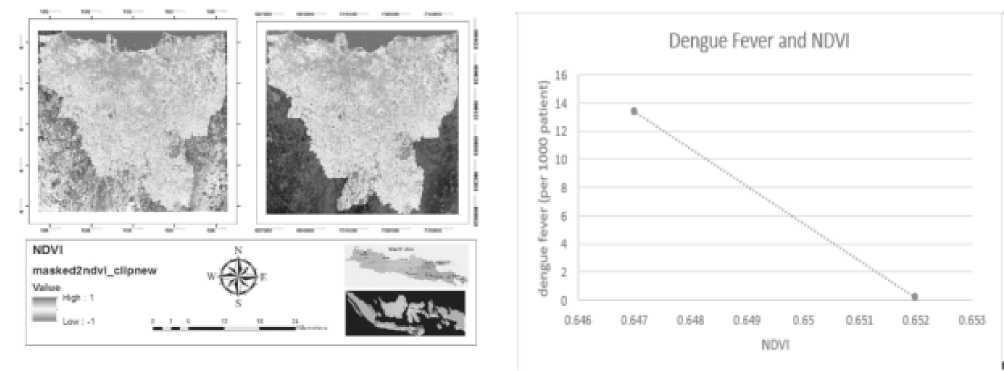
Figure 3. Figure 4.
NDVI of Jakarta In 2003 and 2016 NDVI of Jakarta
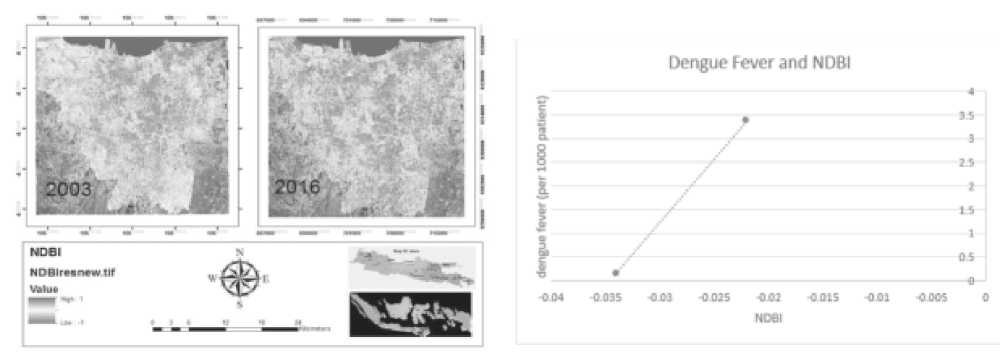
Figure 6.
NDBI of Jakarta
Figure 5.
NDBI of Jakarta
the value of dengue fever. The value of NDBaI corresponded to research of Ling (2006), which presented value of bare land index for NDVI <0.2, for NDBI 0.25, and for NDBaI >0.
-
C. Normalized Difference Bare Land Index 2003 and 2016
Research of Li at all (2017) indicated bare land as the land not covered by vegetation, buildings, or
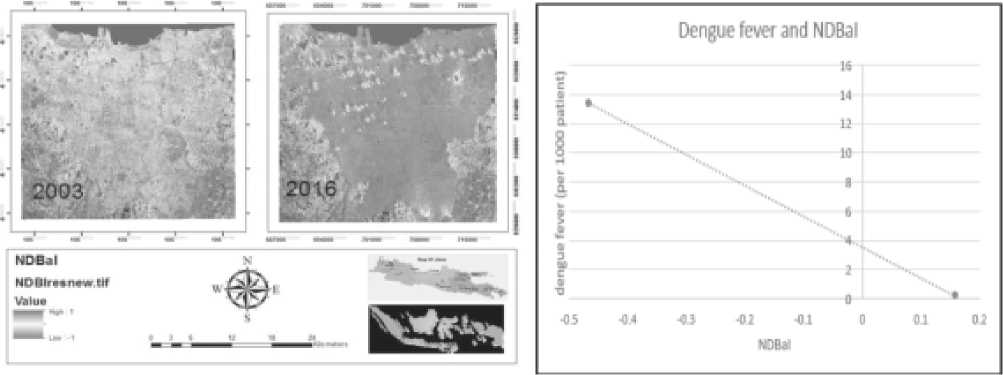
Figure 8.
NDBaI of Jakarta
Figure 7.
NDBaI of Jakarta
roads, on the Earth’s surface.NDBaI value decreased from 2003 to 2016. Figure 5.6 showed that red area in 2016 decreased.
NDBaI value was directly proportional with dengue fever data. NDBaI value was increased from -0.160541 to -0.02282 in proportion to the decrease in the value of dengue fever. The value of NDBaI corresponded to research of Ling (2006), which presented value of bare land index for NDVI <0.2, for NDBI 0.25, and for NDBaI >0.
-
A. Emissivity of 2003 and 2016
Emissivity value was related to the level of surface roughness with emissivity values that were not too far away. The value was corresponding to Fauzi (2014) research which got emissivity value of vegetation was about 0.968 to 0.990, for water was about 0.963 to 0.987, for built up was about 0.960 to 0.987, and for bareland was about 0.960 to 0.990.
Table 2. Emissivity of Jakarta
|
Vegetation |
0.986 |
0.960008 |
|
Bareland |
0.973 |
0.960007 |
|
Built Up |
0.995 |
0.960009 |
|
Water |
0.97 |
0.960009 |
The emissivity of a surface was controlled by such factors as water content, chemical composition, structure, and roughness. For vegetated surfaces, emissivity could vary significantly with plant species, areal density, and growth stage. In the mean time, emissivity was a function of wavelength, commonly referred to as spectral emissivity. Estimation of emissivities for ground objects from passive sensor data has been measured using different techniques. (Weng, 2004).
-
B. Brightness Temperature and Land Surface
Temperature
Brightness temperature value was not too far away difference with land surface temperature value. This value corresponding to Weng (2004) which got brightness temperature values are alomost equal to land surface temperature value.
The higher temperature value of land surface temperature that shown in red colour in the image below is built up area which had 28-35 degree celcius. The LST of built up area in 2003 was around 30-32 degree celcius and 31-35 degree celcius in 2016. This colour was almost increasing in 2016. Black and green area are sea and sea covered by clouds. LST vaue of vegetation was around 9-21 degree celcius in 2003 and 30-31 in 2016. LST value of bareland area in 2003 was around 26-29 degree celcius, and 27-31 degree celcius in 2016. While water area was around 26-29 degree celcius in 2003, become 27-31 degree celcius in 2016.
Bakri (2014) in his research found the LST value of Jakarta with minimum value 12 degree celcius, and maximum value 39 degree celcius. This value was got in dry season where the temperature was much increased comparing to rainy season. While in this study, rainy season was taken so that the maximum value was 35 degree celcius.
Urban heat island was proportionally related with urban size,population density and frequent activities according to the analysis in the local level. quantitative analysis between temperature and indices showed that great differences of temperature even existed in a land use/cover type except forvariations between different land use/cover types. (Zhao, 2006)
The measurement of LST from thermal remote sensors can be far more complicated than the method presented here. Factors such as the scale-dependent
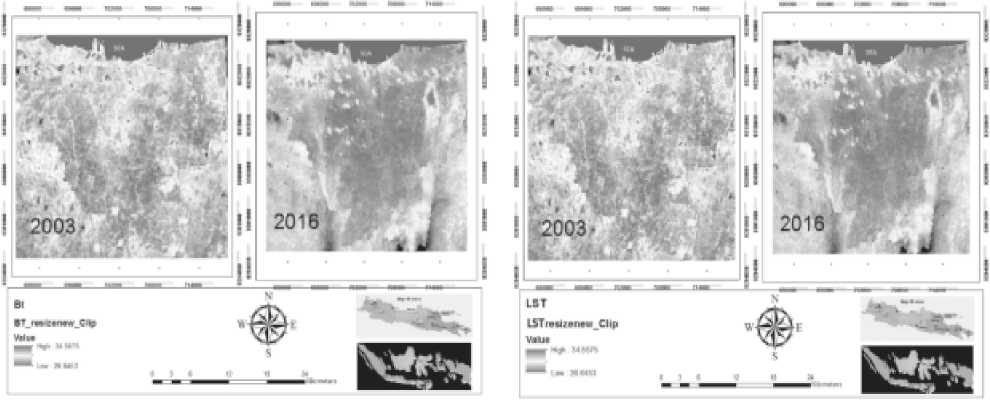
Figure 14.
Brightness Temperature and Land Surface Temperature of Jakarta in 2003 and 2016
nature of landscape characteristics, physiography, emissivity, atmospheric effects, and sensor-to-target noise have all contributed to the difficulties in the determination of LST at different spatial and temporal scales. To obtain a reasonably high quality of estimates, four stages of correction process are required: (1) spectral radiance conversion to at-sensor brightness temperature; (2) correction for atmospheric absorption and re-emission; (3) correction for surface emissivity; and (4) correction for surface roughness.
Robust and clear connections between temperature (mean temperature, maximum temperature and minimum temperature) and dengue incidence or cases were evident, especially mean temperature (23.2 °C–27.7 °C). It was well known that temperature positively affects dengue incidence, and the impact of temperature on dengue transmission has been repeatedly reported in various regions, but the relationships between temperature and dengue was significant in some studies but not in others. Minimum temperature was critical in many regions for mosquito survival and development rate in sustaining the population density. Low minimum temperatures had a negative effect on the survival of
adult and immature Aedes mosquitoes, and higher minimum temperatures might assist larval survival in winter. (Fan, 2015)
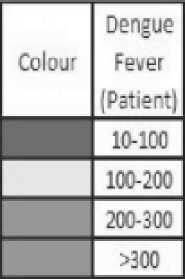
The number of dengue fever in Jakarta was directly proportional with land surface temperature value. Dengue fever value in 2003 was 150 case, and in 2016 increased became 1337 case. The spreading of dengue fever case per districts of Jakarta shown in Figure 15.
South Jakarta was the most highest cases of dengue fever, but the highest number was in cengkareng district that located in West Jakarta which marked by blue colour. It had more than 300 cases of dengue fever in Cengkareng. Then continued by East Jakarta, West Jakarta, North Jakarta,
Table 11. Dengue Fever case of Jakarta
|
Year |
Dengue Fever Case (patients) |
|
2003 |
150 |
|
2005 |
270 |
|
2006 |
316 |
|
2007 |
373 |
|
2008 |
317 |
|
2009 |
312 |
|
2016 |
1337 |
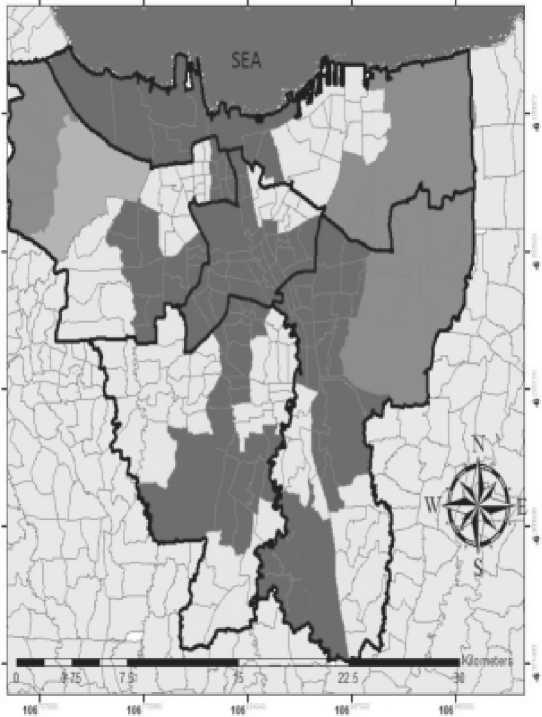
Figure 15.
Dengue Fever Level of Jakarta in 2003 and 2016
1995
1990
1985
1980
1975
1970
1965
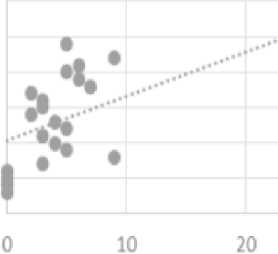

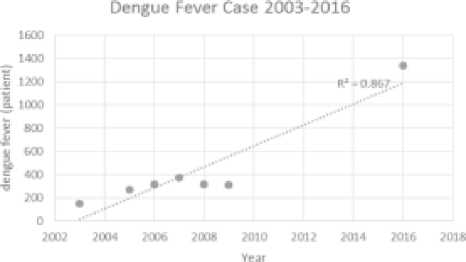
Figure 18.
Air Temperature and Dengue Fever Case in Jakarta (Source: Meteorological, Climatological, and Geophysical Agency (BMKG) and Ministry of Health)
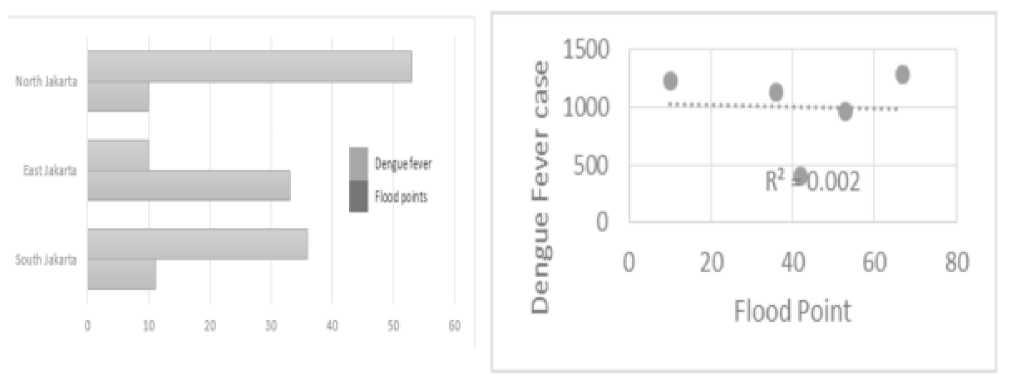
Figure 19.
Relationship Between flood Point and Dengue Fever Case in Jakarta (National Board for Disaster Management (BNPB), 2017)
Center of Jakarta, and Kepulauan Seribu sequently. Jakarta dengue fever case could from 2003 to 2016 could be shown in Table 11. The increasing of dengue fever case in Jakarta from 2003 to 2016 could be shown in Figure 16. This increasing was directly proportional with land surface temperature that shown in Table 12.
Figure 17 shows the increasing of air temperature and dengue fever case year by year:
Flood point in Jakarta was not so raises the symptoms of dengue fever. In healthy environments with good air filtration the air causes it was easy to absorb into the ground, so there was no air inundation that causes the Aedes aegepty mosquito to flourish.
But dengue fever cases was mostly affect by slums in Jakarta. Niken (2014) in his research explains that slums have altitude of puddles / floods that are generally high, where in this slums altitude on average between 50 meters and 1 meter (47%). While for long puddles generally occur during the day(49%) and also 2-3 days (35%). Generally puddles / floodsWhich occurs in these settlements occurring in each year.
Slums area associated with crowded and unhealthy region in Jakarta. In slums area, while the flood happened, the water infiltration doesn’t work properly, it would be had many inundation that affected Aedes aegepty to grow up. The correlation was shown in Figure 20.
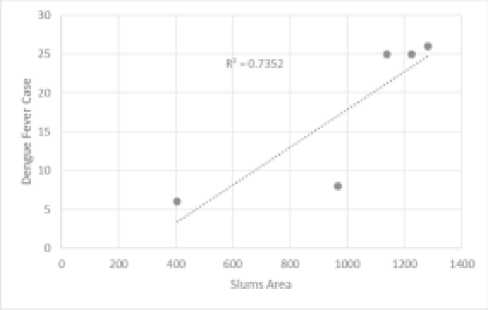
Figure 20.
Relationship Between Slums Area and Dengue Fever Case in Jakarta (Statistical Agency (BPS), 2016)
Table 5.13 Value of Slums in Jakarta
|
Slums Area |
Region (RW) (unit) |
|
West Jakarta |
67 |
|
North Jakarta |
53 |
|
Center Jakarta |
42 |
|
South Jakarta |
36 |
|
East Jakarta |
10 |
Vegetation area decreased 27.929 ha, bare land area decreased 6.012 ha, while built up area increased 34.278 ha from 2003 to 2016. Increasing of land surface temperature proportional to increasing dengue fever patients 1.187 patients. NDVI value’s average in 2003 was 0.652 and in 2016 is 0.647. The built up index value’s average in 2003 was -0.03 and in 2016 is -0.02. And Bareland index value’s index area was also decreased from 0.16 in 2003 to -0.46 in 2016.
Land surface temperature (LST) increased 3ÚC from 2003 to 2016 while LST of vegetation in 2003 was about 19-21 oC and in 2016 is about 30-31. While LST value of NDBI in 2003 was about 30-32 oC and in 2016 was about 31-35 oC. Bare land area had value of LST about 26-29 oC in 2003 and about 27-31 oC in 2016. Then, LST of water area in 2003 was about 2629 oC and about 27-31 oC in 2016.
Increasing temperature (LST) and NDBI directly proporsional to increasing of dengue fever case from 2003 to 2016. Whereas, decreasing NDVI, NDBaI inversely proportional to increasing dengue fever case. Dengue fever has a high correlation with the number of slums in Jakarta while the point of flood has a low correlation with dengue cases.
To review and monitor more about the relationship between landuse changes and temperature changes required image with high resolution so that the results obtained more accurate. It also required the complete data of dengue fever per subdistricts to have more better analysis.
REFERENCE
Bakri, G. N.2011. Analisis Peningkatan Suhu Permukaan Akibat Konversi Lahan Dengan Menggunakan Citra Landsat ETM+.(serial online).[cited 2015]. Available From: http:// repository.ipb.ac.id/jspui/bitstream/123456789/ 47221/3/G11gnb.pdf (05 July 2017)
Budiman, K.2014.Deteksi Perubahan Ruang Terbuka Hijau Pada 5 Kota Besar di Pulau Jawa (StudiKasus: DKI Jakarta, Kota Bandung, Kota Semarang, Kota Jogjakarta, dan Kota Surabaya).Jurnal Lanskap Indonesia Vol.6 No.1 21-25 (Januari 2014)
Chen, L.2014.A New Bare-Bareness Index for Rapid Mapping Developing Areas Using Landsat 8 Data: China, The International Archives of the Photogrammetry, Remote Sensing and Spatial Information Sciences, Volume XL-4, 2014 ISPRS Technical Commission IV Symposium, 14 – 16 May 2014, Suzhou, China: 256-260 (17 August 2016)
Fan, J.2015. A Systematic Review and Meta-Analysis of Dengue Risk with Temperature Change.China: Int. J. Environ. Res. Public Health 2015, 12: 1-15 (August 2016)
Ghang, H.2013.Cities Changes Temperatures for Thousands of Miles.(serial online).[cited 2013].Available from: http://www2.ucar.edu/ atmosnews/news/8773/cities-affect-temperatures-thousands-miles (15Agustus 2016)
Kunu, P. 2010. Penggunaan Lahan dan Evolusi Penggunaan Lahan di Provinsi DKI Jakarta.Jurnal Agroforestry Vol.V No. 3 255-260 (September 2015)
Li, H., Wang, C., Zhong C., Su, A., Xiong, C., Wang, J., and Liu, J.2017.Mapping Urban Bareland Automatically From Landsat Imagery.[cited 20 2010]. Available from: www.mdpi.com/2072-4292/9/3/249/pdf (7 Juli 2017)
Ling, Xiao.2006.Remote Sensing Image-Based Analysis of the Relationship Between Urban Heat Island and Land Use/Cover Changes.USA: Remote Sensing of Environment 104 (2006) 133– 146 (November 2016)
Masahiro, H.2012.Hydroclimatological Variability and Dengue Transmission in Dhaka, Bangladesh: A Time Series Study.(serial online).[cited 2012].Available from: http:// bmcinfectdis.biomedcentral.com/articles/ 10.1186/1471-2334-12-98 (24 Agustus 2016)
Meteorological, Climatological, and Geophysical Agency (BMKG).2017. South East Asia’s Environmental Future.(serial online).[cited 2015].Available from: http://www.nzdl.org/ gsdlmod?e=d-00000-00—off-0aedl—00-0——0-10-0—0—0direct-10—4———0-0l—11-ro-50—20-preferences—00-0-1-00-0—4——0-0-11-10-0utfZz-800&cl=CL1.4&d=HASHc3373e11118555a1e 295fc>=2 (05 June 2016)
NASA. 2005. Urban Growth In Jakarta, Indonesia. [cited 2005 July 22].Available from:http:// earthobservatory.nasa.gov/IOTD/ view.php?id=5693 (05 September 2016)
National Board for Disaster Management (BPNB).2017.Titik Banjir Jakarta.(serial online).[cited 2017].Available from: http:/ www.bpnb.go.id/ (02 July 2017)
Niken, H.2014. Identifikasi Karakteristik Lingkungan Permukiman Kumuh di Kelurahan Kapuk, Jakarta Barat: Jurnal Teknik Pomits Vol. 3 No. 2 (2014) ISSN: 2337-3539 (July 2017)
Nur, I dan Sofan, P.2014.Ruang Terbuka Hijau di Daerah DKI Jakarta Berdasarkan Analisis Spasial Dan Spektral Data Landsat 8.(serial online).[cited 2014]. Available from: http:// sinasinderaja.lapan.go.id/wpcontent/uploads/ 2014/06/bukuprosiding_498-504.pdf (10 September 2016)
Saad, B.2014.Built-Up Area Extraction Using Landsat 8 OLI Imagery.(serial online).[cited 2014].Available from: https://www.researchgate. net/publication/273886729_Built-up_area_extraction_using_Landsat_8_OLI_imagery (20 September 2016)
Statistical Agency of Jakarta (BPS).2016. Permukiman Kumuh Jakarta.(serial online).
[cited 2016].Available from:https://www.bps.go. id/linkTabelStatis/view/id/1762 (02 July 2017)
Syeda, B.2014.Normalized Difference Vegetation Index as a Tool for Wheat Yield Estimation: A Case Study from Faisalabad, Pakistan:The Scientific Journal Vol.2014.Article ID 725326: 245-248(August 2017)
Weng, Q.2004. Estimation of land surface temperature–vegetation abundance relationship for urban heat island studies.Bloomington: Jornal of Remote Sensing of Environment 89 (2004) 467–483 (July 2016)
Zhao, H.2012.Land Surface Emissivity Retrieval from Satellite Data. (serial online).[cited 2012]. Available from: http://www.tandfonline.com/doi/ abs/10.1080/01431161.2012.716540 (24 November 2016)
27
Discussion and feedback