STUDY OF OCEAN CIRCULATION IN INDONESIAN ARCHIPELAGO SEA USING THREE DIMENSIONAL OCEAN MODEL
on
Ecotrophic ♦ 4 (2) : 92 - 96
ISSN: 1907‐5626
STUDY OF OCEAN CIRCULATION IN INDONESIAN ARCHIPELAGO SEA USING THREE DIMENSIONAL OCEAN MODEL
I Dewa Nym. Nurweda P., Takahiro Osawa 1) and I Wayan Arthana 2)
-
1) Center for Remote Sensing and Ocean Science (CReSOS), Udayana University
-
2) Master Program of Environment Science Postgraduate Program Udayana University
ABSTRAK
Regional Ocean Modeling System (ROMS) dengan dua buah skema pencampuran vertikal yang berbeda telah digunakan untuk mensimulasikan kondisi arus dan temperatur di Perairan Kepulauan Indonesia. Skema yang pertama disesuaikan dengan metode K-Profile Parameterization (KPP) sedangkan skema yang kedua diadaptasikan dari metode Brunt-Vaisala Frequency (BVF). Adapun hasilnya, kedua buah skema mampu mensimulasikan suhu permukaan laut (SPL) secara realistis, akan tetapi, nilai root mean square error (RMSE) dari metode BVF lebih kecil dibandingkan dengan metode KPP. Nilai RMSE dari metode BVF pada angin musim barat laut dan tenggara masing-masing dapat diturunkan menjadi 5.1607E-01 0C dan 5.7639E-01 0C. Hasil validasi ini menunjukkan ketelitian dari metode BVF lebih baik dibandingkan dengan metode KPP.
Hasil model berdasarkan skema pencampuran vertikal dengan metode BVF menunjukkan bahwa, arah arus permukaan laut di Laut Jawa, Selat Karimata dan Selat Sunda sangat dipengaruhi oleh arah angin di permukaan laut. Arus permukaan laut berganti arah mengikuti arah angin musim. Sebaliknya, arah arus permukaan laut di Selat Makasar sepanjang tahun selalu menuju ke arah selatan dengan variasi transport mengikuti pergantian angin musim. Arus permukaan yang menuju ke selatan ini dikenal sebagai Indonesian Through Flow (ITF) dan arus ini terjadi karena perbedaan tekanan antara Samudera Pasific dengan Samudera India. Tanda-tanda dari kejadian El Nino pada tahun 2002 juga dapat dideteksi dari hasil model. Hal ini tertandai dengan semakin menguatnya arah arus permukaan laut ke arah timur di daerah ekuator dan ke arah selatan di Selat Makasar, sedangkan di daerah Selat Karimata arus semakin melemah.
Kata kunci: Regional Ocean Modeling System, pencampuran vertikal, suhu pemukaan laut, arus permukaan laut.
ABSTRACT
The Regional Ocean Modeling System (ROMS) was used to simulate the Indonesian Archipelago Sea current and temperature with two different vertical mixing schemes. One corresponds to the newly developed K-Profile Parameterization (KPP) scheme and the other is adapted from the stability frequency of Brunt-Vaisala Frequency mixing (BVF). It is found that, both of schemes produce reasonably realistic sea surface temperature (SST); however, the root mean square error (RMSE) values from the BVF vertical mixing were less than the KPP vertical mixing. The RMSE values from the BVF vertical mixing at northwest and southeast monsoons can be reduced down to 5.1607E-01 0C and 5.7639E-01 0C respectively. These validation results reveal that accuracy of the BVF vertical mixing is better than the KPP vertical mixing.
The model results based on the BVF vertical mixing scheme show that the direction of Java Sea, Karimata and Sunda Straits surface current are strongly affected by the zonal wind system. The direction of surface current was change following the monsoonal wind system. On the other hand, the Makasar Strait surface current tend to flow southward throughout the year with annual variations in transport are related dynamically to the monsoon winds. These southward surface currents are known as Indonesian Through Flow (ITF) and it is governed by strong pressure gradient from the Pacific to the Indian Oceans. The signals of El Nino 2002 event also can be detected by the model results. It recognized that the strong Equatorial Counter Current flows to eastward to the central part of the Pacific Ocean. The Makasar Strait surface current was stronger than usual but the Karimata Strait surface current was weaker during this period.
Key word: Regional Ocean Modeling System, vertical mixing, sea surface temperature, sea surface current.
INTRODUCTION
The Indonesian archipelago cover a wide area with more than 17,000 islands and 81,000 km of coastline, extending from longitude 95° E until 141° E and latitude 7° N until 12° S (Herbert et al., 2002), causing Indonesia have climate of wet tropical influenced by northwest and
southeast monsoon (Wikimedia Foundation, Inc, 2008). During northwest monsoon, November until May, wind blown from direction of northwest bringing a lot of aqueous vapor and rain in Indonesia area. While at southeast monsoon, June until October, wind blown from southeast brings a few aqueous vapors so that happened the dry season in Indonesia (Bayong, 2004).
Monsoon that happened in Indonesia also influence the characteristic of sea current in territorial water of Indonesia. Circumstance of wind circulation is mirrored by direction of current especially the current on the sea surface. At northwest monsoon, above territorial water of Indonesia blown wind from west easterly so that the sea current in territorial water of Indonesia in general emit a stream of from west easterly. While at southeast monsoon, the sea current in territorial water of Indonesia emit a stream of on the contrary direction.
From the point of physical oceanography, the Indonesian territorial water belongs to one of the most interesting area of the world ocean. On the global scale, the Indonesian Through Flow (ITF) play an important role for the global ocean circulation (Herbert et al., 2002). England and Huang (2005) explained that, the ITF has long been a focus of research for its impact on local, regional, and global ocean circulation. The ITF is an important pathway for the transfer of climate signals and their anomalies around the world’s oceans (Sprintall et al., 2004), but unfortunately, measuring the total transport of the ITF is difficult due to the complicated geometry in the region with many passages and because of the large variability of transport through various passages (Tong et al., 2002).
In its bearing with circulation pattern of sea current, a study of which deal with dynamics of territorial water is very important. On the other hand, related to the difficulties of direct measurement for a variety of reasons as explained before, this kind of study can be learned by using a model which is in the form of hydrodynamic equation. A hydrodynamic model is the basic component of all computational models of a current system. It can simulate a current field that acts as agent of movement of materials in internal waters of the ocean (Hendrawan, 2005). The hydrodynamic model is developed based on the conservation of momentum and mass, which then is solved numerically through various numerical methods. It calculates the current velocity and water elevation at each grid that divides the water body representing the model area (Sukresno, 2008).
Oceanic vertical mixing is well known that plays a prominent role in regulating the sea surface temperature (SST). Multilevel numerical models that are capable of simulating the dynamical response of the ocean usually parameterize mixing processes in a very crude manner because constant values are assigned to the mixing parameters. Considering to the studies of the ocean circulation in Indonesian Archipelago Sea, which is related to monsoon, ITF and ENSO simultaneously, hence interested to conduct this study using model of hydrodynamics in 3-Dimensional mode with two different vertical mixing schemes.
Based on the background, the aims of this research are 1) To investigate the impacts of different vertical mixing schemes on the simulation accuracy of SST in the Indonesian Archipelago Sea, using 3-Dimensional Ocean Model, and 2) To determine the ocean circulation condition in Indonesian Archipelago Sea, concerning with monsoon, ITF and ENSO, using 3-Dimensional Ocean Model.
RESEARCH METHODS
Research Location
This research was carried out in Indonesian Archipelago Sea and its surrounding within the rectangular region from 103° E to 129° E and 15° N to 11° S (Figure 1).
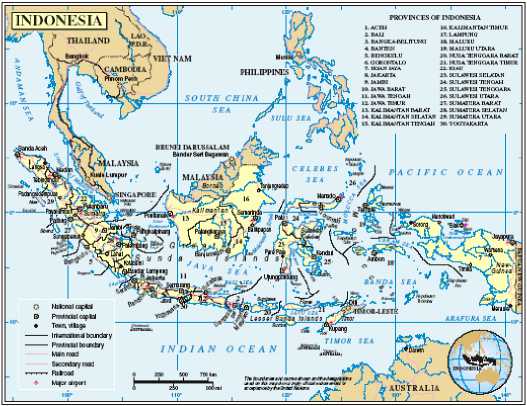
Figure 1. Research Location
The materials that used in this research are 1) The bathymetric map from the ETOPO-2, bathymetric map 2 minutes version, 2) Surface forcing data was derived from NCEP reanalysis I, 3) Initial and lateral forcing which contain data of SSH, salinity and temperature for the boundaries condition were obtained from SODA, and 4) In-situ data was obtained from WOA dataset that contains temperature profile for the Indonesian Archipelago Sea.
Data Analyses
In this research, the parameterization for turbulence closure was done by two kinds of methods, Brunt-Vaisala Frequency mixing (BVF), in which the level of mixing is determined based upon the stability frequency, and by the K-Profile Parameterization (KPP). According to Large et al. (1994), KPP provides an estimate of the vertical mixing with both local and non-local sources. The eddy-mixing coefficient K everywhere inside the ocean boundary layer (OBL) depends upon both the surface forcing and the depth of the layer as follows:
K (σ) = hw(σ G (σ)
where σ = d/h represents a dimensionless vertical coordinate, h is the OBL depth, d is the distance from the surface, w(σ) is a depth-dependent characteristic velocity called turbulent velocity scale and G(σ) is a nondimensional vertical shape function.
In contrast to the KPP parameterization for turbulence scheme, the BVF scheme considers to the stability frequency, N. The distribution of N is one of the most important dynamical characteristics of the ocean. The corresponding period 2π∕N varies usually from a few minutes in the thermocline to many hours in the deep oceans where the water is nearly neutrally stable (Phillips, 1969). The eddy-mixing coefficient K can be calculated as follow:
Model
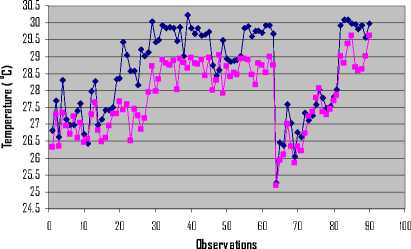
In-situ Dataset
Figure 2. SST Comparison between In-situ Dataset and Model Based on KPP Vertical Mixing
K = A
N2
with N = <
^^^^H
g2 c2
1/2
where ρ and ρ0 are mean and reference densities, g is the acceleration due to gravity, c is the sound speed.
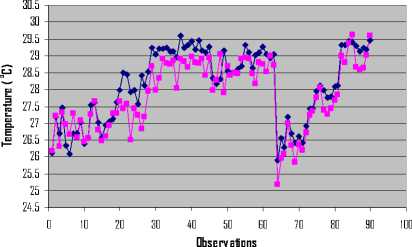
Figure 3. SST Comparison between In-situ Dataset and Model Based on BVF Vertical Mixing

RESULT AND DISCUSSION
According to Xianjin et al. (2000), it is well known that oceanic vertical mixing plays a prominent role in regulating the SST, a critical oceanic parameter in controlling the exchanges of energy and momentum between the ocean and atmosphere. The vertical mixing, because of the small-scale turbulent processes involved, usually cannot be explicitly resolved in the oceanic circulation models and has to be parameterized with turbulence closure (Xianjin et al., 2000; Haidvogel et al., 2008). Therefore, in order to reproduce accurate SST in the Indonesian Archipelago Sea, the ROMS vertical mixing is tuned by two kinds of vertical mixing, KPP and BVF vertical mixing. Although, the BVF vertical mixing is simpler than the KPP vertical mixing, but the comparison results shows that the BVF vertical mixing was better than the KPP vertical mixing in regulating the SST distribution surrounding the Indonesian Archipelago Sea.
Figure 2 and 3 respectively show the SST comparison between in-situ dataset and model based on the KPP and BVF vertical mixing during northwest monsoon.
The summary of validation results between the simulated and in-situ SST dataset during northwest monsoon is depicted in Table 1. The values indicate that, the BVF vertical mixing shows a better agreement with observation than the KPP vertical mixing, in term of higher CC and smaller RMSE.
Table 1. The Summary of CC and RMSE for Both Vertical Mixing in
Northwest Monsoon
|
Vertical Mixing Scheme |
CC |
RMSE (0C) |
|
KPP |
0.90 |
9.1639E-01 |
|
BVF |
0.925 |
5.1607E-01 |
CC = Correlation Coefficient RMSE = Root Mean Square Error
Figures 4 and 5 show the comparison result of numerical experiment for both vertical mixing at southeast monsoon. It is also found that, the RMSE value in Indonesian Archipelago Sea for numerical experiment with BVF vertical mixing can be reduced down to 5.7639E-01 0C (Table 6.1), which is less than the RMSE for numerical experiment with KPP vertical mixing.
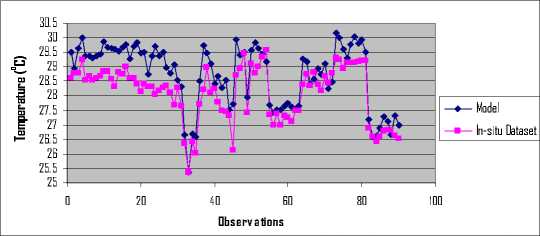
Figure 4. SST Comparison between In-situ Dataset and Model Based on KPP Vertical Mixing
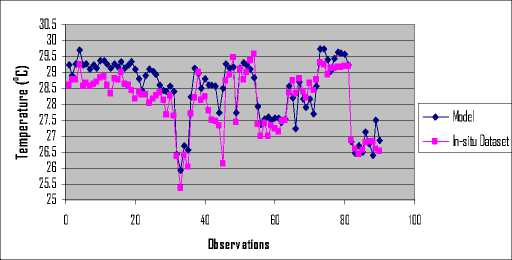
Figure 5. SST Comparison between In-situ Dataset and Model Based on BVF Vertical Mixing
The summary of validation results between the simulated and in-situ SST dataset during southeast monsoon is depicted in Table 2. The CC values indicate that, both of vertical mixing schemes can simulate the SST distribution of the Indonesian Archipelago Sea very well. On the other hand, the model performances in accuracy, the BVF vertical mixing scheme shows a better agreement with observation than the KPP vertical mixing, in term of smaller RMSE.
Table 2 The CC and RMSE Summary for Both Vertical Mixing in Southeast Monsoon
|
Vertical Mixing Scheme |
CC |
RMSE (0C) |
|
KPP |
0.9180 |
7.4884E-01 |
|
BVF |
0.8799 |
5.7639E-01 |
CC = Correlation Coefficient RMSE = Root Mean Square Error
In the tropics, the relationship between the SST gradient and winds, accounts for an important coupling mechanism. The dynamic atmospheric pattern in turn drives changes in surface water circulation, which alters the regional SST (Pages, 2008). In this study, the 0.25o resolution of SST in-situ dataset obtained from WOA is used to validate the model results. The distribution of SST is strongly influenced by the monsoonal wind direction. In northwest monsoon, northwesterly wind drives the surface current to the eastward and accumulates the warm water in the southeastern part of the Indonesian Archipelago Sea. Conversely, in southeast monsoon, southeasterly wind drives the surface current to the westward and accumulates the warm water in the northwestern part of the Indonesian Archipelago Sea. However, for the Makasar Strait region due to the ITF phenomena, the wind was not strongly influence the distribution of SST. These results suggest that, wind is an important factor in adjusting SST variation around the Indonesian Archipelago Sea, except for the Makasar Strait region.
The interchanging direction of current due to the influence of ocean topography and atmospheric forcing was found to take important role for determining the oceanographic conditions in the Indonesian Archipelago Sea. From the pattern of sea surface current based on BVF vertical
mixing scheme in normal year, the monsoonal wind during northwest monsoon drives the Java Sea surface current to eastward with maximum speed is close to 2 m/s and the Karimata Strait surface current to the south with maximum speed is close to 2.5 m/s. The Sunda Strait surface current is eastward and flows from the Indian Ocean to the Java Sea during this period with maximum speed is close to 0.2 m/s. Conversely, the wind direction is change to southeasterly during southeast monsoon. The monsoonal wind system drives the Java Sea surface current to westward with
maximum speed is close to 1 m/s and the Karimata Strait surface current northward with maximum speed is close to 2 m/s. The Sunda Strait surface current flows from the Java Sea
to the Indian Ocean during southeast monsoon with
maximum speed is close to 0.5 m/s.
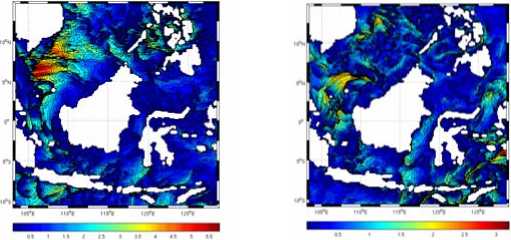
b. Southeast Monsoon 2000
a. Northwest Monsoon 2000
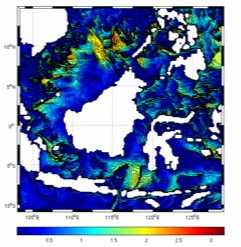
c. Northwest Monsoon 2002
Figure 6. Surface Current Speeds by Model (m/s)
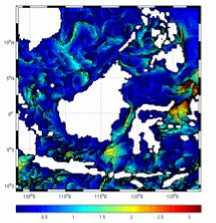
d. Southeast Monsoon 2002
Based on NCEP report during El Nino 2002, the warm water was occurred in the centre part of the Pacific Ocean. The SST in the central Pacific region was warmer than usual. It meant that the current inverse to the central Pacific Ocean and the seawater from the Indonesian Archipelago Sea would be flown to the Pacific area. These conditions also can be seemed from the speed of the current (Figure 6 (d)) along western part of the Indonesian Archipelago Sea (the Karimata Strait surface currents). The current speeds around those region were weaker than usual, its decrease until less than 1.5 m/s. Conversely, the Equatorial Counter Current speed around northeastern part of the Indonesian Archipelago Sea were became stronger, its flows to eastward to the central part of Pacific Ocean with maximum speed reach to 3 m/s (Figure 6 (d)).
The distributions of surface current flowing to the ITF path during ENSO 2002 also related dynamically to the monsoon winds. In January 2002, the surface current was flowing southward through the Makasar and Lombok Straits but the magnitude of surface current speed was weaker than the magnitude of surface current in August 2002 (Figures 6 (c) and (d)). The ITF became stronger flows southward through the Makasar and Lombok Straits during southeast monsoon 2002, these phenomena most influenced by the pressure gradient between Pacific Ocean and Indian Ocean. Few eddy happened in southern part of the Indonesian Archipelago Sea and eastern part of Java Sea, thus reducing the current resistance for the ITF currents to pass through those pathway.
CONCLUTIONS AND SUGGESTIONS Conclusions
-
1. The model results show that the BVF vertical mixing was better than the KPP vertical mixing in regulating the SST distribution surrounding the Indonesian Archipelago Sea. The smaller RMSE values indicate that the BVF vertical mixing shows a better agreement with observation than the KPP vertical mixing.
-
2. Based on the BVF vertical mixing, the Java Sea, the Karimata and Sunda Straits surface current are dominated by the monsoonal wind system. Consequent changes in wind patterns during northwest and southeast monsoon associated with changes in the surface current direction around those regions. On the other hand, the surface current along the Makasar Strait tend to flow southward throughout the year. These surface currents are known as ITF and it is governed by strong pressure gradient from the Pacific to the Indian Oceans. The signals of El Nino 2002 event can be detected by the model results. It recognized that the strong Equatorial Counter Current flows to eastward to the central part of the Pacific Ocean. The Makasar Strait surface current was stronger than usual but the Karimata Strait surface current was weaker during this period.
Suggestions
-
1. The result of this research need to be continued in the future, due to the complicated of atmospheric conditions, therefore the following research must be considered using coupled model between ocean and atmosphere.
-
2. To get better results in the oceanographic conditions for the regional application, need to increase the model resolution but must be careful with the computer resource.
-
3. Long term simulation, more than 10 years, need to be done to analyze the climate prediction concerning with monsoon, ITF and ENSO.
REFERENCES
Bayong, T.H.K. 2004. Klimatologi. Second Edition. Bandung: ITB.
England, M.H., and Huang, F. 2005. Notes and Correspondence On The Interannual Variability Of The Indonesian Throughflow And Its Linkage With Enso. J. Clim. 18. (online), [cited 2007 Jan 30] available from : URL : http://web.maths.unsw.edu.au/~ matthew/EH-2005.pdf.
Haidvogel, D.B., Arango H., Budgell W.P., Cornuelle B.D., Curchitser E., Di Lorenzo E., Fennel K., Geyer W.R., Hermann A.J., Lanerolle L., Levin J., McWilliams J.C., Miller A.J., Moore A.M., Powell T.M., Shchepetkin A.F., Sherwood C.R., Signell R.P., Warner J.C., and Wilkin J. 2008. Ocean Forecasting in Terrain-Following Coordinates: Formulation and Skill Assessment of the Regional Ocean Modeling System. J. Computational Physics. 227: 3595–3624.
Hendrawan, I. Gede. 2005. Barotropic model to calculate water circulation in benoa bay bali (Thesis). Denpasar: Master Program of Environmental Science, Postgraduate Program Udayana University.
Herbert S., Hendiarti, N., Ohde, T., and Monica, G. 2002. Application of Remote Sensing Data in Indonesian Waters. Proc. of the 6th Pan Ocean Remote Sensing Conference: 675-680.
Large, W.G., McWilliams, J.C., and Doney, S.C. 1994. Oceanic Vertical Mixing: A Review and A Model with A Nonlocal Boundary Layer Parameterization. Rev. of Geophysics Res. 32 (4): 363-403.
Pages. 2008. Australasian Monsoon. (online) [cited 2008 May 22] available from : URL : http://www.pages-igbp.org/about/national/indonesia/am.html.
Phillips, O.M. 1969. The Dynamic of the Upper Ocean. London: Cambridge University Press.
Sprintall, J., Susan, W., Gordon, A.L., Amy, F.R., Molcard, R., Susanto, D., Indroyono, S., Sopaheluwakan, J., Yusuf, S., and van Aken, H.M. 2004. INSTANT: A New International Array to Measure the Indonesian Throughflow. Eos 85 No.39: 369-376.
Sukresno, B. 2008. Dynamical Analysis of Banda Sea Concerning with El Nino, Indonesian Through Flow and Monsoon by using Satellite Data and Numerical Model (Thesis). Denpasar: Master Program of Environmental Science, Postgraduate Program Udayana University.
Tong L., Ichiro, Fukumori, Dimitris, M., Zhangfan X., and Lee L.F. 2002. Effects of the Indonesian Throughflow on the Pacific and Indian Oceans. J. Phys. Oceanogr. 23: 1404-1429.
Wikimedia Foundation, Inc. 2008. Monsoon. (online) [cited 2008 Jun. 24, at 22:59] available from URL: http://en.wikipedia.org/wiki/Monsoon.
Xianjin Li, Yi Chaol, McWilliams, J.C., and Lee-Lueng Ful. 2000. A Comparison of Two Vertical Mixing Schemes in a Pacific Ocean General Circulation Model. J. Climate. 2000.
96
Discussion and feedback