STUDY ON VARIABILITY MECHANISM DURING 1997/1998 ENSO IN EASTERN PART OF INDONESIA ARCHIPELAGO USING SATELLITE DATA AND IN-SITU DATA
on
ISSN 1907-5626
Study on Variability Mechanism During 1997/1998 Enso in Eastern Part of Indonesia Archipelago
Using Satellite Data And In-Situ Data
STUDY ON VARIABILITY MECHANISM DURING 1997/1998 ENSO IN EASTERN PART OF INDONESIA ARCHIPELAGO USING SATELLITE DATA AND IN-SITU DATA
Luh Made Chandra Astiti R.1, Takahiro Osawa2, I Wayan Redi Aryanta1
-
1 Master Program of Environmental Study, Post Graduate Program, Udayana University 2Center of Remote Sensing and Ocean Science (CReSOS), Udayana University
ABSTRACT
El Nino-Southern Oscillation (ENSO) is one of the most important climate anomalies humans is concerned about. It brought many changes in physical of the ocean. The seas of the Indonesian Archipelago are an artery carrying tropical thermocline water from the Pacific to the Indian Ocean. Termed the 'Indonesian Throughflow' (ITF), this transport is driven by the Pacific/Indian interocean pressure gradient. The variability of SST in Equatorial Zone during 1997/1998 ENSO analyzed by using L1 AVHRR satellite images from NOAA and in-situ data from TAO/Triton buoy. This study was done in Eastern Part of Indonesian Archipelago (110oE – 130oE and 4oS – 11oS). This research begun by collecting data in long term, 1993, 1997, 1998 such as: in-situ data and satellite image. L1 AVHRR satellite images from NOAA to get SST data were used. From TAO/Triton buoy, SST and current data were got. SSH data available from L3 TOPEX/Poseidon. SLP and salinity data were got from NOAA-CIRES Climate Diagnostics Center. All the data analyzed by SOI value to recognize the normal, El Niño, and La Niña conditions. The SOI value was used in this study available from existing research data.
Generally, the SST in northern Lesser Sunda (Bali, Lombok, Sumbawa and Flores) was 0.5 – 1oC higher than southern part. During El-Nino event on October 1997, the 1 – 2oC cooler SST causes the surface pressure get higher around Indonesian seas. This phenomenon probably is much influenced by the change of season in Indonesia, from hot season to the rain season. But during El-Nino 1997 the 1 – 4oC warmer water was occurred in centre part of Pacific Ocean, hence the sea water from Indonesia Sea flown to the Pacific Ocean. During El Nino conditions, on December 1997, the SSH in southern Indonesia Archipelago was about 10 – 40 cm lower than normal conditions and became 10 – 30 cm lower than Indonesian seas. This could be due to the SST in Indonesian seas was higher than southern Indonesian Archipelago causes lower surface pressure in Indonesian seas. During La Nina conditions, on November 1998, the SSH in southern Indonesia Archipelago was about 5 – 35 cm higher than normal conditions and became higher than Indonesian seas. This could be due to the SST in Indonesian seas was lower than southern Indonesian Archipelago causes higher surface pressure in Indonesian seas. Water mass would be flowing from Indonesia seas to southern Indonesia Archipelago. Generally, during 1997 to 1998 the current in Java Sea became 1 – 3 m/s stronger than normal conditions. During El-Nino 1997/1998 the sea surface temperature in central Pacific region was warmer than usually, this could be mean the current inverse to the central pacific from Indonesia seas. Generally, during 1997 to 1998 the current was flows southward through Makassar Strait, continue to Lombok Strait and go to Indian Ocean. The current in Makassar Strait was flows about 1 – 4 m/s and about 1 – 2 m/s in Lombok Strait. On June 1997 the current was flows northward through Lombok Strait about 1 – 2 m/s.
Key words: current, El-Nino, La-Nina, SSH, SST
ABSTRAK
El Nino-Southern Oscillation (ENSO) adalah salah satu keganjilan iklim yang paling utama yang menjadi perhatian manusia. Hal ini membawa banyak perubahan terhadap kondisi fisik lautan. Perairan di Kepulauan Indonesia merupakan jalur yang membawa air termoklin tropis dari Samudra Pasifik dan Samudra Hindia. Diistilahkan sebagai Indonesia Throughflow (ITF), transport ini digerakkan oleh gradien tekanan antar samudra. Perubahan SST di Zona Ekuator selama ENSO 1997/1998 diteliti menggunakan citra satelit L1 AVHRR dari NOAA dan data lapangan dari TAO/Triton buoy. Studi ini dilakukan di Bagian Timur Kepulauan Indonesia (110oE – 130oE dan 4oS – 11oS). Penelitian ini dimulai dengan pengumpulan data jangka panjang, 1993, 1997, 1998 berupa: data lapangan dan citra satelit. Citra satelit L1 AVHRR dari NOAA digunakan untuk mendapatkan data SST. Dari TAO/Triton buoy, diperoleh data SST dan arus. Data SSH tersedia dari L3 TOPEX/Poseidon. Data SLP dan kadar garam diperoleh dari NOAA-CIRES Climate Diagnostics Center. Semua data dianalisis dengan nilai SOI untuk mengetahui kondisi normal, El Nino dan La Nina. Nilai SOI yang digunakan dalam studi ini tersedia dari data penelitian yang telah ada.
Umumnya, SST di Timur Sunda Kecil (Bali, Lombok, Sumbawa dan Flores) lebih tinggi 0.5 - 1oC dibandingkan bagian Selatan. Selama peristiwa El Nino bulan October 1997, SST yang lebih dingin 1 – 2oC menyebabkan tekanan permukaan menjadi lebih tinggi di sekitar perairan Indonesia. Fenomena ini dapat disebabkan karena dipengaruhi oleh perubahan musim di Indonesia, dari musim panas ke musim hujan. Tetapi selama El Nino 1997 air yang lebih hangat 1 – 4oC terjadi di bagian tengah Samudra Pasifik, sehingga air laut dari perairan Indonesia mengalir ke Samudra Pasifik. Selama kondisi El Nino, bulan Desember 1997, SSH di Bagian Selatan Kepulauan Indonesia lebih rendah 10 – 40 cm dibandingkan kondisi normal dan menjadi 10 – 30 cm lebih rendah dibandingkan di perairan Indonesia. Hal ini dapat disebabkan karena SST di perairan Indonesia lebih tinggi dibandingkan sebelah Selatan Kepulauan Indonesia menyebabkan tekanan permukaan di perairan Indonesia lebih rendah. Selama kondisi La Nina, bulan November 1998, SSH di sebelah Selatan Kepulauan Indonesia lebih tinggi 5 – 35 cm dibandingkan kondisi normal dan menjadi lebih tinggi dibandingkan di perairan Indonesia. Hal ini dapat disebabkan karena SST di perairan Indonesia lebih rendah dibandingkan di sebelah Selatan Kepulauan Indonesia menyebabkan tekanan permukaan di perairan Indonesia lebih tinggi. Massa air akan mengalir dari perairan Indonesia ke sebelah Selatan Kepulauan Indonesia. Umumnya, selama 1997 – 1998 arus di Laut Jawa menjadi lebih kuat 1 – 3 m/s dibandingkan kondisi normal. Selama El Nino 1997/1998 SST di tengah wilayah Pasifik menjadi lebih hangat dari biasanya, hal ini dapat dikatakan arus berbalik ke tengah Pasifik dari perairan Indonesia. Umumnya, selama 1997 – 1998 arus mengalir ke arah Selatan melewati Selat Makasar, melewati Selat Lombok dan menuju Samudra Hindia. Arus di Selat Makasar mengalir sekitar 1 – 4 m/s dan sekitar 1 – 2 m/s di Selat Lombok. Bulan Juni 1997 arus mengalir ke arah Timur melalui Selat Lombok sekitar 1 – 2 m/s.
Kata kunci: arus, El-Nino, La-Nina, SSH, SST
INTRODUCTION
El Nino-Southern Oscillation (ENSO) is one of the most important climate anomalies humans are concerned about. Research on ENSO has become a significant part in certain fields of
science such as climatology, oceanography, ecology. ENSO does not only cause disastrous climate to the areas in the vicinity of equatorial Pacific, e.g. Indonesia, Peru and Ecuador, but also causes climate anomalies to a number of regions far away (Trenberth, 1996). Unfortunately, our understanding
of ENSO is still far from sufficient. The cause of ENSO phenomena is still not clear, making it difficult to predict ENSO events before over one year. Similarly, why ENSO events disappear is also unclear. The best known fact is that they come and go with cyclicity of 2-7 years. Ironically, the reasons for this cyclicity remain largely unknown. Moreover, the mechanisms behind ENSO events are not clear yet, what we already know is that ENSO events may not be climate anomalies, but a reflection of an inherently unstable tropical ocean and atmosphere system (Trenberth, 1996).
The 1997-1998 El-Nino was the most destructive ENSO on record. When the condition finally receded, it had disrupted global weather patterns, killed an estimated 2,100 peoples and resulted in property damages of ₤20 billion. However, damages would have been far worse had it not been predicted.
There is considerable and growing interest in the progress that has been made since the earliest decades of this century with regard to research and understanding of El Niño-Southern Oscillation events, popularly referred to as El Niño. Research in this area began at the turn of the twentieth century with Sir Gilbert Walker's research on the Southern Oscillation, a seesaw of pressure systems across the equatorial Pacific Ocean, centered on Darwin (Australia) and Tahiti. He also identified,
through a variety of statistical measures, linkages over relatively large distances, called teleconnections, between seemingly unrelated climate anomalies.
The Indonesian Archipelago is unique in that it represents the only low latitude interocean connection on the planet. The seas of the Indonesian Archipelago are an artery carrying tropical thermocline water from the Pacific to the Indian Ocean. Termed the 'Indonesian Throughflow' (ITF), this transport is driven by the Pacific/Indian interocean pressure gradient. The oceanography of the region both influences and is driven by larger scale climate variability and that changes in Sea Surface Temperature (SST), Sea Surface High (SSH), and ocean current in the Indonesian region may be an important, and overlooked, component in the ENSO instability mechanism.
RESEARCH METHOD
This study was done in eastern part of Indonesian Archipelago (110oE – 130oW and 4oS – 11oS). This research begun by collecting data in long term, 1993, 1997, 1998 such as: in-situ data and satellite image. L1 AVHRR satellite images from NOAA to get SST data were used. From TAO/Triton buoy, SST and current data were got. SSH data available from L3 TOPEX/Poseidon. SLP and salinity data were got from NOAA-CIRES Climate Diagnostics Center. All the data analyzed by SOI value to recognize the
normal, El Niño, and La Niña conditions. The SOI value was used in this study available from existing research data. Large negative value represent El Niño event, and large positive value represent La Niña event. These three conditions were compared in order to know the variability of physical parameters in Equatorial region and Indonesian archipelago.
L1 AVHRR satellite images from NOAA were available from National Institute of Aeronautics and Space (Lembaga Penerbangan dan Antariksa Nasional/ LAPAN). L3 TOPEX/Poseidon satellite images were available from the Near Real-Time Altimeter Website hosted by the Colorado Center for Astrodynamics Research (CCAR) at the University of Colorado, Boulder. L3 TAO/Triton buoy data was available from TAO/TRITON data display website hosted by TAO Project Office at Pacific Marine Environmental Laboratory, Seattle. L3 SLP and salinity data was available from NOAA-CIRES Climate Diagnostics Center maintained by Data Magement Group at the Earth System Research Laboratory (ESRL).
RESULT AND DISCUSSIONS Variability in Eastern Part of Indonesia Archipelago during 1997/1998 ENSO
The eastern Indonesia archipelago is important place correspond to Indonesia Through
Flow (ITF), where the current flowing from the Pacific Ocean through the eastern Indonesian sea (trough the Makassar Strait and flowing to the Lombok Strait and the Banda Sea to the Timor).
The monthly distributions of SST in eastern part of Indonesia Archipelago during 1997 to 1998 are shown in Figure 1. Generally, the SST in northern Lesser Sunda (Bali, Lombok, Sumbawa and Flores) was 0.5 – 1oC higher than southern part. The SST on June 1997 around 28oC to 29oC was warmer than October 1997 (26oC to 27oC), but from November 1997 to March 1998 the SST is almost the same (28oC to 29oC). On October 1997 and October 1998, the SST was 1 – 2oC cooler than another month. On
May and June 1998 the water became warmer, reach 30oC.
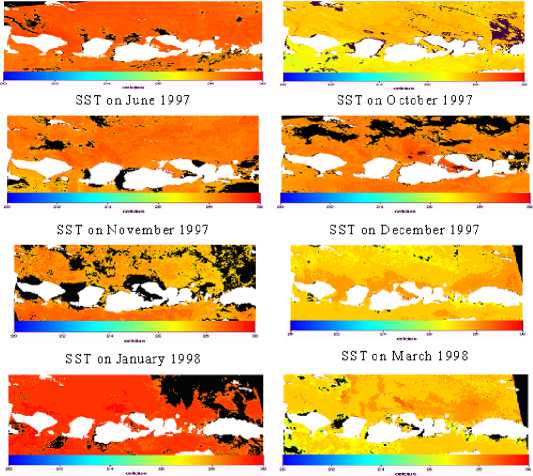
SST on June 1998 SST on O ctober 1 998
Figure 1. The monthly of SST in Eastern Part of Indonesia Archipelago
During El-Nino event on October 1997, the 1 – 2oC cooler SST causes the surface pressure get higher around Indonesian seas. This phenomenon probably is much influenced by the change of season in Indonesia, from hot season to the rain season. But during El-Nino 1997 the 1 – 4oC warmer water was occurred in centre part of Pacific Ocean, hence the sea water from Indonesia Sea flown to the Pacific Ocean.
In Pacific Ocean, El Nino events are characterized by 4 – 6oC warmer than usual surface water along the equator in the eastern Pacific Ocean and weaker than usual trade winds in the equatorial Pacific. During El Nino conditions, warmer SSTs spread further east, producing the warmer ocean surface temperatures in equatorial Pacific Ocean. This coincides with a weakening of the Walker circulation and may cause a lower rainfall over the western Pacific and excessive rain on parts of Peru and Ecuador (Reid, 2000).
It seems from the observations that variations in the atmospheric pressure gradient are first followed by changes in sea-surface wind stress, and later by changes in temperature (Madl, 2000). Winds in the lower atmosphere are the link between the pressure change associated with the Southern Oscillation and the extensive ocean warming associated with El Nino. Once an ENSO event has started, the reversal of pressure
gradients causes the surface trade winds and equatorial currents to change direction. Warmer water flowing from west to east causes local sea level rise and prevents upwelling along the west coast of North and South America. ENSO events not only destabilize the flow of energy along the equator but also the flow of energy from the tropics to the poles, thus altering global weather patterns.
Philander (1990), along the equator, the trade winds blow warm surface water westward in the direction of Asia, where it piles up. In the east, near South America, the water is replaced with cold water from below. This causes a temperature difference between the west (Australia and Asia) and the east (the Americas) of the Pacific. Air rises more over warm water than over cold water. Where air rises and cools as it enters higher altitudes, the water vapor in the air condenses and it rains: that is why it rains much more over the warm western Pacific near Asia than over the cold eastern Pacific near Peru and Ecuador. Also, the rising air in the west draws in more air, and this is partly responsible for the strength of the trade winds.
La Nina events are associated with 1 – 2oC cooler SSTs extending further west and warmer temperatures contracting to the west. These events were characterized by stronger surface trade winds over the central Pacific, and about 1 – 4oC cooler SSTs in the eastern equatorial Pacific. Over Indonesia Archipelago, the SST became higher for about 1oC.
Such a weather pattern is associated with increased cyclone activity in the western Pacific, off shore of eastern Australia, the Phillipines, and the western Atlantic region (Madl, 2000).
According to the in-situ data, during El Nino events, the SST became about 2 – 4oC warmer than normal conditions in eastern equatorial Pacific Ocean. The trade winds in northern Equatorial Pacific Ocean changing directions. In normal conditions, the winds were flowing to northwest direction in eastern Pacific Ocean, but during El Nino events the winds were flowing to southeast direction. This could be due to the pressure in equatorial become lower during El Nino events. The warmer SST could be causes a lower pressure. During La Nina events, the cooler water spread more westward in Equatorial Pacific Ocean. In normal conditions, the winds were flowing to northwest direction in Equatorial Pacific Ocean, but during La Nina events the winds became stronger. This could be due to the pressure in eastern equatorial Pacific Ocean become higher during La Nina events.
On the other hand, according to the distributions of SST at Lombok Strait, the water was cooler reach 26oC on October 1997 and got higher reach 30oC on June 1998. The SST generally warmer in centre part of Lombok Strait, this probably influence by Indian Ocean Kelvin Wave (IOKWs) According to Fadly (2005),
IOKWs produce strong northward current. The northward velocity is associated with 4 – 5 m interfacial deformation height across the Lombok Strait (maximum of 11.3 m).
On January 1997, SSH was 25 – 50 cm higher in southern Indonesian Archipelago than northern part of Lesser Sunda Island. Generally, during June 1997 to March 1998, SSH in southern Indonesia Archipelago became 10 – 40 cm lower than normal conditions and 10 – 30 cm lower than Java Sea. The opposite condition was happen on June 1998. During June to December 1998 the SSH in southern
Indonesian Archipelago became 20 – 35 cm higher than normal conditions. The difference between
normal and El Nino conditions are shown in Figure 2.
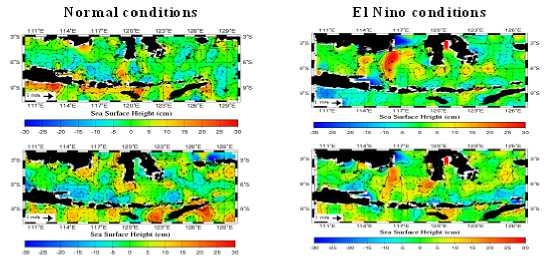
Figure 2. SSH and current in eastern part of Indonesia Archipelago on December 1997 and January 1998
During El Nino conditions, on December 1997, the SSH in southern Indonesia Archipelago was about 10 – 40 cm lower than normal conditions and became 10 – 30 cm lower than Indonesian seas. This could be due to the SST in Indonesian seas was higher than southern Indonesian Archipelago causes lower surface pressure in Indonesian seas. Water
mass was flowing from higher to lower surface pressure. This could be mean that water mass would be flowing from southern Indonesia Archipelago to Indonesia seas.
Normally, the SLP are higher in the east than west of Pacific Ocean. During El Nino events, the SLP was about 3 mb lower in east equatorial Pacific Ocean than west side and about 3 mb lower than long term conditions. The SLP has correlation with SST when comparing those two variables. During October to November 1997, the SST was warmer in eastern equatorial Pacific Ocean while the SLP became lower in there. This could be means that when SST became warmer, the SLP became lower.
In Pacific Ocean, other notable anomalies during El Nino events are changes in sea surface heights, with higher than average heights experienced to the east of the Pacific. Convective cloud, usually situated over the western Pacific shifts to the east and centres itself in the middle of the Pacific Ocean. It should be noted that while ENSO conditions provide the basis for such impacts other factors can also cause equally opposite reactions (Reid, 2000).
The difference between normal and La Nina conditions are shown in Figure 3.
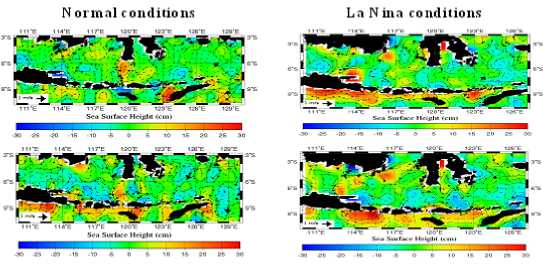
Noi mal conditions
Figure 3. SSH and current in eastern part of Indonesia Archipelago on November and December 1998
During La Nina conditions, on November 1998, the SSH in southern Indonesia Archipelago was about 5 – 35 cm higher than normal conditions and became higher than Indonesian seas. This could be due to the SST in Indonesian seas was lower than southern
Indonesian Archipelago causes higher surface pressure in Indonesian seas. Water mass would be flowing from Indonesia seas to southern Indonesia Archipelago.
During La Nina events, the SLP was about 5 mb higher in east equatorial Pacific Ocean than than west side and about 2 mb higher long term conditions. During October to December 1998, the SST was cooler in eastern equatorial Pacific Ocean while the SLP became higher in there.
La Nina events was characterized by strengthening of the Walker circulation in Pacific Ocean causes an increase in precipitation, particularly over Indonesia, and abnormally high sea surface heights over the western Pacific. Generally drier conditions are experienced over Peru and Ecuador.
On beginning on January 1997 the current was flows from Indonesia seas to the Indian Ocean pass through Lombok Strait, but on June 1997 has been the opposite direction. During November 1997 to November 1998 the current temporary flow from Indonesia seas to the Indian Ocean but some time flow from Indian Ocean to the Indonesia seas. Generally, during 1997 to 1998 the current in Java Sea became 1 – 3 m/s stronger than normal conditions.
During El-Nino 1997/1998 the sea surface temperature in central Pacific region was warmer than usually, this could be mean the current inverse to the central pacific from Indonesia seas. On January 1997, the ITF was flows southward through Makassar and Lombok Strait. On June 1997, the ITF became weak, the surface current was flows northward into Lombok Strait. ITF was flows through Makassar Strait causes eddy in Java Sea. Both Kelvin and Rosby waves are slow and weak waves, but together with the positive feedback from atmosphere system, they could become the pacemaker of ENSO events and result in the apparent cyclicity (Peng, 2000). From October 1997 to February 1998 the ITF became stronger flows southward through Makassar and Lombok Strait. On October – November 1997, strong current flow at southern Kalimantan Island southward to east Java. On December 1997, strong current flow southward through Lombok Strait,
SSH in east Java Sea got higher. During January 1998 to February 1998 the current became weak, SSH higher in southern Kalimantan and Sulawesi Island. At Java Sea, the current became strong on March 1998 to December 1998 southward to Lombok Strait. Some eddies happened in southern sea of Indonesia and around Java Sea.
According to Peng (2000), to terminate an ENSO sequence, Rosby and Kelvin waves may also be needed. During an ENSO event, the warm water flowing eastwards will eventually hit the eastern coast of Pacific and be reflected westwards along the equator, bringing some of the warm water back westward and possibly bring to an end to the previous ENSO event. Both Kelvin and Rosby waves are slow and weak waves, but together with the positive feedback from atmosphere system, they could become the pacemaker of ENSO events and result in the apparent cyclicity.
The horse latitudes of the Pacific Ocean are characterized by high air-pressure systems and low rainfall. The equatorial region of the Indian Ocean is characterized by low air pressure and abundant rainfall. The existing high pressure system in the eastern Pacific forces trade winds to blow toward the moist, low-pressure system residing over Indonesia. These westward trade winds maintain the ocean surface-currents moving towards Indonesia and cause water to pile up in the western Pacific, causing the sea
level in Southeast Asia to rise higher than along the west coast of South America.
During normal conditions in Pacific Ocean, the system is in equilibrium as long as the trade winds maintain their strength and direction. Water is transported westwards as wind driven surface currents, eastwards within deeper layers as subsurface currents driven by the pressure gradient force. This circulation feeds the upwelling zones with cold, nutrient rich water, and controls the position of the thermocline; shallow on the eastern side of the basin and deep on the western side, so that it tilts in the opposite direction of the sea surface.
According to in-situ data, during September to October 1997 the surface current in western Pacific Ocean was flown eastward different with normal conditions. The surface current became stronger spread westward in eastern Pacific Ocean.
The ITF During 1997/1998 ENSO
Generally, during 1997 to 1998 the current was flows southward through Makassar Strait, continue to Lombok Strait and go to Indian Ocean. The current in Makassar Strait was flows about 1 – 4 m/s and about 1 – 2 m/s in Lombok Strait. On June 1997 the current was flows northward through Lombok Strait about 1 – 2 m/s.
The ITF is governed by strong pressure gradient from the pacific to the Indian Ocean. The annual and semi annual variations in transport are related dynamically to the monsoon winds. The annual signals have a maximum during the south west monsoon in July and August and minimum in January and February. This is because winds are blowing westward during the south west monsoon in the southern tropical Indian ocean and causes a lowering of sea level on the eastern side (and increase on the western side). Reversely during the north east monsoon, winds reverses in the tropical Indian Ocean, leading to an increase of sea level on its eastern side, thus minimizing the annual variations (Anonim, 2006).
During the rain months (North West Monsoon/NWM), from November through March, winds from the Northwest cause a mass of lower salinity surface water from the shallow South China and Java Seas to move south-east (South East Monsoon/SEM) into the path of the ITF. As rain comes to an end, the prevailing winds change direction and the process is reversed. From May to September, winds blowing to the North and West push the low-salinity water back into the Java and South China Seas, removing the surface-level obstruction from the path of the ITF (Gordon et. al, 2004).
Changes in the ITF current have an influence on the weather for the entire region. As warm water
flows from the Pacific to the Indian Ocean, the resulting rise in temperature causes increased rainfall along coastal area, due to evaporation. When this precipitation runs off into coastal waters, there is an increase in freshwater in South China and Java Seas. The additional freshwater then travels into the path of the ITF, resulting in a cooler current and less heat transferred to the Indian Ocean. This in turn leads to reduced rainfall in coastal areas, and reduced freshwater levels in the path of the ITF, resetting the system to its original state. This system of negative feedback establishes a stable cycle of alternating temperatures in the ITF, and corresponding rhythms in surrounding rainfall levels (Gordon et. al, 2004).
These images are not good enough to explain the influences of ENSO to the Indonesia Archipelago. It need more study on other parameters to find information that can give explanations more clearly.
CONCLUTIONS
-
1. Generally, the SST in northern Lesser Sunda (Bali, Lombok, Sumbawa and Flores) was 0.5 – 1oC higher than southern part. During El-Nino event on October 1997, the 1 – 2oC cooler SST causes the surface pressure get higher around Indonesian seas.
2.
During El Nino events, the SSH in southern Indonesia Archipelago became 10 – 30 cm lower than Indonesian seas. During La Nina conditions, on November 1998, the SSH in southern Indonesia Archipelago was about 5 – 35 cm higher than normal conditions.
-
3. Generally, during 1997 to 1998 the current in Java Sea became 1 – 3 m/s stronger than normal conditions.
-
4. Generally, during 1997 to 1998 the current was flows southward through Makassar Strait, continue to Lombok Strait and go to Indian Ocean. The current in Makassar Strait was flows about 1 – 4 m/s and about 1 – 2 m/s in Lombok Strait. On June 1997 the current was flows northward through Lombok Strait about 1 – 2 m/s.
REFERENCES
Anonim. 2006. The Indonesian Throughflow.
Available from : http://
wwwoa.ees.hokudai.ac.jp/people/vinu/ Indonesian.html.
Gordon, A.L., Susanto, R.D., Vranes, K. 2004. Indonesian Throughflow (ITF). New York. Available from:
http://www.earthinstitute.columbia.edu/flash/ itf2004.html.
Madl, P. 2000. The El-Nino (ENSO) Phenomenon. Environmental Physics/Lettner 437-503. Available from:
http://www.sbg.ac.at/ipk/avstudio/pierofun/ atmo/elnino.htm.
Peng, J. 2000. Historical El Nino-Southern Oscillation (ENSO) Events Reconstructed from Coral Records in Equatorial Pacific Ocean. Available from:
http://earth.usc.edu/~jianpeng/enso.htm.
Philander, S.G.H. 1990. El Niño, La Niña and the Southern Oscillation. San Diego:
Academic Press.
Reid, P. 2000. SOI/ENSO and their influence. CRU Information Sheet no. 12. Available from: http://www.cru.uea.ac.uk/cru/info/enso/SOI/E NSO and their influence.htm.
Trenberth, K.E. 1996. El-Nino-Southern Oscillation, in: Climate Change: Developing Southern Hemisphere Perspectives. Washington: John Wiley & Sons.
ECOTROPHIC | VOLUME 1 NO. 2 NOVEMBER 2006
10
Discussion and feedback