SEA SURFACE TEMPERATURE RELATED TO THE BIG EYE TUNA EXISTANCE IN INDIAN OCEAN ON 2010
on
ECOTROPHIC • 7 ('.!): I 31 · I >-l
ISSN: 1907-5626
SEA SURFACE TEMPERATURE RELATED TO THE BIG EYE TUNA EXISTANCE IN INDIAN OCEAN ON 2010
Martbvi Diah Setiawati 1)2) 1 FusanoriMiura z), TasukuTanaka^
1) (;ruJuat!' Study o{ J-:nl'ironmu1tul Science, { duyunu { 'niversity
:!) < ·enter.fiir Remote Se11.,i114 unJ <kTU' Sciences (C/frSOS), l 'duyunu l '11iversity
:J) Gruduuu· School ^(Science um/ J,ngineering, ramaguch1 University
titL'ixs_cule^, yuhoo.rn.id
ABSTRAK
Samudra Hindia, khususnya di sebelah selatan .Jawa dan Bali telah diidentifikasi sebagai lokasi penangkapan ikan untuk beberapa ikan pelagis besar. Tuna mata besar merupakan spesies dengan nilai ekonomi tertinggi di Samudra Hindia dibandingkan dengan spesies lainnya. Terdapat beberapa penelitian yang mempelajari hubungan antara keberadaan tuna dan faktor-faktor lingkungannya. SPL digunakan sebagai parameter oseanogarfi utama untuk dihubungkan dengan keberadaan ikan tuna mata besar. Data SPL diperoleh dad AQL1A MOOIS le·el 3. Dalam penelitian ini, diguunakan metode statistik sederhana untuk membuktikan bahwa SPL dan big eye tuna memiliki korelasi :-,ang tinggi.
Regressi polynomial dan system informasi geografis digunakan untuk meningkatkan nilai korelasi dari data yang ada. Terdapat tiga titik kritis dan empat persamaan. Berdasarkan hasil analisis, SPL signifikan dan berkorelasi tinggi terhadap kelimpahan tuna mata besar di Samudra Hindia.
Kata k1mci: T!ma mata besar, SPL. Sa11111clra Hinclia
ABSTRACT
Indian Ocean, particularly on Southern part of ,Java and Bali was identified for some big pelagic fish. Among all of th<' big pelagic fishes, big eye tuna is the highest commercial value compare with other species There are several research which studied the relationship between the existence of tuna and environmental factor. Sea Smface Temperature (SST) was used as a main oceanographic factor to relate with big eye tuna abundance. SST data \\as derived from Level 3 AQUA MODIS data. In my paper, 1 use additional simple statistical method to prove that SST and big eye tuna has a good con-elation.
I used polynomial regression and geographic information system method to improve correlation value of lhe data. There arc three critical value and four equation. BasE>ci on thP data analysis, SST has significant value to big eye tuna abundance in Indian Ocean and has high correlation.
Key ward ; biy eye tuna, SST. Indian Ocean
INfRODUCTION
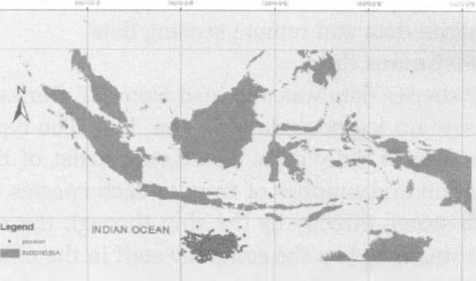
Indian Ocean particularly in the southern prut of .Java and Bali was identified for some big pelagic fish. Big eye tuna, yellow fin tuna, albacore tuna, blue fin tuna, shark, marlin and sword fish was found on there. Big eye tuna is the highest commercial value compare with other species. Fishing activity was done by using long line method. This method is commonly used because it is good for fish expo,t quality. Figure 1 showed fish distribution around Indian Ocean and Flores Sea.
There are several research were studied about the relationship between oceanographic parameter and tuna abundance. In the fisheries remote sensing, Sea
TUNA CATCHMENT POSITION 2010
.,._It,..

Figure 1. Fishing position for some big pelagic fish on 2010 around Indian Ocean(PT Perikanan Nusantara).
Surface Temperature (SST), Sea smface Chlorophyll (SSC), Sea smface Wind Speed (SSW), geostrophic current, Eddy kinetic energy, Sea Surface Height
(SSH) and primary productivity (Schick et.al ,2004, Zagaglia et.al, 2004; Zainuddin et.al , 2008; Arief et.al , 2011; Mugo et.al, 2010; Andreade et.al, 2010) were usually estimated by the researcher. In this paper, we present a study on the relationship between SST and big eye tuna abundance. There are several researches which study about the relationship between SST and big eye tuna abundance in Indian Ocean, but most of them didn't get a good correlation or determination value of it. Theoretically fishes depend on the temperature condition for normally metabolism process. In my paper, I use additional simple statistical method to prove that SST and big eye tuna has a good correlation.
METHOD
-
2.1 Research Location
The research location was located between 10°S-18°S and 110 °E - u8°E in the Indian Ocean. It was chosen based on the availability of big eye tuna data.
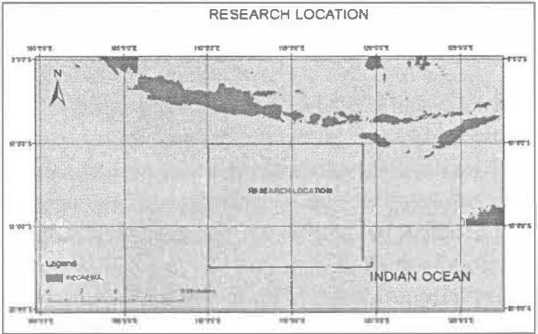
Figure 2. Research Location
-
2.2 Research Data
In this paper there are two types of data sets; fisheries data and remote sensing data.
Fisheries data
Fisheries data was obtained from PT. Perikanan Nusantara log book data, Benoa, Bali. The type of this data is daily data. The data consist of time, location and number of tuna in each species. The data stored directly by the ship through the radio and was noted by the company staff in the office.
Remote sensing data
Monthly remotely sensed oceanographic data, specifically, sea surface temperature (SST) was used. The data was derived from level 3 ocean color data of Moderate Resolution Imaging Spectroradiometer (MODIS) Aqua standard mapped images (SMI) on 2010 with the spatial resolution is 4 km.
-
2.3 Fisheries data Classification
Andreade (1999) divided fishery data sets into 3 groups: (a) null catches-cases with CPUE equal to zero ; (b) positive catches - cases with CPUE greater than o but lower than 17.5 tons and (c) high catches - cases with CPUE equal or greater than 17.5. The value of 17.5 is equal to the lower limit of the upper quartile of CPUE. The lower limit of the upper quartile has the same meaning with Quartile 3 (Q3). I will use number of big eye tuna to replace CPUE. Based on the data value of Q3 is 3.
-
2.4 Adjustment of Fishery Data To Remotely Sensed SST data
To Match fisheries data and remote sensed data, I use ArGIS 9.3 software. In this step, we can extract values of each SST parameter corresponding to latitude and longitude positions of the fishery dataset.
-
2.5 Regression Analysis
The data was analyzed by polynomial regression to know the relationship between SST and number of big eye tuna abundance.
Y = B0X0 + B1X1 + B2X2 + ... + BmXm
Y = BoX0 + B1X1 + B2X2 + ... + BMX m ... (1)
Note:
Y: Response variable
X: Predictor variable
M : polynomial Order
RESULT AND DISCUSSION
Relationship between fisheries and SST
n^∞^^^ ∞m^^N^∞^v^ l!l ^ \D r-,. r-,. r-,. N 0000COO'\ O"I O"I O O O N N N N N N ^T^^NNNmmm
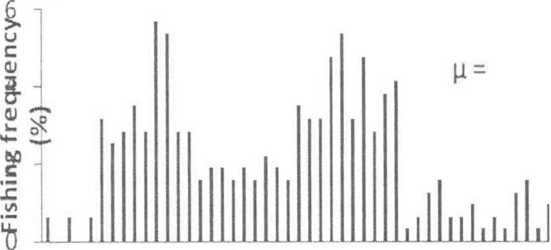
Figure 3. Fishing frequency and SST in Indian Ocean on 2010
The fishing days occurred in area and periods when SST ranged from 26.2 °C to 30.8 °C. The most catches where obtain in waters when SST varied from 27.14 °C to 29.32 °C (28.23±.1.09 °C). In the fact, on 2010 the null catches frequency reach 30%
from the fisheries data set. This in the highest null catches frequency of big eye tuna compared with the previous catches.
In this research, I used polynomial regression to analyze the data. Because of there are 3 critical point of the data, so we need separated the data into four equation.
.SP
o
... ell ..c E
3 s::
15
p
™ ^
□ ..
OJ > aJ
100
28
28.5
130 5 R2G: 01952
29
150
Q
26 26.5 SST (OC) 27 27.5
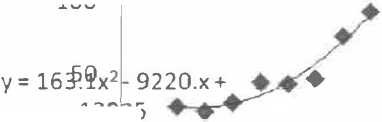
Figure 4. Total number of big eye tuna in relation to SST in Indian
Ocean on 2010, when SST less than 27.2 °C
SST(°C)
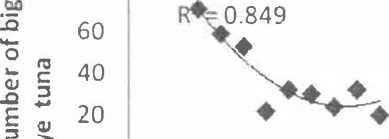
Figure 6. Total number of big eye tuna in relation to SST in Indian Ocean on 2010, when when 28.2 < SST > 29 °C
When SST ranged from 28.2 °c to 29 °c, it influence the number of big eye tuna as 95.29 %. So, SST has high correlation (r = 0.98) with number of big eye tuna. In this case, positive correlation was found. It means increasing SST until 29 °C will increase the number of big eye tuna.
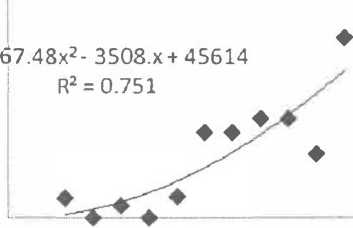
Generally SST has a significant value to big eye tuna abundance. Based on figure 4 increasing of SST until 27.2 °C will increase the number of big eye tuna and SST give the influence 75.11 % to the number of big ye tuna when SST is less than 27.2 °C. In this case correlation value is 0.87.
Ill) :.c ....
0 ... OJ ..c E
3 c
I'll
O H
111 c
3
aJ > aJ
¥ff 113.lx2-6321.x + 88354
>
s:: <U 0
S
0 27 27.5 28 28.5
SST(0C)
Figure 5. Total number of big eye tuna in relation to SST in Indian Ocean on 2010, when 27.2 <SST> 28.2 °C
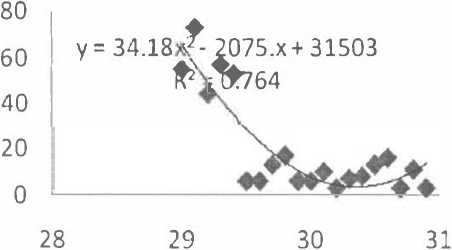
When SST ranged from 27.2 °C to 28.2 °C, it influence the number of big eye tuna as 84.91%. So, SST has high correlation (r = 0.92) with number of big eye tuna. In this case, negative correlation was found. It means increasing SST until 28.2 °c will decrease the number of big eye tuna.
SST (OC)
Figure 7 . Total number of big eye tuna in relation to SST in Indian Ocean on 2010, when SST >29 °C
When SST higher than 29 °C, it influence the number of big eye tuna as 76.43 %. So, SST has high correlation (r= o.88) with number of big eye tuna. In this case, negative correlation was found. It means increasing SST until 29 °C will decrease the number of big eye tuna.
The temporal variability between SST and number of big eye tuna is inversely pattern . SST was define on the orange line and number of big eye tuna was define on blue line. Big eye tuna is high when the SST is low.
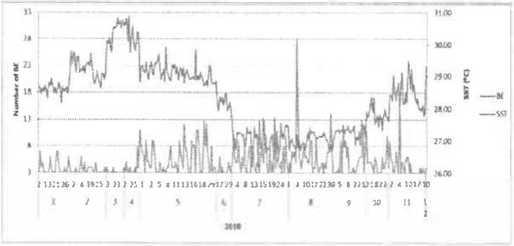
Figure 8. Temporal variability of SST and big eye tuna on 2010
Number of big eye tuna tended to high when south east monsoon (Dty season in Indonesia) that is from .June until October. In D1y season , high number of big eye tuna occurs in the area when the SST ranged from 26 °C to 29 °C. ln Wet season, there is no exact pattern to find a good condition to catch high number of big eye tuna. The highest catches mostly occurred on August which the SST tend to low value. The low catches start from February to April, the lowest catches occmred on March.
August is the lowest SST because of the upwelling phenomenon in the open ocean. In this phenomenon the water from thermocline layer which has low temperature does the upward movement to the smface layer. This condition makes the SST in the open ocean getting cooler than on the normal condition.
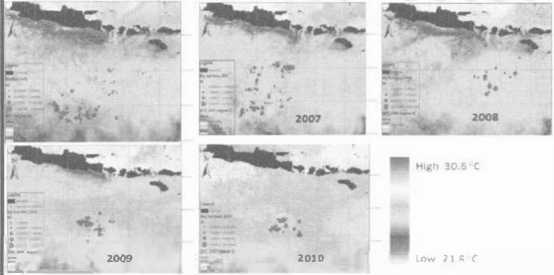
Figure 9. Spatial distribution of SST in Indian Ocean on August from
2006 to 2010
Based on the figure 9, there is increasing trend of SST year by year. This condition give a bad impact, because it will increase the null catches frequency (Setiawati, 2012). The highest temperature was found on 2010. The lowest catches was reported by the PT.Perikanan Nusantara On 2010.
CONCLUSSION
Based on the temporal variability, big eye tuna abundance is very high in south east monsoon which is the highest on August. SST significant to big eye tuna abundance with the high correlation value.
REFERENCES
Andrcade Humber Agrclli, Garcia Carlos Alberto Eiras. 1999. Skipjack tuna fishery in relation to Sea surface temperature off the southern Brazilian coast. Fisheries Ocecmogrciphy, 8(4) : 245-254
Arief Wibawa Tedja. 2010.Environmental preference og big eye tuna in Inian ocean southern .Java-Bali based on oceanographic satellite and argo floats observation. (master thesis), Oenpasar: lldayana university.
Mugo Robinson, Sei-Ichi Saitoh, Akira Nihira and Tadaaki Kuroyama. 20IO Ifabilat charactcris lies ofskipjack tuna (Kalsuwonus pclamis) in Lhe western North Pasific: a remote sensing perspective. Fisheries Oceanography, 19(5): :^82-396.
Setiawali Marti,-,i Diah. 2012. Study on Big eye Tuna Habitat in the Southern Part of.Java in Indian Ocean by Remote Sensin11,Approach. (Master Thesis). Denpasar: Udayana llnivcrsily
t'..ainuddin Mukti, Katsuva saitoh, and Seichi Sailoh.2008. Albacore (Thwmusalulunga) fishing ground in relation to oceanographic condition in lhe wcstern North Pasific Ocean using rcmotly sensed satellite dala. Fisheries Oceanography, 17(2): 61-73.
ZagagliaC'laudia R ,Joao A.I..orenzzelti, ,Jose L.Stech. 2004. Remote sensing dala and longline catches of ycllowfin tuna (Thunnus ulbacares) in the equalorial Atlantic. EU.EVIER: 267-281.
134
Discussion and feedback