ESTIMATING THE IMPACT OF SOCIAL AND ECONOMIC FACTORS ON INCOME INEQUALITY IN INDONESIA
on
BULETIN S1UD1 EKONOMI
BULETIN STUDI EKONOMI
Available online at https://ojs.unud.ac.id/index.php/bse/index
Vol. 27 No. 1, Februari 2022, pages: 53-63
ISSN : 1410-4628
e-ISSN: 2580-5312

ESTIMATING THE IMPACT OF SOCIAL AND ECONOMIC FACTORS ON INCOME INEQUALITY IN INDONESIA
Sugeng Setyadi1 Lili Indriyani2 Reska Tri Resmawati3
Article history: Abstract
Submitted:
5 Januari 2022 Revised:
26 Januari 2022 Accepted:
27 Januari 2022
Keywords:
Gini Ratio;
SDGs;
Panel Regression;
Kata Kunci:
Gini Ratio;
SDGs;
Regresi Panel;
Koresponding:
Universitas Sultan Ageng Tirtayasa, Banten, Indonesia Email:
The motivation of this research comes from United Nations Sustainable Development Goals (UN-SDGs) and their impacts by 2030. The UN highlighted 17 SDGs that address relevant local and global issues, one of which is the 10th SDG goal of reducing inequality. This study aims to determine the effect of the Human Development Index, GDP per capita, foreign investment, national investment and average years of schooling on income inequality in Indonesia during the period 2010 to 2020. This study uses panel data regression analysis, with research data that obtained from publications provided by Central Bureau of Statistics. The results showed that the Human Development Index variable and Mean Years of Schooling negative and significant effect on income inequality. This shows that the Human Development Index and mean years of schooling can reduce income inequality in Indonesia.
Abstrak
Motivasi penelitian ini berasal dari United Nations Sustainable Development Goals (UN-SDGs) dan dampaknya pada tahun 2030. PBB menyoroti 17 SDG yang menangani isu-isu lokal dan global yang relevan, salah satunya adalah tujuan ke-10 SDG untuk mengurangi ketimpangan. Penelitian ini bertujuan untuk mengetahui pengaruh indeks pembangunan manusia, PDB per kapita, investasi asing, investasi nasional dan rata-rata lama sekolah terhadap ketimpangan pendapatan di Indonesia selama periode 2010 sampai dengan tahun 2020. Penelitian ini menggunakan analisis regresi data panel, dengan data penelitian yang diperoleh dari publikasi yang disediakan oleh Badan Pusat Statistik. Hasil penelitian menunjukkan bahwa variabel indeks pembangunan manusia dan rata-rata lama sekolah berpengaruh negatif dan signifikan terhadap ketimpangan pendapatan. Hal ini menunjukkan bahwa indeks pembangunan manusia dan rata-rata lama sekolah dapat menurunkan angka ketimpangan pendapatan di Indonesia.
Universitas Sultan Ageng Tirtayasa, Banten, Indonesia 2
Email: 5553180046@untirta.ac.id
Universitas Sultan Ageng Tirtayasa, Banten, Indonesia 3
Email: 5553180026@untirta.ac.id
INTRODUCTION
In the process of economic development in a region, a common problem or often arises from a development point of view is regional inequality. This is due to the phenomenon of differences in each region such as the content of natural resources and demographic conditions, so that with these differences the possibility of encouraging the process of economic development in an area will also vary (Sjafrizal, 2008).)With the variation in production factors and the availability of resources in each region, it is not surprising that there are developed and lagging regions in each region. This causes differences in the distribution of income obtained by each community in the region. The
emergence of income inequality in each region has an impact on the level of community welfare.
Reducing income inequality is one of the goals of the Sustainable Development Goals (SDGs) which has a target to be achieved by 2030. Of the 17 SDGs addressing local issues regionally and globally, one of them is reducing inequality within and between countries. Income inequality that occurs between high and low income groups is an economic development problem faced by all countries in the world, including Indonesia. Below are the numbers in the top 20 countries in the world with the fastest inequality levels in the world, the following data is presented in Table 1.
Table 1.
Top 20 Countries in the Change in Inequality in 2000s
|
Country |
Period |
Start |
End |
Change |
% Change | ||
|
1 |
Indonesia |
2002 |
2013 |
39.5 |
6.5 |
33.0 |
19.6 |
|
2 |
Serbia |
2002 |
2015 |
38.3 |
6.3 |
32.0 |
19.7 |
|
3 |
Rwanda |
2000 |
2013 |
50.4 |
5.3 |
45.1 |
11.8 |
|
4 |
United States |
2002 |
2014 |
42.2 |
5.3 |
36.9 |
14.3 |
|
5 |
Cameroon |
2001 |
2014 |
46.5 |
4.4 |
42.1 |
10.4 |
|
6 |
Austria |
2001 |
2015 |
27.3 |
3.3 |
24.0 |
13.6 |
|
7 |
Djibouti |
2002 |
2013 |
44.1 |
3.2 |
40.9 |
7.9 |
|
8 |
Spain |
2002 |
2015 |
34.3 |
3.1 |
31.2 |
10 |
|
9 |
Luxembourg |
2001 |
2015 |
29.2 |
2.7 |
26.5 |
10.2 |
|
10 |
Slovenia |
2002 |
2015 |
24.6 |
2.6 |
22.1 |
11.6 |
|
11 |
Macedonian |
2002 |
2014 |
36.1 |
2.4 |
33.7 |
7.0 |
|
12 |
Dominican Rp |
2002 |
2013 |
54.4 |
2.4 |
52.0 |
4.5 |
|
13 |
Belarus |
2002 |
2014 |
26.9 |
2.3 |
24.6 |
9.3 |
|
14 |
France |
2002 |
2015 |
29.5 |
2.2 |
27.3 |
7.9 |
|
15 |
romania |
2002 |
2015 |
35.7 |
1.9 |
33.7 |
5.7 |
|
16 |
Bulgaria |
2002 |
2015 |
35.9 |
1.8 |
34.1 |
5.4 |
|
17 |
New Zealand |
2001 |
2014 |
35.7 |
1.8 |
33.9 |
5.2 |
|
18 |
Greece |
2001 |
2015 |
34.4 |
1.4 |
33.0 |
4.1 |
|
19 |
Costa Rica |
2002 |
2014 |
49.9 |
1.2 |
48.7 |
2.5 |
|
20 |
Latvia |
2002 |
2015 |
35.4 |
1.1 |
34.3 |
3.3 |
Source: World Income Inequality Database, 2000s
Based on Table 1. The top countries in the world are experiencing relatively fast levels of inequality that have occurred for decades. Based on these data, Indonesia was the country with the fastest inequality growth in the world during this period, with 19.6 percent of the fastest inequality, followed by Serbia, Rwanda, the United States, Cameroon, and Australia. Based on world income inequality data, Indonesia has one of the fastest inequality levels in the world based on income inequality for decades. This shows that there are problems or main factors that influence the emergence of income inequality in Indonesia.
Based on data on the level of inequality in Indonesia for the period 2010-2020 which is calculated from the Gini coefficient, it can be
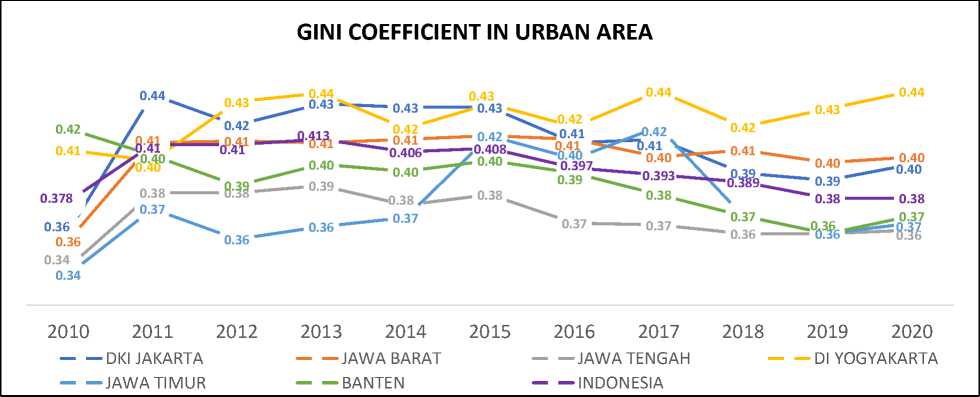
seen whether the level of inequality in Indonesia has a positive trend or not. This can be seen in the total value of income inequality, where the value is decreasing every year. In 2015, where Indonesia's Gini coefficient was 0.402, then it continued to decline until it reached 0.380 in 2019. However, if the data is broken down by province, it produces some quite interesting data. Several regions experienced fluctuations in the value of the Gini coefficient. The following is the development of the Gini coefficient between provinces in Java, which is the center of very fast economic activity in Indonesia, which can be shown in Figure 1.
Source: Central Bureau of Statistics, 2010-2020 (processed)
Figure 1.
The development of the Gini Coefficient value between provinces in Java Island
Based on Figure 1, it shows the development of the Gini coefficient on the island of Java from 2010 to 2020 with fluctuating data developments. In 2020, during the COVID-19 pandemic, the Gini coefficient
increased in all provinces. The province with the largest increase in income inequality occurred was DI Yogyakarta Province, which was recorded at 0.434, an increase of 0.01 points compared to 2019. On the other hand,
the province with the smallest increase in income inequality in Java was Central Java province which was recorded at 0.362, an increase of 0.002 points compared to the Gini figure in 2019. With economic growth increasing every year and income inequality that is still fluctuating between provinces.
The Indonesian government has taken a number of steps related to achieving the SDGs sustainable development goals in order to reduce inequality that occurs in Indonesia. One of them is the increase in the quality of human resources, which is measured by the Human Development Index (HDI). These indicators influence each other and are used as components of the HDI measure, namely health, education and standard of living. Development of Human quality that is not evenly distributed in each region can lead to income inequality. Because an area with a higher HDI will have quality human resources to ensure the welfare of the community and vice versa. Meanwhile, if the increase in HDI in a region is not accompanied by an increase in HDI in other regions, it will lead to an increase in income distribution inequality (Brata, 2002).
According to Badrudin (2017) income inequality is closely related to relative poverty. Poverty will have an impact on the unequal distribution of income between the rich and the poor, and failure to achieve a significant reduction in the level of poverty leads to an increase in the inequality of income distribution in developing countries. Therefore, efforts to reduce poverty levels need and must be accompanied by reducing income inequality in society (Arysad, 2010), but this theory is not in accordance with
research conducted by Syawie (2011). The level of poverty is actually related to inequality. However, reducing poverty does not mean reducing inequality. Syawie's findings are also in line with Afandi et al., (2017) which emphasizes that a low poverty level will actually increase inequality, so that poverty reduction or action can benefit inequality, but allow inequality to grow.
The concept of correlation between economic growth and inequality in income distribution was popularized by Kuznets, (1955), in his study of inequality in several countries. Kuznets hypothesizes that inequalities in the distribution of income tend to be prevalent in the early days of the economy. This hypothesis is known as the "Kuznets hypothesis". Where the relationship between income distribution inequality with economic growth, Kuznets describes as an "inverted U-curve". Kuznet argues that at the beginning of economic growth, an increase in per capita income will be followed by an increase in the inequality of income distribution. This will continue until both reach their peak, so that if growth continues, inequality will slowly decrease and economic growth will improve. In summary, it can be understood that short-term economic growth cannot directly solve inequality, it will increase poverty and inequality in income distribution. But in the long term, if the economy continues to grow, the distribution of income will be more even (Todaro MP., 2004).
Important factors that affect the level of productivity of a region are demographic factors such as differences in growth rates and population structure, as well as differences in health and education levels. Because good
demographics will be able to increase labor productivity, so it can increase the rate of economic growth in a region. Then the high unemployment rate will have an impact on the productivity level of a region, thus causing the region to be not optimal and the economic growth conditions in the region will lag behind other regions. Seen from the demographic aspect of unemployment in an area, where high unemployment can lead to high inequality, according to (Sjafrizal, 2012). That increasing investment and positive economic growth in an area is the goal of every local government. But when investment is high and economic growth is concentrated in only a few areas, it leads to long-term problems such as inequality in income distribution. This happens because if investment is concentrated in one area, the production capacity in other areas remains constant or even tends to decrease, causing income inequality between regions, while at the bottom, economic growth does not always have a positive relationship with equity. The existence of a relationship that is not always positive can mean a trade-off, where economic development focuses more on equity and takes longer to achieve a higher level, and vice versa, where when development focuses on achieving a higher economic level. The possibility of inequality in income distribution will also be higher (Kuncoro, 2006).
Various studies have been conducted to analyze the effect of the Human Development Index, poverty rate, GDP per capita, open unemployment rate, foreign investment, domestic investment and the ratio of the average length of schooling on income inequality. However, based on the context of the phenomenon that occurs, there are still
differences from the results of previous studies regarding the decrease or increase in income inequality. The purpose of this study is to analyze whether there is an effect of the Human Development Index, poverty rate, GDP per capita, unemployment rate, foreign investment, domestic investment and the ratio of the average school to income inequality in Indonesia in 2010 to 2020. The results of this research are expected to be useful for the government in formulating policy strategies in economic development and can help to achieve the Sustainable Development Goals (SDGs) in reducing income inequality in Indonesia.
METHODOLOGY
This study aims to analyze income inequality to achieve the Sustainable Development Goals (SDGs) in Indonesia in 2010-2020. This study uses quantitative data types, and the results of the calculations are interpreted based on the available literature. This study uses secondary data obtained from the publication of the Central Bureau of Statistics. This study deals with data on income inequality or the Gini Ratio, Human Development Index, GDP per capita, foreign investment, domestic investment, and the average length of schooling.
This research uses panel data regression method which is processed through STATA software. Panel data or pooled data is a combination of time series data and crosssectional data. This study uses 34 provinces in Indonesia as part and the period 2010-2020 as the time series. This study uses income inequality as the dependent variable, while the
selected five independent variables are the Human Development Index (IPM), GDP per capita ADHK (GDRP), foreign investment (FINVEST), domestic investment (DINVEST) and the average length of
schooling (MYS). From these modifications, the following models:
GlNlit =β0+ β1HDIit + β2lnGRDPit + β3lnFlNVESTit + β4DlNVESTit + β5MYSit + εit...................(1)
Table 2. Operational Variables
|
VARIABLE |
DEFINITION |
SOURCE |
|
GINI = Gini Ratio, Index |
The Gini Ratio is a tool for measuring inequality in the distribution of income based on the Loren curve. |
Central Bureau of Statistics |
|
HDI = Human Development Index, Index |
The Human Development Index is an indicator to measure the quality of the population based on three basic dimensions of human development, namely knowledge, health and life worthiness. |
Central Bureau of Statistics |
|
lnGRDP = Gross Regional Domestic Product per Capita at Constant Prices (ADHK) 2010, Thousand Rupiah |
GRDP per capita is an indicator to determine the level of welfare or prosperity of a region, which is measured by the total GRDP of a region divided by the total population of that region or region. |
Central Bureau of Statistics |
|
lnFINVEST = Foreign Investment, Million US $ |
Foreign Investment is a foreign investment activity that runs a business or program in the Unitary State of the Republic of Indonesia. |
Central Bureau of Statistics |
|
lnDINVEST = Domestic Investment, Billion Rupiah |
Domestic Investment is an investment activity to conduct business in the Republic of Indonesia. |
Central Bureau of Statistics |
|
MYS = Ratio of Mean Years School, Year |
Average years of schooling (RLS) or average years of schooling (MYS) is the number of years spent by the population in formal education. |
Central Bureau of Statistics |
Source: Central Bureau of Statistic, 2010-2020 (processed)
RESULT AND DISCUSSION
Based on testing using panel data regression method, there is a selection of the best models are Fixed Effect Model (FEM), Common Effect Model (CEM) and Random Effect Model (REM). With the selection of the best model, we conducted two tests, including the Chow Test and the Housman Test. The Chow test aims to test or compare in choosing the best model between CEM or FEM models. Then the Housman test is carried out to test or compare in determining the best model
between the FEM or REM models. Based on using these two tests, it shows that the Chow test produces a better FEM method than CEM. Meanwhile, in Housman test, FEM method is better than REM. So that in this study it can be concluded to decide, that the Fixed Effect Model (FEM) method is the best model in this study.
Based on the regression results, it was found that the Jarque-Berra test (3.146) is less than (<) the Chi-Squaretabel value (413.731), so the decision is Reject H0, so the conclusion is that the data is normally distributed. Based
on the regression results, it was found that the probability value (0.207) is more than (>) alpha value (0.05), so the decision is Reject H0,
so the conclusion is that the data is normally distributed.
Table 3.
Results of Partial Correlation Test
|
GINI HDI LN_GRDP LN_FINVEST LN_DINVEST MYS | |
|
GINI HDI LN_GRDP LN_FINVEST LN_DINVEST MYS |
1.0000 -0.0110 1.0000
0.1079 0.2812 0.4542 1.0000
|
Source: Secondary Data, 2010-2020 (processed)
From the multicollinearity results that have been produced, there are no variables that have a value of more than 0.80, so it is hereby concluded that there is no multicollinearity. Then the results of the Heteroscedasticity test show the probability results are greater than the value offs 0.05, and it can be concluded that it is free from heteroscedasticity. And the autocorrelation test shows that the results
probability is greater than value which is 0.05, it can be concluded that there is no autocorrelation. Based on the classical assumption test, it can be concluded that the data in this study is free from the classical assumption problem. Then the equation model in panel data regression can be shown in the Table 4.
Table 4.
Result of Panel Data Regression Estimation for Bound Variable Income Inequality
|
Variables |
(1) CEM |
(2) FEM |
(3) REM |
|
HDI |
0.000433 |
-0.00290* |
-0.00226* |
|
(0.430) |
(0.039) |
(0.013) | |
|
LN_GRDP |
-0.00256 |
-0.00203 |
-0.00233 |
|
(0.569) |
(0.920) |
(0.827) | |
|
LN_FINVEST |
0.00534*** |
0.00240 |
0.00256 |
|
(0.000) |
(0.093) |
(0.060) | |
|
LN_DINVEST |
-0.00392** |
-0.000854 |
-0.00128 |
|
(0.002) |
(0.356) |
(0.152) | |
|
MYS |
-0.000554 |
-0.00034* |
-0.000340 |
|
(0.196) |
(0.042) |
(0.147) | |
|
Constant |
0.364*** |
0.579*** |
0.540*** |
|
(0.000) |
(0.000) |
(0.000) | |
|
Observations |
363 |
363 |
363 |
|
Adjusted R2 |
0.032 |
-0.011 |
*) p < 0.05 **) p<0.01 and ***) p<0.001
Source: Secondary Data, 2010-2020 (processed)
Based on the output results of the selection of the best analytical model used, the Fixed Effect Model is obtained, which is as follows:
GINIit = 0.579 - 0.00290 HDIit -
0.00203 InGRDPit +
0.00240 InFINVESTit -0.00085 InDINVESTit -0.00034 MYSit+ εit............(2)
From the results of the regression output, it is found that the value of 0 of 0.579 means that when the value of the Human Development Index, GRDP per capita, foreign investment and domestic investment and the ratio of the average length of schooling are equal to zero, the level of income inequality is 0.579. The coefficient value of the Human Development Index is -0.00290, this shows that every increase in the Human Development Index by 1 index will reduce the level of income inequality in Indonesia by 0.00290.
The coefficient value of GRDP per capita is -0.00203 this shows that every increase in GRDP per capita is RP. 1000 it will reduce the level of income inequality in Indonesia by 0.00203. The value of the coefficient of foreign investment is 0.00240, this shows that every increase in foreign investment is 1,000. 000 US$ will increase the level of income inequality in Indonesia by 0.00240. The value of the coefficient of domestic investment is -0.00085, this shows that every increase in domestic investment is RP. 1,000,000,000 it will reduce the level of income inequality in Indonesia by 0.00085 billion. And the coefficient value of the ratio of the average length of schooling is -0.00034 this shows that every increase in the ratio of the average length of schooling by 1 year will reduce the level of income inequality in Indonesia by 0.00034 years.
Table 5.
Regression Results of Panel Data Analysis
|
Variable |
Coefficient |
Std. Error |
t-Stats |
Prob. |
Conclusion |
|
GINI |
0.579014 |
0.225335 |
2.57 |
0.015 |
- |
|
HDI |
-0.002898 |
0.001719 |
-4.69 |
0.000 |
Take effect |
|
LN_GRDP |
-0.002026 |
0.030602 |
-0.07 |
0.948 |
No effect |
|
LN_FINVEST |
0.002397 |
0.001609 |
1.49 |
0.146 |
No effect |
|
LN_DINVEST |
-0.000855 |
0.001116 |
-0.77 |
0.449 |
No effect |
|
MYS |
-0.000343 |
0.0000058 |
-5.91 |
0.000 |
Take effect |
Source: Secondary Data, 2010-2020 (processed)
Based on Table 5. Shows the results of the statistical t-test of the variables used in this research, the Human Development Index variable and the ratio of the average length of schooling have an effect on the level of income inequality in Indonesia. However, the variable GRDP per capita, foreign investment, and
domestic investment have no effect on the level of inequality in Indonesia.
Based on the results of the Human Development Index showing a negative and significant relationship to income inequality, this result is in accordance with previous research Hidayat et al., (2018), an increase in
human resources will reduce income inequality, by increasing the quality of resources Human resources will have an impact on the use of human capital which becomes efficient and labor can be accepted in the labor market and will become more productive so that they get higher incomes and will reduce income inequality.
Meanwhile, economic growth shows that there is no significant negative relationship to income inequality. This shows that increasing economic growth will reduce income inequality. These results are in accordance with the findings of research by Masud et al., (2018); Seo et al., (2020). According to the results of the study, it was found that high economic growth does not reduce income inequality. According to economic theory, Kuznets argues that where the initial economic growth is followed by an increase in income inequality, this will continue until it reaches a peak, so that with continued economic growth, inequality will slowly decrease, and economic growth conditions will improve. However, in a case study in the provinces of Indonesia that economic growth does not have much influence on the community, because in certain provinces high economic growth is caused by the capital-intensive industrial sector and this requires only a small amount of manpower so that it has little impact on economic growth. With this condition, the relationship between economic growth and income inequality has a negative relationship.
The results showed that foreign investment had a positive and insignificant relationship to income inequality. An increase in incoming foreign investment will increase
income inequality. These results are in accordance with research conducted by Fazaalloh (2019). Meanwhile, domestic investment shows that the results have a negative and insignificant relationship to income inequality. If there is an increase in domestic investment, it will have an impact on decreasing income inequality and vice versa. And this is in accordance with research conducted by Seo et al., (2020) that when there is an increase in incoming investment, both foreign and domestic, it is expected to reduce income inequality. This, incoming investment will encourage work productivity which can generate higher income and will have an impact on reducing income inequality. Government investment can reduce income inequality if the benefits of government spending itself can create increased economic activity so that people can generate better income.
The effect of the average length of schooling on income inequality has a negative and significant relationship, this shows that an increase in the average years of education will reduce income inequality. Where these results are in accordance with previous research conducted by Setyadharma et al., (2021) with the successful achievement of higher education, it is possible that someone can be accepted in the job market and will earn a higher income so that it can reduce income inequality that occurs. And these results support the Human Capital theory, where the higher the level of education means the greater the opportunity to get a decent job with a higher income or wage, and ultimately can improve the quality of life and individual
welfare and can reduce income inequality between individuals.
CONCLUSIONS AND SUGGESTIONS
Income inequality is one of the problems in economic development that is of global concern, and is one of the targets in achieving the sustainable development goals by 2030. It is very important for a country to know and determine policies related to factors that can reduce income inequality. There have been many previous studies that have examined the relationship between income inequality. However, this study uses variables from social and economic indicators as well as the role of the government in one scope of research. In this study, we found that the Human Development Index and the average number of years of schooling have a negative and significant effect on income inequality in Indonesia. The role of development capital and human educational attainment is very influential on reducing income inequality.
Suggestions that we can give to the government in making policy regarding the results of this research, the role of education and quality human resources greatly affect income inequality in an area. Because human resources with high educational attainment will assist in managing the potential of each region. So that each individual can earn their own income. The role of the government in ensuring that education services in each region are evenly distributed and accessible to all people regardless of social, economic and geographical conditions will greatly assist in reducing income inequality in Indonesia.
To ensure the welfare of the community in sustainable development, the government can also carry out policies related to the direction of investment policies carried out at home and abroad, with the investment being directed to areas that become regional and national potential. So that with this investment it can open up jobs and can increase economic competitiveness as well as improve the quality of human resources to help overcome unemployment and possibly reduce import income inequality between regions in Indonesia. The government, by participating in increasing and taking advantage of the investment value opportunities available in each region, to help the government create an even distribution of income.
REFERENCES
Afandi, A., Rantung, V. P., & Marashdeh, H. (2017). Determinant of income inequality in Indonesia. Economic Journal of Emerging Markets, 9(2), 159–171. https://doi.org/10.20885/ejem.vol9. iss2.art5
Arysad, L. (2010). Ekonomi Pembangunan (Edisi 5). Yogyakarta: UPP STIM YKPN.
Badrudin, R. (2017). Ekonomi Otonomi Daerah. Yogyakarta: UPP STIM YKPN.
Brata, A. G. (2002). Pembangunan Manusia Dan Kinerja Ekonomi Regional Di Indonesia. Jurnal Ekonomi Pembangunan, 7(2), 113–122.
Fazaalloh, A. M. (2019). Is foreign direct investment helpful to reduce income inequality in Indonesia? Economics and Sociology, 12(3), 25–36. https://doi.org/10.14254/2071-
789X.2019/12-3/2
Hidayat, M., Darwin, R., & Hadi, M. F. (2018).
Inequality of Interregional Development in Riau Indonesia; Panel Data Regression Approach. International Journal of Economics and Financial Issues, 8(5), 184–189.
http://econjournals.com/index.php/ijefi/article/ view/6919
Kuncoro, M. (2006). Ekonomi Pembangunan. Jakarta: Salemba Empat.
Kuznets, S. (1955). Economic Growth and Income Inequality. The American Economic Review, 45(1), 1-28. https://www.jstor.org/stable/181 1581
Masud, M. M., Kari, F. B., Banna, H., & Saifullah, M. K. (2018). Does income inequality affect environmental sustainability? Evidence from the ASEAN-5. Journal of the Asia Pacific Economy, 23(2), 213–228.
https://doi.org/10.1080/13547860.2018.14421 46
Seo, H. J., Kim, H., & Lee, Y. S. (2020). The dynamic relationship between inequality and sustainable economic growth. Sustainability (Switzerland), 12(14), 1–16.
https://doi.org/10.3390/su12145740
Setyadharma, A., Oktavilia, S., Utami, S., & Rizka Noormalitasari, A. (2021). Impacts of Education and Environmental Sustainability on Rural Income Inequality in Indonesia. E3S Web of Conferences, 232, 1–12.
https://doi.org/10.1051/e3sconf/20212320400 3
Sjafrizal. (2008). Ekonomi Regional, Teori dan Aplikasi. Padang: Baduose Media.
Sjafrizal. (2012). Pertumbuhan Ekonomi dan Ketimpangan Regional Wilayah Indonesia. Yogyakarta: LP3ES.
Syawie, M. (2011). Kemiskinan Dan Kesenjangan Sosial. Sosio Informa, 16(3), 213–219.
https://doi.org/10.33007/inf.v16i3.47
Todaro MP. (2004). Pembangunan Ekonomi di Dunia Ketiga. Jakarta: Ghalia Indonesia.
Buletin Studi Ekonomi
63
Discussion and feedback