Prediction Landslide Location Area Using ANN (Case study in Bangli Regency, Bali Indonesia)
on
Jurnal Bumi Lestari, Volume 21, Nomor 01, Tahun 2021, Halaman 29-36
Prediction Landslide Location Area Using ANN (Case study in Bangli Regency, Bali Indonesia)
I Made Oka Guna Antara a*, Ricardo Salvador Ríos Márquez b, Takahiro Osawa a c
a Center for Remote Sensing and Ocean Sciences (CReSOS), Udayana University, Denpasar, Bali - Indonesia b Department of Mathematics, Science and Mathematics Faculty, University of El Salvador, El Salvador
c Center for Research and Application of Satellite Remote Sensing (YUCARS), Yamaguchi University, Tokiwadai, Ube, Yamaguchi - Japan
*Email: oka@unud.ac.id
Diterima (received) 9 Februari 2021; disetujui (accepted) 20 Februari 2021; tersedia secara online (available online) 4 Maret 2021
Abstract
Landslides are significant geo-hazards heavily impacting many regions of the world regarding human lives and economic losses. The large magnitude of natural forces involved in landslides makes actions of mitigation or prevention unfeasible, with exceptions for minor occurrences or under special conditions. Many old methods have been applied in landslide management and/or prediction, such as overlays or weighting methods. The newest/advanced methods are still being developed and one of the newest methods is Artificial Neural Network (ANN). ANN are biologically inspired computer programs designed to simulate how the human brain processes information. Many types of ANN exist; the most famous one is Multilayer Perceptron (MLP) Neural Network Algorithm with FeedForward model. MLP consists of three parts: the input layers as neurons representing the value of data; the hidden layer, which demonstrates the network training process; and the output layer, which provides the prediction of the landslide areas. In this research, the input layer consists of landslide location characteristics, such as the rainfall intensity, land cover, slope, geological types, and rate displacement of landslides. As a case study, Bangli Regency was selected. In 2017 there was a landslide disaster in the Kintamani District, Bangli Regency, which resulted in dozens of people missing or dead, and several houses destroyed. In this study different numbers of neurons were used in the hidden layer (15, 50, 100, and 150 neurons). The best performance is obtained at 150 neurons, with 0.9677 (96,77%) for the test set.
Keywords: landslide; prediction; artificial neural networks
Abstrak
Tanah longsor adalah geo-bencana utama yang sangat berdampak pada banyak wilayah di dunia, berdampak terhadap nyawa manusia dan kerugian ekonomi. Kekuatan alam yang sangat besar terlibat dalam tanah longsor membuat tindakan mitigasi atau pencegahan menjadi tidak dapat dilakukan, dengan pengecualian untuk kejadian kecil atau dalam kondisi tertentu. Banyak metode lama telah diterapkan pada management dan/atau prediksi longsor, seperti metode overlay atau pembobotan. Sedangkan metode terbaru/terdepan masih dikembangkan, salah satu metode terbaru adalah Jaringan Syarat Tiruan (JST). JST adalah program komputer yang terinspirasi dari cara otak manusia memproses informasi. Banyak jenis ANN yang ada, yang terkenal salah satunya adalah Algoritma Neural Network Multilayer Perceptron (MLP) dengan model FeedForward. MLP terdiri dari tiga bagian: lapisan masukan sebagai neuron yang merepresentasikan nilai data, lapisan tersembunyi yang mendemonstrasikan proses pelatihan jaringan, dan lapisan keluaran yang memberikan prediksi area longsor. Dalam penelitian ini, input layer terdiri dari karakteristik lokasi longsor, yang meliputi intensitas curah hujan, tutupan lahan, kemiringan lereng, tipe geologi, dan laju perpindahan longsor. Sebagai studi kasus, Kabupaten Bangli dipilih, pada tahun 2017 terjadi bencana longsor di Kecamatan Kintamani, Kabupaten Bangli yang mengakibatkan puluhan orang hilang atau meninggal dunia dan beberapa rumah hancur. Dalam penelitian ini jumlah neuron yang berbeda di lapisan tersembunyi
doi: https://doi.org/10.24843/blje.2021.v21.i02.p05
© 2021 by the authors; Content from this work may be used under the terms of the Creative Commons Attribution 3.0 licence. Any further distribution of this work must maintain attribution to the author(s) and the title of the work, journal citation and DOI. Published under licence by Udayana University, Indonesia.
digunakan (15, 50, 100, dan 150 neuron). Nilai akurasi terbesar diperoleh pada 150 neuron, dengan 0,9677 (96,77%) untuk set tes.
Kata Kunci: longsor; prediksi; jaringan syaraf tiruan
Landslides are significant geo-hazards heavily impacting many regions of the world regarding human lives and economic losses. The large magnitude of natural forces involved in landslides makes actions of mitigation or prevention unfeasible, with exceptions for minor occurrences or under special conditions. The basis of methods employed in landslide research can be classified into theoretical, analytical, and numerical studies; laboratory experiments; field investigations; monitoring and inventory mapping; and GIS/Remote Sensing applications (Qiao et al., 2013).
The term landslide refers to the movement of a mass of rock, earth, or debris down a slope, including different processes, such as rock-falls, debris flows, or landslides. When these movements occur slowly, their evolution can be monitored and evaluated in the early stages, which allows the implementation of mitigation measures to minimize their negative consequences (Béjar-Pizarro et al., 2017).
Many old methods have applied in landslide management and/or prediction, such as overlays or weighting methods. The newest/advanced methods are still being developed and one of the newest methods is Artificial Neural Network (ANN). The ANN is a biologically inspired computer program designed to simulate how the human brain processes information and gathers its knowledge by detecting the patterns and relationships in data, and learning (or is trained) through experience, not from programming. The ANN is formed from hundreds of single units, artificial neurons, or processing elements, connected with coefficients (weights), which constitute the neural structure and are organized in layers (Agatonovic-Kustrin & Beresford, 2000).
Multilayer Perceptron (MLP) is a class of feedforward artificial neural network that has been widely used to express the non-linear relationship between input and output data among many neural network systems. The MLP consists of three parts: the input layers as neurons representing the value of data; the hidden layer, which demonstrates the network training process; and finally, the output layer. In previous study cases, the MLP was employed to predict the landslide areas (Mohamed et al., 2015; Rios et al., 2016).
In this research, the information of the input layer consists of the characteristics of landslide location, such as the rainfall intensity, land cover, slope, geological types, and rate displacement of landslide. The data were obtained from various sources such as: previous research, institutions, or agencies. The rainfall intensity was obtained from the GPM satellite, a joint satellite mission between JAXA and NASA. This data’s advantages are its large temporal and spatial resolution. Land cover was obtained from Sentinel-2 satellite, an ESA satellite with spatial resolution up to 10 m and five days (with two satellites) temporal resolution in the equator (ESA, n.d.-c). Slope was obtained from SRTM with 30 m spatial resolution (USGS, n.d.). The geological type (rock type) was obtained from the Geological Research and Development Center (Puslitbang Geologi) Indonesia (Purbo-Hadiwidjojo et al., 1998). Finally, rate displacement or Line of Sight (LOS) displacement of the landslide was obtained from Sentinel-1 using the Different Interferometric Synthetic Aperture Radar (D-InSAR) method. The D-InSAR method is used to find altitude information using two SAR satellites, which visit the exact same location at different times; simplifying the method subtracts the first satellite altitude with the second satellite altitude. So, the result of the subtraction gives the value change of the ground surface (Yastika & Shimizu, 2016). Sentinel-1 is a Synthetic Aperture Radar (SAR) satellite. The advantages of SAR are its all-weather capabilities as it can penetrate clouds and rain to a certain degree, and it is able to work during the day and night (Antara et al., 2021; Antara et al., 2019; ESA, n.d.-b, n.d.-a).
As a case study, in Bangli Regency occurred a landslide disaster in the Kintamani District, which resulted in dozens of people missing or dead, and several houses destroyed in 2017. This research was conducted to predict landslide locations, using ANN in the Bangli Regency, for mitigation in the future.
The research location in Bangli Regency was located in the Bali Province, Indonesia, shown in Figure 1. The Regency has a mountainous area in the north and a high rainfall intensity, causing frequent landslides. Therefore, it is necessary to create a prediction system of the area where the landslide may occur later in the future.
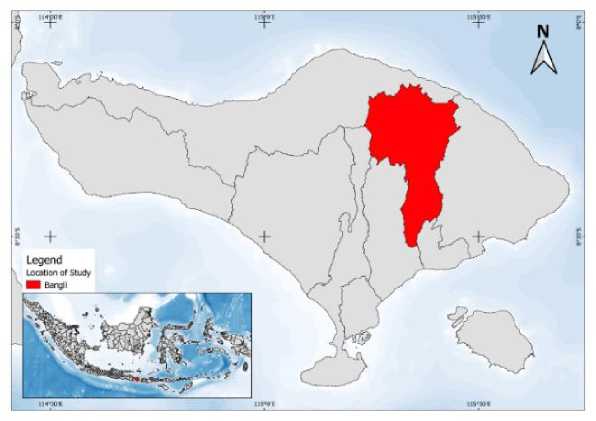
Figure 1. Research location.
-
2.2. Dataset of Research
The dataset used in this study is shown in Table 1. The landslide location map was digitized manually to create landslide locations and areas. Land cover was estimated using the Normalized Difference Vegetation Index (NDVI) method. Meanwhile, to determine the displacement rate, the D-InSAR method was used.
Table 1. Dataset used.
|
No |
Data |
Sources |
Period |
Format/ Product Type |
|
1 |
Landslide location map |
Geological Agency (Badan Geologi), Indonesia via https://vsi.esdm.go.id/index.php/gera kan-tanah/kejadian-gerakan-tanah/1491-laporan-singkat-bencana-gerakan-tanah-kecamatan-kintamani-kabupaten-bangli-provinsi-bali Sentinel-2A via |
February 2nd – 10th, 2017 |
JPG |
|
2 |
Land cover |
October 30th, 2017 |
MSIL1C |
|
GPM DPR, via | |
|
Rainfall 3 intensity |
ftp://jsimpson.pps.eosdis.nasa.gov/dat February 8th, 2017 GeoTIFF a/imerg/gis/ DEM SRTM1 via |
|
4 Slope |
http://topex.ucsd.edu/gmtsar/demgen/ - Grid data/ Geological Research and |
|
5 Geology |
Development Center (Puslitbang - ESRI shapefile Geologi) Indonesia. (Purbo- Hadiwidjojo et al., 1998) February 5th, 2017 |
|
Rate 6 displacement |
Sentinel-1 via (Pre) SLC http://scihub.copernicus.eu/dhus/ February 26th, 2017 (Post) |
-
2.3. Data Processing
MLP was employed in this research, using the python programming language on Jupyter Notebook. Figure 2 illustrates the MLP FeedForward model, using five input layers, one hidden layer, and two data in the output layers. All input layers (Table 1) were converted into Comma Separated Value (.csv) data format and the scale are equalized to 15 meters, according to the scale of the Sentinel-2A Satellite (1:60,000). The hidden layers that were used consist of 25, 50, 100, and 150 neurons. Meanwhile, the output layer consists of two values: 1 to indicate the location of landslides and 0 to indicate no landslides.
In applications, the MLP was employed for the binary classification problems. Equation (1) is the value observed in the ith input variables owned by the kth case. The expressions w and λ , shown in equations (1) and (3), are parameters of the model. In equation (3), p is the output of a neural network with k* input characteristics and j* neurons. This research p was representative of the event of landslide probability (Rios et al., 2016).
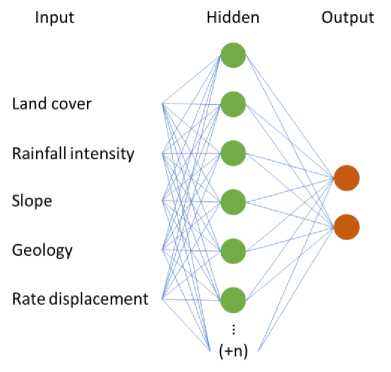
Figure 2. Illustration of MLP FeedForward model.
k*
(1)
(2)
(3)
(4)
nj,i = wj,0 +Σ wJ,kxk,i k =1
Nj,i
1
-nli
1 + exp j,'
j*
Pi=∑ ^N
J=1
j*
∑ λj= 1, λj≥ 0
J =1
This research estimated a map of landslide possibility areas and uses input data from land cover, rainfall intensity, slope, geological types, and rate displacement. Before the primary process, the first thing to do is to make the data that is known the same, using the normalized standard score method. Then the following process was to find the best percentage of scores obtained in the experimental processes by changing the number of neurons/hyperparameters as shown in Table 2.
|
Table 2. Percentage of scores for a train set, validation set, and test set. | |
|
No. |
Percentage of scores Hyperparameters Train set (60%) Validation set (20%) Test set (20%) |
|
1 2 |
25 0.9461 0.9542 0.9548 50 0.9574 0.9662 0.9670 |
|
3 4 |
100 0.9655 0.9662 0.9676 150 0.9698 0.9662 0.9677 |
The accuracy model is generated in a particular time unit or epoch on the experimental processes. During the experiments, we also used early stopping, which is helpful as an automatic stop for the training process and test data when the optimum value was reached, shown in Figure 2. The function of an accuracy model is to know model performances. It is the measure of how accurate your model's prediction is compared to the true data. Figures 2(a) and 2(c) show that the test set’s accuracy has increased, although in Figure 2(a) there are extremely fluctuating values. In the end, maximum values were achieved (0.9548 and 0.9678 respectively). While in Figures 2(b) and 2(d) the accuracy decreased when the train set reached the peak. in these cases, the final values 0.9670 and 0.9677 were achieved, respectively. In the train set, all figures get accuracy increases, although in Figure 2(d) the increase is not significant after the 4th epoch.
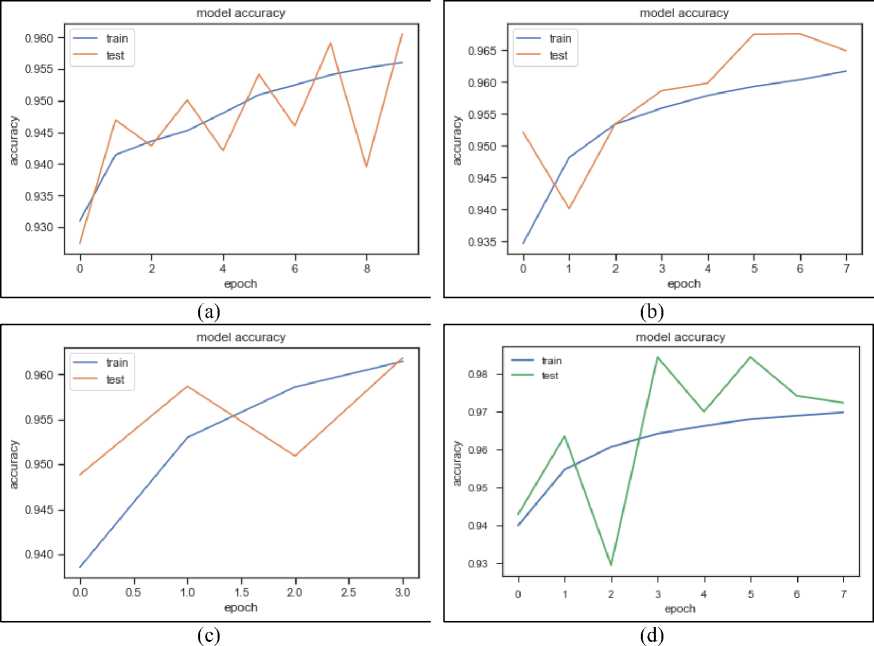
Figure 2. Model accuracy; (a) 25 Neurons; (b) 50 Neurons; (c) 100 Neurons; (d) 150 Neurons
After the experimental process is completed, a landslide prediction map is generated, as shown in Figure 3. The map was generated from points using the Inverse Distance Weighted (IDW) method. Inverse distance weighting (IDW) is a method for multivariate interpolation with a scattered set of points. Table 3 shows the level of landslide prediction, following Mandal & Mondal (2019).
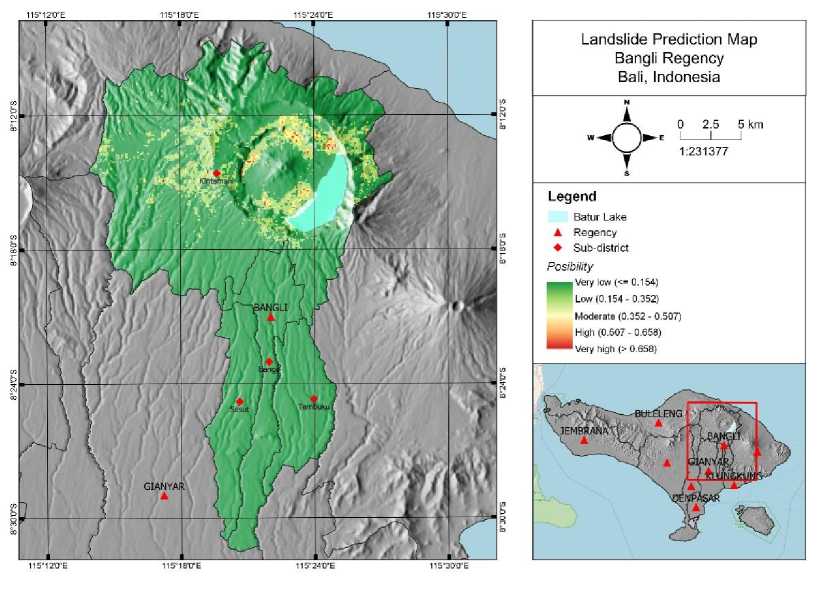
Figure 3. Landslide prediction map using 50 neurons in hidden layer.
|
Table 3. Level of landslide prediction (Mandal & Mondal, 2019 with modifications). | |
|
No |
Value Level |
|
1 |
≤ 0.154 Very low |
|
2 |
0.154 – 0.352 Low |
|
3 4 |
0.352 – 0.507 Moderate 0.507 – 0.658 High |
|
5 |
> 0.658 Very high |
In this research, the prediction of landslide locations area was successfully estimated. The Multilayer Perceptron Neural Networks were used as the method with five input parameters: land cover, rainfall intensity, slope, geology, and rate displacement. The neurons in the hidden layer are hyperparameters with 15, 50, 100, and 150 neurons. The best performance is obtained with 150 neurons, with 0.9677 (96,77%) accuracy for the test set.
Landslide prediction maps can be used as a reference to minimize the impact of landslides on future developments. The results can also be used as a basis for environmental management, such as slope management and land use management. In the future, the researchers plan to develop more predictions with different methods, more efficient input parameters, and landslide location information to improve the predictions and match the actual conditions of the analyzed area.
References
Agatonovic-Kustrin, S., & Beresford, R. (2000). Basic concepts of artificial neural network (ANN) modeling and its application in pharmaceutical research. Journal of Pharmaceutical and Biomedical Analysis, 22(5), 717–727. https://doi.org/10.1016/S0731-7085(99)00272-1
Antara, I. M. O. G., Kusmiyarti, T. B., Suyarto, R., & Wiyanti, W. (2021). KLASIFIKASI SAWAH DAN NON-SAWAH DENGAN METODE RANDOM FOREST PADA CITRA SAR SENTINEL-1 (Studi Kasus di Kecamatan Kediri, Kabupaten Tabanan, Bali). Seminar Nasional Geomatika, 245. https://doi.org/10.24895/SNG.2020.0-0.1140
Antara, I. M. O. G., Shimizu, N., Osawa, T., & Nuarsa, I. W. (2019). AN APPLICATION OF SEGNET FOR DETECTING LANDSLIDE AREAS BY USING FULLY POLARIMETRIC SAR DATA. ECOTROPHIC: Jurnal Ilmu Lingkungan (Journal of Environmental Science), 13(2), 215.
https://doi.org/10.24843/EJES.2019.v13.i02.p09
Béjar-Pizarro, M., Notti, D., Mateos, R. M., Ezquerro, P., Centolanza, G., Herrera, G., … Fernández, J. (2017). Mapping vulnerable urban areas affected by slow-moving landslides using Sentinel-1InSAR data. Remote Sensing, 9(9), 1–17. https://doi.org/10.3390/rs9090876
ESA. (n.d.-a). Mission Summary. Retrieved October 3, 2020, from
https://sentinel.esa.int/web/sentinel/missions/sentinel-1/overview/mission-summary
ESA. (n.d.-b). Sentinel-1 Overview. Retrieved November 22, 2020, from
https://sentinel.esa.int/web/sentinel/missions/sentinel-1/overview
ESA. (n.d.-c). Sentinel-2. Retrieved November 22, 2020, from
https://sentinel.esa.int/web/sentinel/missions/sentinel-2
Mandal, S., & Mondal, S. (2019). Statistical Approaches for Landslide Susceptibility Assessment and Prediction. In Statistical Approaches for Landslide Susceptibility Assessment and Prediction. Cham: Springer International Publishing. https://doi.org/10.1007/978-3-319-93897-4
Mohamed, H., Negm, A., Zahran, M., & Saavedra, O. C. (2015). Assessment of Artificial Neural Network for bathymetry estimation using High-Resolution Satellite imagery in Shallow Lakes : Case Study El Burullus Lake. International Water Technology Conference, (March), 434–444.
Purbo-Hadiwidjojo, M. M., Samodra, H., & Amin, T. C. (1998). Systematic Geological Map of Indonesia (Second Edi). Bandung: Geological Research and Development Centre.
Qiao, G., Lu, P., Scaioni, M., Xu, S., Tong, X., Feng, T., … Li, R. (2013). Landslide investigation with remote sensing and sensor network: From susceptibility mapping and scaled-down simulation towards in situ sensor network design. Remote Sensing, 5(9), 4319–4346.
https://doi.org/10.3390/rs5094319
Rios, R., Ribo, A., Mejia, R., & Molina, G. (2016). Combining Neural Networks and Geostatistics for Landslide Hazard Assessment of San Salvador Metropolitan Area, El Salvador. Rev.Mate.Teor.Aplic., 23(1), 155–172.
USGS. (n.d.). USGS EROS Archive - Digital Elevation - Shuttle Radar Topography Mission (SRTM) NonVoid Filled. https://doi.org/10.5066/F7K072R7
Yastika, P. E., & Shimizu, N. (2016, August 29). Monitoring Deformation of Ground Surface Over Extensive Area by Multi-Temporal DInSAR.
36
Discussion and feedback