SEMBUNG–KLADUAN WATERSHED NITRATE WATER QUALITY
on
SEMBUNG–KLADUAN WATERSHED NITRATE WATER QUALITY
VisiAsriningtyas1 and EdiaRahayuningsih2*
1Graduate of Environmental Science Program, Universitas GadjahMada, Indonesia 2Chemical Engineering Department, Faculty of Engineering, Universitas Gadjah Mada, *e-mail: edia_rahayu@chemeng.ugm.ac.id
Abstract
Nitrate contaminant in Sembung-Kladuan watershed, Sleman, DIY (Yogyakarta Special Regency), Indonesia was being analyzed during 2005-2006. Discharges of the rivers were also being measured. Nitrate concentrations in the rivers were usually high in wet season, while Nitrate concentrations in the wells were high in late dry season. Nitrate loadings were also being examined. A simple filtration device to clean Nitrate from the wells for drinking water was made from a PVC pipe filled with charcoal and sand. The result of this filter was reduction of Nitrate concentration in the drinking water up to 65%.
Keywords: Nitrate concentration, river, well, simple filtration
Areas around Sembung River and Kladuan River, which are tributaries of the Tambakbayan River in Sleman, Yogyakarta Special Regency (DIY), Indonesia has been recently developed as residential areas from former agricultural areas or undisturbed areas. Nitrate concentrations and loadings in these rivers are being concerned for this research, to know the trend of them in wet and dry season. A simple filtration device is also being installed as an experiment to lower Nitrate concentration from wells for drinking water. It has been found in Kaye et al. (2003), that large increase in nitrogen (N) inputs to terrestrial ecosystems typically have small effects on immediate N outputs because most N is sequestered in soil. Different types of soil, such as soil which is rich of organic matter or soil which is rich of clay, will make the N outputs different because partition coefficient values of organic matters in soil is different than that of in clay (Rahayuningsih et al., 2006), so the process of leaching will be different in different types of soil. Meynendonckx et al. (2006) examined the influence of watersheds’ characteristics to water nutrient concentrations and found out that Nitrate concentrations were positively correlated with effluent loadings coming from wastewater treatment plants and the area of the agricultural land.
Upper layer of soil consists of 3 components: soil, air and water (Fetter, 1988). Heavy rain can make Nitrate leached into the ground (Kirpackdan
Buchholz, 1993). Petry et al. (2002) stated that river water quality at the outlet of the agricultural waste needs to be monitored for a good watershed management. While Nikolaidis et al. (1998) research showed that non-point source pollution from agricultural landuse make a poor stream water quality, and so as the loadings from residential area. Longterm well monitoring of Nitrate concentration for 11 years was conducted since 1989 in Oakes, ND, in an area which has been changed into an agricultural area, because excess Nitrate concentration in wells which are also used as drinking water supply can make adverse effect to human health (Casey et al., 2002). Davis and Masten (2004) stated that Nitrogen is considered a pollutant when the level is excessive, which often leads to large growths of algae that will be oxygen-demanding material when the algae settle to the bottom of the water body after they died. Before there is human impact, water bodies are usually pure at their natural state (Asdak, 2004), and they interact with the vegetations and animals around them. Human activities such as changing landuses make this natural system altering, including different amount of nutrient in their cycles. River and its surroundings is barometer for the ecological function of the area of the watershed, so any development for human needs should refer to the impact of it to the river and its environment (Sudjarwadi et al., 2008; Maryono, 2003). Therefore, the research objective is to know
the trend of Nitrate concentrations and loadings in Sembung and Kladuan rivers in wet and dry season. In addition, to make a simple filtration device as an experiment to lower Nitrate concentration from wells of the area for drinking water, with a sample in Karangmojo village.
Tambakbayan tributaries, Sembung and Kladuan rivers, are located in the northern part of Yogyakarta Special Regency (DIY), Indonesia. This small watershed is mostly consisted of agricultural areas with developing residential areas. The location of the study area is as shown in Figure 1.
Geographically, the watershed is located between 7º37’30" – 7º47’30" S and 110º24’00" – 110º26’30" E. Northern boundary is the Merapi and Merbabu mountains, while the eastern and southern boundaries are part of Opak watershed. The western boundary is Pelang watershed. Annual average rainfall during ten years is around 2106 mm to 2526 mm, while the annual average temperature is around

Figure 1. The Location of the Study Area
23.34°C to 27.7°C. Geologic materials of the watershed are olivine, basalt, augite-hypersthene-hornblende andesite at the northern part and augite-hypersthene andesite with hornblende subordinate at the most part of the watershed. Landscapes of the watershed are volcan and volcanic foot slope with around 8º to 20º slope angle at the most part of the watershed. Dominant soil textures are sand, rough clay, and silt.
-
2.2. River Measurements
Measurements were conducted monthly at downstreams of Sembung River and Kladuan River from November 2005 to October 2006. Discharge measurements were conducted 3 to 5 times averaged at one measurement per month, by using float method. The average discharge measured can be seen in Table 1. Water quality samples were taken with sample bottles and treated with Standard Methods laboratory analysis. The laboratory analysis results are shown in Table 1.Nitrate loading was examined using the formula below:
Nitrate Loading (---) — Nitrate concentration (---) X
xsec' K ∕
IOOO X discharge (1
∖sec∕
-
2.3. Well Measurements and Filtration Device
Nitrate concentrations were being analyzed from two wells in Karangmojo village using standard method laboratory analysis. The Nitrate concentrations in water from the well ranged from 1.6 mg/l (in April) at the lowest to 18.4 mg/l (in August) at the highest. Standard acceptable Nitrate for drinking water is not more than 3 mg/l, although until 10 mg/l is still tolerated. Dangerous amount of Nitrate is if it exceeds 40 mg/l. Therefore, in this study area, purifying device is needed because Nitrate concentrations in some months are above the tolerated standard, although they are not categorized as dangerous. A simple filtration device that can be made easily at the local place and less expensive was being experimented by using a PVC pipe filled with stacked sand-charcoal filter as shown in Figure 2. The composition of the filter was (from the bottom of the pipe that was 100 cm tall, with casing of 120 cm tall):
-
a. 10 cm of gravels from the river, until the place of
the tap
-
b. 40 cm of sand from the river
Table 1. River Measurements and Laboratory Analysis
Date
River Discharge (m3∕sec)
Water Quality (Nitrate Concentration) (mg∕l)
Nitrate Loading (mg∕sec)
Remark
Sembung
Kladuan
Sembung
Kladuan
Sembung
Kladuan
Nov-05
0.21
0.012
10.2
7.5
2142
90
Sembung
Highest Loading
Dec-05
-
-
0
0
0
0
Jan-06
0.267
0.035
0
0
0
0
Feb-06
0.54
0.607
1.8
0.9
972
546.3
Mar-06
0.64
0.468
0
0
0
0
Apr-06
0.894
0.781
1.2
1.4
1072.8
1093.4
Highest Discharge
May-06
0.57
0.367
2
1
1140
367
Jun-06
0.39
0.35
0
0
0
0
Jul-06
0.396
0.41
3
6
1188
2460
Aug-06
-
-
3.8
1.2
0
0
Sep-06
0.392
0.188
4.2
8.6
1646.4
1616.8
Kladuan Highest Loading
Oct-06
0.294
0.098
9.8
0.8
2881.2
78.4
-
c. 50 cm of local charcoal < 5 mm in diameter with
some layers of local coconut skins
This device should be cleaned by rinsing the charcoal and changing or rinsing the gravels and sand once a week to twice a month.
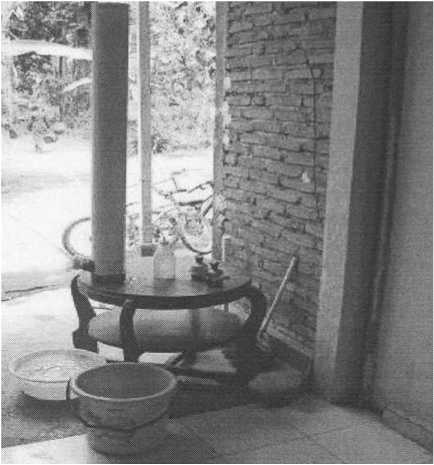
Figure 2. Simple-traditional filter for each house to clean Nitrate from well for drinking water
Physiographically and socially, Sembung-Kladuan watershed is recently developing into residential areas because many people are moving to the northern part of Yogyakarta Special Regency that is cooler and having a better terrain, which is mostly not flooded during the rainy season. Water availability for drinking and cooking is also better in the northern part than that of in the southern part although most people are not aware of the water quality in their surrounding area, which most of the part is agricultural areas, which are prevalently rich of N. Therefore, the dwelling wastes and agricultural wastes, chemically, are the most prevalent cause of the high Nitrate concentration in this research area. The river discharge and the Nitrate concentration in the river are shown in Figure 3 and Figure 4. It is shown that the maximum discharge is in April, which was still raining heavily as it was the end of the rainy season. The high discharge made the Nitrate loadings in the rivers quite high in April. The Nitrate concentration itself was high in the rainy season starting September because of the washing of soils from the agricultural land and prevalently also because of the waste from the dwellings. The complete result of the measurements and laboratory analysis of the Sembung River and Kladuan River can bee seen in Table 1.
Results from some researchers on Nitrate and N in general in watersheds are discussed as follows; Maine et al. (2009) stated that contaminants were stored in sed-iment sa-nd or in the macrophyte+ biomass. NO and NO were removed while NH was not eff3iciently2removed. Rzychon an4d Worsztynowics, 2008, has researched that sulphate concentration decreased significantly but there was no significant change in Nitrate, ammonium or total nitrogen deposition in the observed precipitation of over 14 years (1992-2005). Despite the result above (lack of trends in nitrogen deposition), a statistically drop in concentration was observed in two lakes. In Zhu et al. (2007) field measurements and model predictions indicated that 90% of atmospheric deposited nitrogen (N) was retained in soils. Atmospheric N deposition maybe the most important source of N for the long-term watershed soil nitrogen accumulation in the watershed.
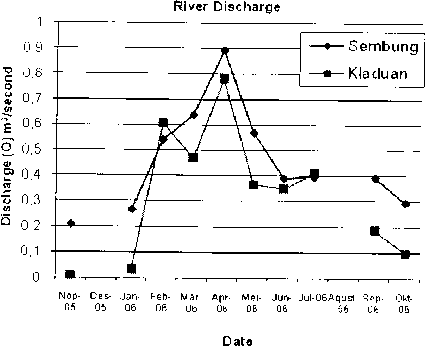
Figure 3. Discharge of Sembung and Kladuan Rivers
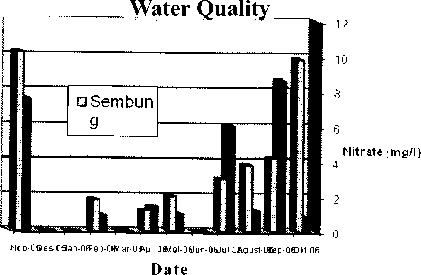
Figure 4. Nitrate Concentration of Sembung and Kladuan Rivers
Another result from other researchers are explained such as in McClain et al. (1994) that process operating at the terrestrial-lotic interface in the 10 months monitoring Central Amazonian basin may significantly alter dissolved nitrogen concentrations in groundwater as a result of shifting redox conditions and microbial communities. The complexities of nitrogen dynamics at this site must be considered more thoroughly and also near stream processes that might be impacted by forest cutting and increased Nitrate loading. Lovett et al. (2000) found out that Nitrate concentrations in some streams in the Catskill Mountains forested watersheds show a wide range of seasonal patterns and mean values, and tend to increase dramatically since late 1960s. Further exploration of the causes of variance in stream water N concentrations will help identity factors controlling N cycling and export in watersheds, and will lead to a better predictive knowledge of N saturation.
Climate and landuse change could affect both river discharge and nutrients in rivers as many have discussed before such as in Camel catchment during 1965-2000 (Sullivan et al., 2004), which showed the increase of the magnitude of high flows in the Camel River. Spatial and temporal approaches point towards a number of potential causes that are associated with both climate and landuse changes were also assessed. Pohlert et al. (2007) stated that the model for Nitrate load was spatially consistent, but not temporally. Nitrate loadings simulations for weekly and monthly basis were both acceptable but, for the daily Nitrate load, the model efficiency was insufficient. Voinov et al. (2004) also found out that because of the deforestation and effect of the urban and residential use, both peak flows and nitrogen concentrations in the river water are higher in 1992 than those of in the predevelopment conditions in 1650, while the base-flow decreased to almost half of thus in 1.650.
Long-term simulations are needed to further depict the impact of a scenario to the surrounding environment. Such long-term simulations have been carried out in the field of water resources and environmental system, such as in Rzychon and Worsztynowics (2008), Asriningtyas and Putra (2006), Constanza and Voinov (2004), Casey et al. (2002), and Nikolaidis et al. (1998).
-
3.2. Filtration of Drinking Water
Two wells that has been analysed for the Nitrate concentrations in Karang Mojo village, Sleman, DIY showed that mostly in dry season, the concentration was higher than 3 mg/l as shown in Figure 5. This experimental plot was located in dwellings that were close to agricultural land and cow farms (family husbandries).
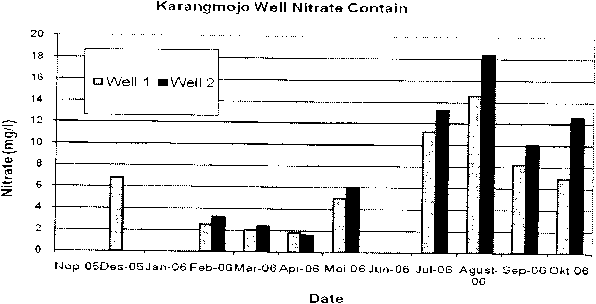
Figure 5. Nitrate Concentration in Karangmojo Wells (mg/l)
The simple filtration device were conducted during the sampling times, with the lowest concentration achieved after filtration was 1 mg/l, which is below the maximum allowed Nitrate concentration for drinking water; so it is safe to use for drinking. The filtration results are divided into two categories:
-
a. Filtration of water from wells which has Nitrate concentration less than 3.5 mg/l
In the middle to the end of the rainy season from February to April, the Nitrate concentrations were lower than 3.5 mg/l and the efficiency of the filtration was around 65%. Therefore, in these months, water quality from the wells was good enough for drinking water. b. Filtration of water from wells which has Nitrate concentration more than 3.5 mg/l
In the dry season, the Nitrate concentrations were higher than 3.5 mg/l, with the highest concentration at the end of the dry season in August. Filtration efficiencies were around 45% to 65%. So the Nitrate reduction in these months were around half of the initial concentration. Therefore in these months, water quality from the wells were still in the tolerable range (less than 10 mg/l) if the initial Nitrate concentration was less than 20 mg/l.
It is advised that the filtration device is rinsed once a week to make the filtration effective to clean the Nitrate from water. As stated before, surrounding areas in Karangmojo village are agricultural land such as paddy fields and villagers who own small farms. These farms are usually cows, chickens, and some goats. Animal farm wastes and use of fertilizers in the agricultural lands are recommended to be managed for future better water quality.
Nitrate water quality in Sembung-Kladuan watershed mostly exceeds the standard drinking water in both rivers and wells that has been examined, although most of the concentrations in the rivers are still tolerable. Nitrate loadings in the rivers that depend on the concentration and discharge were highest in Sembung River in November and in Kladuan River
in September. High Nitrate concentrations in the wells at the end of the summer season should be considered by the villagers and municipality.
Using the simple filtration device is useful to easily reduce the Nitrate content. High Nitrate concentrations both in rivers and wells are prevalently the impact of agricultural (including family husbandries around the dwellings) activities and developing of residential areas which might not be aware of their wastes. Future longterm investigations are recommended to further explain the impact of agricultural land use and dwellings to water quality, both in surface water and groundwater.
Acknowledgements
The authors thank DIPA UGM 2005 and Surface Water Laboratory, Faculty of Geography, UGM, DIY, Indonesia for the funding of the research and facilities in the laboratory. Part of the research is dedicated as a public service (pengabdian kepada masyarakat) in Karangmojo village, Sleman, DIY, Indonesia (2006) and the authors give sincere gratitude to Lilies Prabandari and the family for providing space for onsite experiment. The authors also thank Anif Farida, Faisal Buchari and Rosidatu Diniyah for helping in some part of the research.
References
Asdak, C. 2004. HidrologidanPengelolaan Daerah Aliran Sungai.GadjahMada University Press, Yogyakarta.
Asriningtyas, V. and D.P.E. Putra. 2006. “Ten Year Groundwater Simulation in Merapi Aquifer, Sleman, DIY, Indonesia”. Indonesian Journal of Geography, 38(1).1-14.
Casey, F.X.M., Derby, N., Knighton, R.E., Steele, D.D., and E.C. Stegman. 2002. “Initiation of Irrigation Effects on Temporal Nitrate Leaching”. Vadose Zone Journal, 1.300-309.
Costanza, R. and A.Voinov(eds.). 2004. Landscape Simulation Modeling: A Spatially Explicit, Dynamic Approach. Springer, New York.
Davis, M. L. and S.J. Masten. 2004. Principles of Environmental Engineering and Science, International Edition.McGraw-Hill, Boston.
Fetter, C.W. 1988.Applied Hydrogeology, Second Edition. Macmillan Publishing Company, New York.
Kaye, J.P., Binkley, D., and C. Rhoades. 2003. “Stable Soil Nitrogen Accumulation and Flexible Organic Matter Stoichiometry during Primary Floodplain Succession. “Biogeochemistry, 63.1-22.
Killpack, S.C. and D. Buchholz.1993.University of Missouri Extension. Nitrogen in the Environmen: Leaching.http://muextension. missouri.edu/ explore/ envqual/ wq0262. htm. Accessed June 2005.
Lovett, G. M., Weathers, K.C., and W.V. Sobzak. 2000. “Nitrogen Saturation and Retention in Forested Watersheds of the Catskill Mountains, New York”. Ecological Application, 10(1).73-84.
Maine, M.A., Sune, N., Hadad, H., Sanchez, G., and C. Bonetto. 2009. “Influence of Vegetation on the Removal of Heavy Metals and Nutrients in a Constructed Wetland”. Journal of Environmental Management, 90.355-363.
Maryono, A. 2003.Pembangunan Sungai: Dampak dan Restorasi Sungai (River Development: Impacts and River Restorations), Magister SistemTeknik, Program Pascasarjana, UniversitasGadjahMada, Yogyakarta.
McClain, M.E., Richey, J.E., and T.P. Pimentel. 1994. “Groundwater Nitrogen Dynamics at the Terrestrial-Lotic Interface at a Small Catchment in the Central Amazon Basin”. Biogeochemistry, 27.113-127.
Meynendonckx, J., Heuvelmans, G., Muys, B., and J. Feyen. 2006. “Effects of Watershed and Riparian Zone Characteristics in the River Scheldt Basin”.Hydrol. Earth Syst. Sci., 10.913-922.
Nikolaidis, N.P., Heng, H., Semagin, R., and J.C. Clausen. 1998. “Non-linear Response of a Mixed Land Use Watershed to Nitrogen Loading”. Agriculture, Ecosystems and Environment, 67.251-265.
Petry, J., Soulsby, C., Malcolm, I.A., and A.F. Youngson. 2002. “Hydrological Controls on Nutrient Concentrations and Fluxes in Agricultural Catchments”. The Science of the Total Environment, 294.95-110.
Pohlert, T., Brauer, L., Huisman, J.A., and H.G. Frede. 2007. “Assessing the Model Performance of an Integrated Hydrological and Biogeochemical Model for Discharge and Nitrate Load predictions”.Hydrol. Earth Syst. Sci., 11.997-1011.
Rahayuningsih, E., Mindaryani, A., Andri, M., and B. Radjaguguk. 2006. “Laju Reaksi Hidrolisis Herbisida Glifosfat di Tanah Jenuh Air”.Forum Teknik: Majalah Ilmiah Teknologi, 30:2.80-89.
Rzychon, D. and A. Worsztynowics. 2008. “What Affects the Nitrogen Retention in Tatra Mountains Lakes’ Catchments in Poland?” Hydrol. Earth Syst. Sci., 12.415-424.
Sudjarwadi, Pandu, M., Anton, B., and V. Asriningtyas. 2008. Pengembangan Sumber Daya Air. Biro PenerbitTeknikSipil UGM, Yogyakarta.
Voinov, A., Costanza, R., Boumans, R. M. J., Maxwell, T., and H. Voinov. “Patuxent Landscape Model: Integrated Modeling of a Watershed”, in Costanza, R., Voinov, A. (eds.). 2004. Landscape Simulation Modeling: A Spatially Explicit, Dynamic Approach. Springer, New York.
Zhu, Z., Arp, P.A., Meng, F., Bourque, C. P. A., and A. Mazumder. 2007. “Modeling Response of Soil Productivity to Biogeochemical Cycling and Atmospheric Acid Deposition in the Hayden Brook Watershed (Canada) using the ForNBM Model”. Ecological Modelling, 205.410-422.
76
Discussion and feedback