MULTIVARIATE ANALYSIS OF BALI SALAK CULTIVARS (SALACCA ZALACCA VAR. AMBOINENSIS (BECC.) MOGEA) BASED ON LEAF MICROMORPHOLOGICAL CHARACTERS
on
JURNAL BIOLOGI XV (I) : 15 - 18
ISSN : 1410 5292
MULTIVARIATE ANALYSIS OF BALI SALAK CULTIVARS (Salacca zalacca var. Amboinensis (Becc.) Mogea) BASED ON LEAF MICROMORPHOLOGICAL CHARACTERS
Ni Made Gari
Biology Department, Faculty of Mathematics and Natural Sciences, Udayana University, Bukit Jimbaran Campus – Bali;
e-mail: nm.gari@gmail.com
ABSTARCT
Leaf micromorphology of 13 Bali salak cultivars was studied by using multivariate analysis (Principal component analysis). The results showed that the cultivars clustered into a main group consisted of nine cultivars (Boni, Bingin, Selem, Embad, Nangka, Penyalin, Maong, Nyuh, and Putih). However, two cultivars (Muani and Gondok) were distinctly separated from this main group and two the others Nanas and Gula were intermediate.
The principal component analysis (PCA) revealed that the main group has highly correlated to the characters abaxial cell length and number of cross vein density. Muani cultivar generally had longer adaxial cells, wider guard cells and lower stomatal index than the other cultivars. These three characters strongly influenced the separation of Muani from the others. Similarly, Gondok cultivar generally had wider abaxial cells than the other cultivars that discriminated Gondok clearly from the others. Whereas, the intermediate cultivars (Gula and Nanas) were placed between the main group that consisted of nine cultivars and the two separated cultivars (Muani and Gondok). These cultivars (Gula and Nanas) had intermediate values, which influenced their separations.
Keywords: multivariate analysis, Salacca zalacca var. Amboinensis, taxonomic implication, leaf epidermis.
INTISARI
Studi mikromorfologi daun pada 13 kultivar salak Bali telah dilakukan dengan analisis multivariat. Hasil penelitian ini menunjukkan adanya kelompok utama kultivar salak Bali yang terdiri dari sembilan kultivar. Sedangkan kultivar Muani dan Gondok terpisah jauh dari kelompok utama tersebut dan dua kultivar lainnya yaitu Nanas dan Gula berada pada posisi diantara dua kultivar Muani dan Gondok dan kelompok utama yang terdiri dari sembilan kultivar.
Hasil analisis multivariat (Principal component analysis) menunjukkan bahwa kelompok sembilan kultivar tersebut mempunyai korelasi yang kuat dengan karakter-karakter yaitu panjang sel abaksial dan jumlah urat-urat melintang pada daun. Kultivar Muani mempunyai sel adaksial lebih panjang, sel penutup lebih lebar dan nilai index stomata lebih rendah dibandingkan dengan kultivar-kultivar yang lain, sehingga menempatkan kultivar Muani jauh dari kultivar-kultivar lainnya. Hal yang mirip terjadi pada kultivar Gondok dimana secara umum mempunyai ciri-ciri spesifik yaitu sel abaksial lebih lebar dari pada kultivar-kultivar lainnya. Sedangkan kultivar Nanas dan Gula mempunyai ciri-ciri karakter yang intermediet sehingga berada diantara kelompok utama yang terdiri dari 9 kultivar dan dua kultivar Muani dan Gondok.
Kata kunci: analisis multivariat, Salacca zalacca var. Amboinensis, implikasi taksonomi, epidermis daun.
INTRODUCTION
Multivariate analysis is a statistical method, which is concerned with analyzing multiple measurements of several samples of individual. The multivariate techniques utilize measurements of sample similarity or dissimilarity across all the data provided; for the analysis in this study “samples” generally refers to character means for a number of replicated measurements (Cooly and Lohnes, 1971). Principal component analysis (PCA) is one of the multivariate techniques, which uses an ordination to display the relative positions of points in a multivariate space. This method is essentially an exploratory technique that allows investigation of pattern of variation and relationship among the points (Manly, 1997). To do this, PCA uses information of the correlations between variables. The goal
of PCA is to extract maximum variance from a number of variables, with a few orthogonal components (Manly, 1997). In the analysis, the first principal components extract the most variance and the last component the least variance. Therefore, the first few components retain the most variation in the analysis, conversely for those of the last few components (Flury, 1988).
Bali salak cultivars are commonly grown in Bali and have high economical values as a trade commodity principally for local farmers in Karangasem Regency Bali. Thirteen cultivars are found in Bali, but the identification of all of these cultivars is only based on common knowledge of fruits features (Oka, 1995). Although some anatomical studies had been carried out (Utami, 1989 and Darmadi, 2001), however detailed taxonomic works on the variation of the cultivars based on leaf micromorphological characters have
This article was received on 15 May 2011, accepted on 20 June 2011
not been examined. Barford (1988) and Solangi et. al., (2010) found that the micromorphological structure of the leaf surfaces such as, epidermal cells, stomata and cuticles vary from species to species, or even among cultivars. Therefore, this study was aimed to investigate the possible taxonomic implications of leaf epidermal characters of Bali salak cultivars using multivariate analysis methods and the variations may be considered to be useful for cultivar identifications.
MATERIALS AND METHODS
Leaf samples were collected from the farmer fields at Sibetan Village, Karangasem Bali. Three leaf samples were collected from each of the 13 cultivars. Therefore, the total number of plants sampled was 39. Epidermal peels were prepared based on the method of Artschwager (1930). Small segments of lamina/dried leaflet (1 cm2) were cut. Tissue samples are placed in test tubes and 2 ml of concentrated nitric acid was added together with a few crystals of potassium chlorate (KClO2). The mixture was boiled and then poured slowly into distilled water to cool the mixture and to halt the maceration process. The sample was stained in a mixture of safranine and alcian blue (0.5% aqueous solution) for three hours, then rinsed in absolute ethyl alcohol for 30 minutes, followed by a second rinse for additional 30 minutes (Ilic, 1985).
One slide was made for each of the 3 leaf samples and three representative fields of views were selected from each slide. Three cells were selected randomly from each field and length and width were measured. Therefore, the total number of cells observed per cultivar was 27 cells. The means of length and width of epidermal cells were then determined for each leaf, and subsequently a mean was determined for each cultivar (Appendix 1). All samples were observed using a compound Olympus microscope at magnification X 400, with an eyepiece micrometer. A microscope digital camera DP 12 system (Figure 1B) was used to photographed the samples. The stomatal index (I) was calculated according to the formula given by Salisbury (1927), where S = number of stomata per unit area and E = number of epidermal cells per unit area (I = S / (S + E) x 100%. Leaf venation patterns were examined using a strong backlight, with a standard 12.5 mm diameter of magnification (Figure 1B). The number of parallel veins, transverse vein and parallel vein crossed by transverse vein were counted for five samples per cultivar, and means were calculated (Dowe, 2001).
PCA was used to analyze the pattern of variations among all of the cultivars. A nominal data was used in this analysis. A diversity of data is equally useful in multivariate analysis (Cooly and Lohnes, 1971). Lists of the characters used in this analysis are presented in Table 2. Kaiser-Mayer-Olkin (KMO) test was used to examine the correlation among variables or the sampling adequacy. The percentage of variances explained in the analysis is presented in an eigen value table. The computer software package used for the data analysis was the SPSS for Windows (Coakes and Steed, 2001).
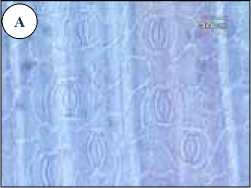
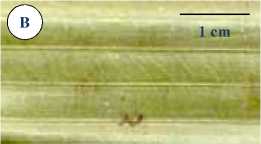
Figure 1. A light microscope (LM) image of an abaxial leaf epidermal surface of Bali salak cultivars. Magnification x 400 (A). Venation patterns in Bali salak cultivars (B).
RESULTS
The principal component analysis shows that the first principal component accounted for 43.56 of the variation and the second accounted for 27.08. The cumulative sums of percentage variance in those two main axes are 70.64. The eigen values / the percentage variance and cumulative variations explained in this analysis are given in Table 1. While, a plot of the scores for the first two components is presented in Figure 2. The Kaiser-Mayer-Olkin (KMO) test scored 0.48 for this analysis.
On the first component axis, two cultivars, Gula (C1) and Muani (C11) clearly separated out from the others (Figure 2). It can be seen from the table of principal component loadings (Table 2) and the character vector diagram (Figure 3), that the adaxial cell length, adaxial cell width, guard cell width, abaxial stomatal density, stomatal index and parallel vein density (A, B, F, G, H and I) were the important characters in causing this separation. All these characters had high value of principal component loadings or high values of correlation.
On the second principal component axis, Nanas (9) and gondok (10) separated out distinctly from the rest (Figure 2). These two cultivars had high correlation to the adaxial cell width, abaxial cell length, abaxial cell width, abaxial stomatal density and the number of parallel veins covered by transverse veins (B, C, D, G, and K) (Table 2 and Figure 3).
The scatter plot of the first two components of 11 characters indicated that the cultivars clustered into a main group consisted of nine cultivars (Figure 2). Four cultivars (Gula, Nanas, Gondok and Muani) were quite distinct from the main cluster of 9 cultivars. Even more, the two cultivars (Gondok and Muani) were clearly separated out from the main group, as well as from Gula and Nanas. There were also some evidences that two characters, adaxial cell width and abaxial stomatal density (B and G) had nearly the same values of principal component loading in PCA1 and PCA2. The values of the factor loading for both characters are as shown in Table 2.
Table 1. Eigen values / percentage variance and cumulative variance in Principal Component Analysis for 13 Bali salak cultivars.
|
Component |
Eigen values Percentage variance |
Cumulative variance |
|
1 |
43.56 |
43.56 |
|
2 |
27.08 |
70.64 |
|
3 |
8.70 |
79.34 |
|
4 |
7.76 |
87.1 |
|
5 |
4.52 |
91.61 |
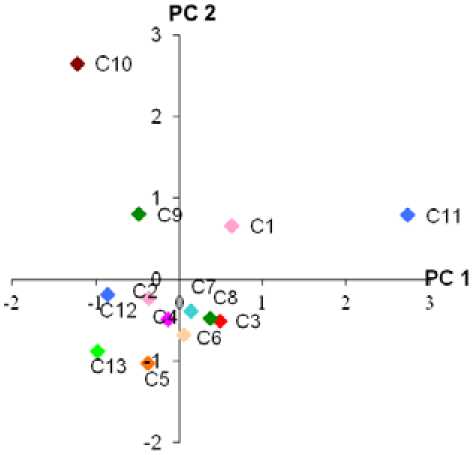
Figure 2. Projection of Bali salak cultivars onto the axes representing the first two components from principal component analysis. PC 1= Principal component 1, PC 2= Principal component 2. Abbreviations of the cultivars are as per Table 2.
DISCUSSIONS
The results of this analysis demonstrate that there was one main phenetic group, consisted of 9 cultivars that belong to the Bali salak cultivars. However, two cultivars (Muani and Gondok) were distinctly separated from this main group and two the others Nanas and Gula were intermediate (Figure 2). The principal component analysis suggests that the main group has highly correlated to the characters C and J (Figure 3). This indicates that all cultivars in this group have a similar abaxial cell length and number of cross vein density (C and J), therefore placed them closed in one group.
Muani (11) and Gondok (10) were separated distinctly from the main cluster. This can be seen from the PCA analysis (Table 2) and the mean values of the data set (Appendix 1). Muani cultivar generally had longer adaxial cells, wider guard cells and lower stomatal index than the other cultivars. These three characters strongly influenced the separation of Muani from the others. This result supported the studies by Stace, (1984); Wilkinson, (1979) and Solangi et. al., (2010), which found that micromorphological characters of leaf surfaces can assist in taxonomic identification and classification because of their high structural diversity. Similarly, Gondok cultivar generally had wider abaxial cells than the other cultivars. This is an exclusive attribute that discriminate the Gondok cultivar distinctly from the other cultivars. Whereas, the intermediate cultivars (Gula (1) and Nanas (10)) were placed between the main group that consisted of nine cultivars and the two separated cultivars (Muani and Gondok). These cultivars (Gula and Nanas) had intermediate values, which influenced their separations.
However, the results from this analysis suggested that the low statistical supports for the PCA analysis should
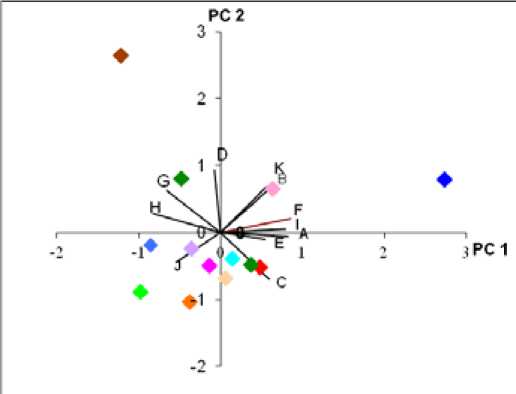
Figure 3. The vector diagram, showing contributions of single characters onto first two axis, influencing the separation of the cultivars in the first two principal component analysis. Symbols are as per Table 2.
Table 2. Factor component loading of principal component 1 and principal component 2.
|
No. |
Character |
PC 1 |
PC 2 |
|
1 |
Adaxial cell length (A) |
0.8296 |
-0.0579 |
|
2 |
Adaxial cell width (B) |
0.6084 |
0.6658 |
|
3 |
Abaxial cell length (C) |
0.5929 |
-0.6923 |
|
4 |
Abaxial cell width (D) |
-0.0785 |
0.9293 |
|
5 |
Guard cell length (E) |
0.5498 |
-0.0991 |
|
6 |
Guard cell width (F) |
0.8585 |
0.2054 |
|
7 |
Abaxial stomatal density (G) |
-0.6558 |
0.6284 |
|
8 |
Stomatal index (H) |
-0.8197 |
0.2892 |
|
9 |
Parallel vein density (I) |
0.7972 |
0.0491 |
|
10 |
Cross vein density (J) |
-0.5430 |
-0.4423 |
|
11 |
Number of parallel veins covered by transverse veins (K) |
0.5516 |
0.6786 |
be taken into account. This is due to Kaiser-Mayer-Olkin (KMO) test only scored 0.48 for this analysis. It indicated that the correlation among variables for this analysis was quite low. Therefore, the usefulness of the PCA result from this analysis as an indicator of taxonomic implications may be limited.
CONCLUSIONS
The multivariate analysis revealed the distinct nature of the four cultivars (Muani, Gondok, Nanas and Gula), as well as the characters critical to their grouping. The nine other cultivars clustered into one main group. It is also revealed a low statistical support, with a low value of Kaiser-Mayer-Olkin (KMO) test for sampling adequacy. Therefore, the results might have limited implications for discriminating the cultivars.
Although, leaf surface features were not sufficient for distinguishing the Bali salak cultivars in this study, in general it could be concluded that leaf micromorphological features had systematic values and gave additional support to distinguish the cultivars. However, leaf micromorphological characters must be interpreted with some circumspection discriminators.
REFERENCES
Artschwager, E. 1930. A comparative study of the stem epidermis of certain sugarcane varieties. J. Agric. Res. 41: 853-865.
Barford, A.S. 1988. Leaf anatomy and it significance in Phytele-phantoid Palms (Arecaceae). Nord. J. Bot. Vol. 8(4) : 313-348.
Coakes, S.J., and L.G. Steed. 2001. SPSS: Analysis without anguish: version 10.0 for Windows. Wiley: Brisbane.
Cooly, W.W. & P.R. Lohnes. 1971. Multivariate data analysis. John Wiley & Sons, INC.: New York.
Darmadi, A.A. 2001. Studi Taksonomi pada kultivar salak Bali (Salacca zalacca var. amboinensis (Becc.) Mogea). Thesis, IPB, Bogor, Indonesia.
Dowe, J.L. 2001. Studies in the Genus Livistona (Coryphoideae: Arecaceae), PhD Thesis. James Cook University: Townsville, Australia.
Flury, B. 1988. Common principal component and related multivariate methods. John Wiley & Sons, INC.: New York.
Ilic, J. 1985. The family key for hardwood identification. CSIRO, Division of Chemical and wood technology, Autralia, Technical paper, No. 8.
Manly, B.F.J. 1997. Multivariate statistic analysis methods: a primer, Chapman and Hall, London.
Oka, I.B. 1995. Studi pada beberapa kultivar salak Bali. Laporan Penelitian. Fakultas Pertanian Universitas Udayana, Bali.
Salisbury, E.J. 1927. On the causes and ecological significance of stomatal frequency with special reference to the woodland flora. Phil. Trans. Roy. Soc. Ser. 216: 1-65.
Solangi, A.H., M.A. Arain and M.Z. Iqbal. 2010. Stomatal studies of coconut (Cocos nucifera L.) varieties at coastal area of Pakistan. Pak. J. Bot. Vol. 42(5) : 3015-3021.
Stace, C. A. 1984. The taxonomic importance of the leaf surface. In: Current concepts in plant taxonomy, Eds. (H. Heywood and D. M. Moore) pp. 67-94. Academic Press, London.
Utami, N. 1989. Anatomi daun dari Kecambah Salacca zalacca var. zalacca dan Salacca zalacca var. amboinensis. Bogor: Herbarium Bogoriense. Balitbang botany, Puslitbang Biologi, LIPI. 4 hlm.
Wilkinson, H.P. 1979. The plant surface (mainly leaf). In Anatomy of the Dicotyledon, Eds. (C.R.Metcalfe & L. Chalk), Vol. 1, pp 97-165. Oxford, Clarendon Press: U.K.
Appendix 1. The nominal data from the mean values of 11 characters of Bali salak cultivars used in multivariate analysis. Characters abbreviations are as per Table 2.
|
No. |
Cultivar/ Character |
A (µm) |
B (µm) |
C (µm) |
D (µm) |
E (µm) |
F (µm) |
G |
H |
IJ |
K | |
|
1 |
Gula(C1) |
39.39 |
25.12 |
42.01 |
28.05 |
34.2 |
10.3 |
17.4 |
13.84 |
10.2 |
13.6 |
3.8 |
|
2 |
Boni(C2) |
37.5 |
23.64 |
41.11 |
25.11 |
37.33 |
9.96 |
17.62 |
16.89 |
10.1 |
18 |
2.9 |
|
3 |
Bingin(C3) |
40.56 |
25.07 |
41.74 |
26.03 |
37.33 |
10.1 |
15.58 |
13.31 |
10.1 |
18.2 |
3 |
|
4 |
Selem(C4) |
38.87 |
22.51 |
40.67 |
24.19 |
38.59 |
10.3 |
17.27 |
15.52 |
10 |
18.55 |
3.08 |
|
5 |
Embad(C5) |
38.13 |
23.18 |
40.44 |
24.31 |
36.24 |
9.69 |
16.69 |
15 |
10.2 |
22 |
2.3 |
|
6 |
Nangka(C6) |
37.59 |
21.44 |
43.05 |
25.07 |
35.61 |
9.95 |
16.27 |
15.44 |
10.2 |
15 |
2.8 |
|
7 |
Penyal(C7) |
39.93 |
23.43 |
39.73 |
26.41 |
37.67 |
10.3 |
16.32 |
14.36 |
10.1 |
19 |
2.8 |
|
8 |
Maong(C8) |
39.9 |
23.35 |
44.22 |
25.57 |
36.28 |
9.82 |
16.22 |
13.38 |
10 |
13.33 |
3.22 |
|
9 |
Nanas(C9) |
40.32 |
22.68 |
39.3 |
27.63 |
35.78 |
9.93 |
19.79 |
17.08 |
10.1 |
18.16 |
3.85 |
|
10 |
Gondok(C10) |
34.48 |
27.78 |
30.82 |
33.76 |
33.01 |
9.78 |
20.15 |
17.47 |
10 |
15.8 |
3.4 |
|
11 |
Muani(C11) |
50.98 |
29.85 |
43.98 |
28.72 |
39.75 |
11.3 |
15.86 |
11.61 |
10.4 |
13.14 |
4 |
|
12 |
Nyuh(C12) |
39 |
20.74 |
40.8 |
28.02 |
37.67 |
9.03 |
18.9 |
15.35 |
10 |
17.2 |
2.7 |
|
13 |
Putih(C13) |
41.36 |
21.25 |
41.26 |
26.18 |
28.83 |
9.48 |
17.54 |
14.8 |
10 |
19.66 |
2 |
18
Discussion and feedback