Lead and Copper Heavy Metal Content in the Morosari Waters, Demak Region
on
Advances in Tropical Biodiversity and
Environmental Sciences
7(1): 35-38, February, 2023
e-ISSN:2622-0628
DOI: 10.24843/ATBES.2023.v07.i01.p06
Available online at: https://ojs.unud.ac.id/index.php/ATBES/article/view/98487
Lead and Copper Heavy Metal Content in the Morosari Waters, Demak Region
Suprabadevi Ayumayasari Saraswati1*, Lumban Nauli Lumban Toruan1, and Ipanna Enggar Susetya2
1Study Program of Aquatic Resource Management, Faculty of Marine Science and Fisheries, Nusa Cendana University, Indonesia
-
2 Study Program of Aquatic Resource Management, Faculty of Agriculture, Sumatra Utara University, Indonesia
*Corresponding author: Suprabadevi@staf.undana.ac.id
Abstract. The utilization of river bodies as waste disposal has an impact on the entry of heavy metals into the sea. The Morosari estuary area is an estuary area, which consists of mangrove areas, tourist areas, and several industrial activities, both large-scale and household. This condition causes the entry of waste containing heavy metals lead (Pb) and copper (Cu) into the estuary area. This study aims to determine the content of heavy metals Pb and Cu in the estuary of the Morosari River. This research was conducted in April to June 2009 and took place in the Morosari River estuary, Demak Region. The research method used was a descriptive exploratory method, while the sampling was purposive. random sampling, to 3 stations. Water samples are taken every 2 weeks, and followed by an analysis carried out at the Growth Center Laboratory, Kopertis Region IV, Semarang. The data obtained were analyzed descriptively. Analysis results for Pb content in water 0.039-0.089 and Cu content in water 0.024-0.055 mg/l. The value of heavy metal content in the water has exceeded the threshold.
Keywords: Pb and Cu; Heavy Metals; Water; Morosari Demak
-
I. INTRODUCTION
Estuarine or estuary waters are the final part of the fresh water channel from the mainland. Human activities in the mainland generate various wastes which are ultimately disposed of in these waterways. Household waste from human activities causes water productivity to decrease. Waste containing heavy metals not only affects the solubility of oxygen, but can also accumulate in the biota that live in the area [6], the presence of toxic waste in waters will have a multiplier effect on aquatic productivity. This toxic waste will affect the optimization of the photosynthesis process, reduce the intensity of sunlight, reduce the solubility of oxygen and affect the metabolism of the biota in it. The Morosari River basin is used as a residential area and there are also fishing activities and industrial areas.
Besides that, the Morosari River basin is used as a residential area, there are also fishing activities and industrial areas. Most of the industries in the area have types of waste in the form of heavy metals from painting
furniture, coloring in cans, making bottle caps in the beverage industry, and printing, which produce lead (Pb) and copper (Cu) metals, from their waste [15], if food and drink contaminated with Pb are consumed, the body will excrete it but some of it is also absorbed by the body. Adults absorb 5-15% of the total Pb ingested, while children absorb 41.5% more Pb. With these considerations in mind and given the potential content of industrial wastes which will endanger aquatic ecosystems and the surrounding community, it is necessary to conduct research to determine the content of heavy metals Pb and Cu in the waters of Morosari, Sayung District, Demak.
-
II. RESEARCH METHODS
The material used in this study was water obtained from the waters of Morosari. Sampling is also measured by environmental parameters including temperature, salinity, pH, dissolved oxygen and water brightness. The research method used is descriptive exploratory method, namely research that is intended to interpret events that are presented systematically, factually, and accurately
regarding the factors and characteristics of the population in a certain area [9].
At each station water samples are taken every two weeks. Sampling was carried out on April 26, May 10, May 24 and June 7, and June 21 2009. The water samples taken were then analyzed for heavy metal content. In addition, measurements of physical and chemical parameters of the waters including: temperature, salinity, water quality were carried out in situ when sampling at each research station. The heavy metal analysis procedure consists of analysis of crab meat and water. The method used is the method of testing for heavy metal content according to the Indonesian National Standard [1].
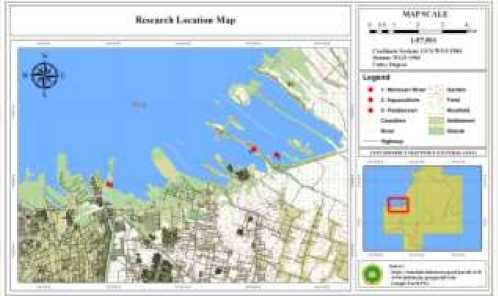
Figure 1. Research Locations
-
III. RESULTS AND DISCUSSION
The lowest content of heavy metal Cu in water was 0.0336 ± 0.07925 mg/l, which was found at station 1, while the highest value was found at 0.048 ± 0.007483 mg/kg, which was found at station 3. The lowest value of heavy metal content Cu was 0.024 mg/l which was the result of sampling on April 26, while the highest value was found of 0.055 mg/l, which was found on sampling on May 10, May 24 and June 7. The average yield of heavy metal Cu in water was 0.040333 ± 0.009947 mg/l. The content of heavy metal Pb based on research stations showed the highest results at station 1 with an average value of 0.0674 ± 0.011632 mg/l while the lowest value was found at station 2 with an average value of 0.0536 ± 0.012033 mg/l (Table I).
TABLE I
Pb metal content in water (mg/l)
|
Date |
Station 1 |
Station 2 |
Station 3 |
Averages |
|
April 26th |
0.066 |
0.049 |
0.058 |
0.057 |
|
May 10th |
0.072 |
0.059 |
0.042 |
0.057 |
|
May 24th |
0.083 |
0.071 |
0.089 |
0.081 |
|
June 7th |
0.065 |
0.05 |
0.069 |
0.061 |
|
June 21st |
0.051 |
0.039 |
0.044 |
0.044 |
|
Averages |
0.067 |
0.053 |
0.060 |
0.060 |
|
SD |
0.011 |
0.012 |
0.019 |
0.014 |
Meanwhile, the Cu content in water, based on the research station, showed the highest results at station 3 with an average value of 0.048 ± 0.007483 mg/l and the lowest value was found at station 1 with an average value of 0.0336 ± 0.07925 mg /l. The content of Pb and Cu metals in the water around the Morosari River Estuary, Aquaculture, and the Pandansari River Estuary, is suspected because it
comes from human activities on land. These wastes are the result of industrial wastes around the river estuaries, such as painting furniture, canning, the beverage industry, printing, which produce Pb and Cu metals from their waste.
Meanwhile, the Cu content in water, based on research stations, showed the highest results at station 3 with an average value of 0.048 ± 0.007483 mg/l and the lowest value was found at station 1 with an average value of 0.0336 ± 0.07925 mg /l. The content of Pb and Cu metals in the water in the water. The content of heavy metal Pb in water based on research stations showed the highest results at station 1 with an average value of 0.067 ± 0.011 mg/l while the lowest value was found at station 2 with an average value of 0.053 ± 0.012mg/l. The high Pb value at station 1 is thought to be due to human activities on land, results. This waste is the result of industrial waste, household waste and ports, namely as a transportation route. Meanwhile, the Cu content in water, based on research stations, showed the highest results at station 3 with an average value of 0.048 ± 0.007 mg/l and the lowest value was found at station 1 with an average value of 0.033 ± 0.079 mg/l (Table II). The highest Cu value at station 3 is suspected by waste disposal from passing fishing boats.
TABLE II
cu metal content in water (mg/l)
|
Date |
Station 1 |
Station 2 |
Station 3 |
Averages |
|
April 26th |
0.024 |
0.038 |
0.047 |
0.036 |
|
May 10th |
0.034 |
0.041 |
0.055 |
0.043 |
|
May 24th |
0.044 |
0.029 |
0.037 |
0.036 |
|
June 7th |
0.038 |
0.055 |
0.046 |
0.046 |
|
June 21st |
0.028 |
0.034 |
0.055 |
0.039 |
|
Averages |
0.033 |
0.039 |
0.048 |
0.040 |
|
SD |
0.007 |
0.009 |
0.007 |
0.009 |
The content of Pb and Cu metals in the water around the Morosari River Estuary, Aquaculture, and the Pandansari River Estuary, is thought to be caused by human activities on land. These wastes are the result of industrial waste, household waste and ports, namely places where fishing boats dock and as transportation routes. Many heavy metals Pb and Cu are produced from the activities of these ships. These heavy metals are also produced by industries around the river estuaries, such as furniture painting, canning, the beverage industry, printing, which produce Pb and Cu metals from their waste.
The heavy metal content which varies between the three stations is closely related to the water circulation system. At the mouth of the Morosari river, with conditions as an open estuary area and the beach tends to be marked with a sand bottom, water exchange occurs due to the entry of river water which contains heavy metals and sea water through tides. Meanwhile, the estuary of the Pandansari river is a semi-enclosed estuary area and is marked by the abundance of Avicennia sp. mangroves. and Rhizopora sp. Pond locations tend to be relatively closed areas, with an irrigation system that is carried out with ebb and flow circulation every 15–30 days. Under these conditions, Pb metal in water has a higher tendency at the Morosari and Pandansari stations. This is because Pb metal will always be dynamically dissolved and undergo continuous exchange, and experience accumulation, causing its content to be higher. Inorganic waste is non-
biodegradable so it cannot be broken down by microorganisms [8]. In the pond area, Pb metal will precipitate and demineralize on the bottom layer of the ponds. This resulted in the Pb metal content of the water being much lower. Heavy metals are also very difficult to degrade or dissolve in water or in sediments [12].
TABLE III
MEASUREMENT OF WATER QUALITY
|
Station |
Brightness (cm) |
Salinity Temperature |
DO (mg/l) |
Acidity (pH) | |
|
(ppm) |
(oC) | ||||
|
Station 1 |
63.17 |
April 26th 7.33 |
28.30 |
2.12 |
7.3 |
|
Station 2 |
29.67 |
32.67 |
29.63 |
2.56 |
7.6 |
|
Station 3 |
27.33 |
34.00 |
29.67 |
2.52 |
7.0 |
|
Station 1 |
63.12 |
May 10th 12.00 |
28.00 |
2.03 |
7.0 |
|
Station 2 |
29.67 |
31.67 |
28.20 |
2.46 |
7.3 |
|
Station 3 |
27.33 |
33.67 |
28.27 |
2.38 |
7.0 |
|
Station 1 |
63.83 |
May 24th 16.67 |
27.97 |
2.12 |
7.3 |
|
Station 2 |
75.33 |
31.00 |
28.70 |
3.18 |
7.6 |
|
Station 3 |
52.33 |
32.33 |
29.00 |
3.73 |
7.3 |
|
Station 1 |
72.00 |
June 7th 24.33 |
27.33 |
3.29 |
7.0 |
|
Station 2 |
67.67 |
32.67 |
27.80 |
3.39 |
7.6 |
|
Station 3 |
52.67 |
33.67 |
29.47 |
3.51 |
7.0 |
|
Station 1 |
63.00 |
June 21st 18.67 |
25.87 |
3.76 |
7.3 |
|
Station 2 |
55.30 |
33.67 |
26.90 |
4.32 |
7.6 |
|
Station 3 |
51.67 |
33.67 |
26.50 |
4.45 |
7.3 |
Cu metal at the Morosari station is much lower because the area is an open estuary area and the beach tends to be marked with a sand bottom, where water exchange occurs due to the entry of river water containing heavy metals and sea water through tides [4]. The exchange of water between these two sources causes a difference in density, and causes Cu metal to be deposited at the bottom of the waters and into the sediments. The same process was experienced by Cu metal at the Pandansari station which was related to the process of degradation of organic matter from mangrove litter [2] but because the process is carried out by bacteria, the heavy metals will still be released as ions and are in the waters, and some will accumulate in the bottom surface layer.
Thus the content of Cu metal in the pond station is part of the irrigation system between the two estuaries, because this station is located between the two estuaries. This resulted in the value of Cu metal in the aquaculture media water being at a value between the two estuaries.
In accordance with the opinion [13] states that the magnitude of the pollution load of a pollutant (heavy metal) that enters a water area is very dependent on activities that release pollutant compounds (heavy metals) in the water area. Dense population levels can support the high burden of incorporating pollutants (heavy metals) into waters. [14,3] thus the different levels of heavy metal content at the study sites are thought to be caused by differences in the background conditions of each study location which include the natural characteristics of an area, population levels and human activity.
Heavy metal toxicity in the aquatic environment has become a major concern because it has a high potential risk for aquatic biota, through the food chain, namely the process of bioaccumulation of sediment carried along the
food chain [11]. Several cases of pollution indicate the release of heavy metals originating from human activities is far greater than that produced through natural processes [7]. Naturally metal elements are found in the sea in very low quantities [5]. Thus it can be seen that sources of heavy metals originating from the sea have fewer amounts than those originating from industrial and household activities around the watershed. In addition, the cause of the river mouth has a fairly high heavy metal content because the river mouth is a place for materials carried by the water flow from the river to flow, so it is suspected that the material carrying heavy metal waste will gather in the river mouth and will experience mixing and dilution by seawater before it is carried by currents to the sea [10].
-
IV. CONCLUSION
Based on the results of research on the content of heavy metals Pb and Cu in water in the Estuary of the Morosari River (Demak), it can be concluded that: The content of Pb in water is 0.039-0.089 mg/l. The content of Cu in water is 0.024-0.055 mg/l in terms of heavy metal content in water in general, exceeding the park value of the quality standard limit allowed by the Ministry of Environment Number 51 of 2004.
ACKNOWLEDGMENT
The author would like to thank the Head of the Laboratory of the Faculty of Animal Husbandry, Marine and Fisheries, Undana, who has guided and provided facilities for conducting research.
REFERENCES
-
[1] [BSN] National Standardization Agency. Indonesian National Standard (SNI 01-2896-1992) ICS 67.040. About how to test metals in food. Jakarta.
-
[2] Mahasri, G., M.E. Eshmat, and B.S. Rahardja. 2014. Analysis of Lead (Pb) and Cadmium (Cd) Heavy Metal Content in Green Mussels (Perna viridis L.) in Ngemboh Waters, Gresik Regency, East Java. Fisheries and Maritime Scientific Journal, 6(1): 101-108.
-
[3] MENLH. 2004. Decree of the State Ministerfor the Environment. Number 51 of 2004. Regarding Guidelines for Seawater Quality Standards. Jakarta
-
[4] National Standardization Body. 2011.
Determination of Pb and Cu Heavy Metal Levels in live crab (Scylla serrata) for consumption. SNI. No. 4108.1:2011. National Standardization Body. Jakarta.
-
[5] Nugraha, W.A. 2009. Heavy Metal Content in Water and Sediments in Socah and Kwanyar Waters, Bangkalan Regency. Journal of Marine Science and Technology, 2(2): 158-164.
Advances in Tropical Biodiversity and Environmental Sciences 7(1): 36-39, February, 2023 e-ISSN:2622-0628
|
DOI: |
10.24843/ATBES.2023.v07.i01.p06 Available online at: https://ojs.unud.ac.id/index.php/ATBES/article/view/98487 39 | ||
|
[6] |
Palar, H. 1994. Heavy Metal Pollution and |
[12] |
Sarjono, A. 2009. Analysis of Heavy Metal Content |
|
[7] [8] [9] [10] [11] |
Toxicology. Publisher P.T. Rineka Cipta. Jakarta. 152 pp. Palar, H. 2008. Heavy Metal Pollution and Toxicology. PT. Rineka Cipta. Jakarta. 61-71 pp. Priyanto, N., D. Dwiyitno, and F. Ariyani. 2008. Heavy Metal Content (Hg, Pb, Cd, and Cu) in Fish, Water, and Sediment in Cirata Reservoir, West Java. Journal of Postharvest and Marine and Fishery Biotechnology 3(1): 69. Suryabrata, S. 1991. Research Methods. Eagle Press. Jakarta. 13 pages. Saraswati, S.A. and B.I. Lebrina. 2021. Pb and Cu Heavy Metal Content in Sediments in Morosari Demak Waters. Papadak Maritime Journal, April 2021 Edition, Volume 2 Number 1. Saraswati, S.A., E.W. Suryaningtyas, and N.P.P. Wijayanti. 2022. Heavy Metal Content of Pb and Cu in Wideng Crab (Episesarma sp.) in Morosari Water Demak Region. Adv in Tropical Biodiversity and Environmental Sciences 6(1): 13-16. |
[13] [14] [15] |
of Hg, Pb and Cu in Water and Body Tissue of Green Mussels (Perna viridis) in Kamal Muara, North Jakarta. Department of Water Resources Management. Faculty of Fisheries and Marine Science IPB. Bogor. Setiawan, H. and E. Subiandono. 2015. Concentration of Heavy Metals in Water and Sediments in Coastal Waters of South Sulawesi Province. Indonesian Forest Rehabilitation 3(1): 67-79. Viswanathan, C., A.R. Ramakrishnan, M. Selvanayagam and S. Raffi. 2013. Heavy Metal Levels in Different Tissues of the Blue Swimming Crab (Portunus pelagicus, Portunidae) Collected from Ennore Estuary. International Journal of Research in Fisheries and Aquaculture 3(1): 1-6. Widowati, W. 2008. Toxic Effects of Metals in Prevention and Management Pollution. Yogyakarta: Publisher Andi. |
Discussion and feedback