A Comparison of Eucheuma cottonii Seaweed Cultivation in Monoculture and Polyculture Systems
on

Advances in Tropical Biodiversity and
Environmental Sciences
6(1): 17-21, February, 2022
e-ISSN:2622-0628
DOI: 10.24843/ATBES.2022.v06.i01.p04
Available online at: https://ojs.unud.ac.id/index.php/ATBES/article/view/76396
A Comparison of Eucheuma cottonii Seaweed Cultivation in Monoculture and Polyculture Systems in Coastal Area of Pandawa Beach, Bali
Putri Febrine Nainggolan*, I Wayan Arthana, and Ayu Putu Wiweka Krisna Dewi
Department of Aquatic Resources Management, Faculty of Marine and Fisheries, Udayana University
Jl. Kampus Unud Bukit Jimbaran, Kuta SelatanBadung, Bali *Corresponding author: febrinainggolan99@gmail.com
Abstract. Seaweed is a commodity that has high economic value and benefits. The implementation of seaweed cultivation is quite short and the export market opportunities are wide open because the need for seaweed is quite large. This study aimed to determine the growth rate of seaweed with monoculture and polyculture cultivation systems and the survival rate of abalone in polyculture cultivation. The research used an experimental method with Completely Randomized Design (CRD) consisting of two treatments and three replications. The cultivation system in this study was seaweed monoculture Eucheuma cottonii with an initial weight of 100 g and 100 g seaweed polyculture with abalone Haliotis squamata, each polyculture culture net bag containing 50 abalones. The value of the specific growth rate of monoculture seaweed was 2.21%/day, lower than the specific growth rate of polyculture, which was 3.61%/day. T-test analysis showed the value of sig was 0.049≤0.05, which means that there was a significant difference between the treatment of monoculture cultivation and polyculture cultivation. The abalone growth rate value ranged from 0.78-0.91%/day and the abalone survival rate ranged from 68-76%. Changes in environmental conditions affected the condition of abalone and seaweed, so that the survival value of abalone was quite low and seaweed was infected with ice-ice disease which caused a decrease in seaweed weight gain in the final week of the study period.
Keywords: abalone; cultivation; monoculture; polyculture; seaweed
-
I. INTRODUCTION
Seaweed is a plant that has benefits and high economic value, besides that it also has a role in changing dissolved inorganic nutrients from waste disposal of coastal and pond aquaculture systems [1]. The demand for seaweeds can be met by paying attention to the success in its production. This success can be achieved by optimizing several factors, including the selection of the right cultivation location, the use of good quality species, appropriate cultivation techniques or methods, as well as harvesting and post-harvesting [2].
Seaweed cultivation has several planting methods including the bottom method, namely planting seaweed on the bottom of the water, this method is simple with relatively low cost. Then the off-bottom method is the planting of seaweed in a body of water. This method uses stakes connected by ropes containing seaweed seeds
. Furthermore, the floating method is a method that is almost the same as the off-base method but with the planting position at sea level so that this method requires a lot of buoys [3]. In addition to the selection of planting methods, there are also maintenance methods including monoculture and polyculture cultivation. Monoculture is a cultivation method with the maintenance of one type of commodity while polyculture is a method of maintaining cultivated commodities using more than one species that are mutually beneficial. Polycultural cultivation systems can increase land use efficiency and farmers' incomes, so this cultivation system really needs to be developed [4].
Further research is needed on the growth rate of seaweed and abalone with monoculture and polyculture cultivation systems using the off-base method, namely planting using boxes modified with nets, so that by utilizing the space in the box and higher stocking densities it can be seen that
seaweed and abalone can be well integrated and the use of cultivation space is more effective.
-
II. RESEARCH METHOD
Experimental Set Up
This research was carried out from April to May 2021 with an estimated time of 6 weeks for the research period. This study took place at Pandawa Beach, which was located in Kutuh Village, Badung, Bali. This research was conducted using an experimental method with a completely randomized design (CRD) consisting of two treatments and three replications. Eucheuma cottonii was cultivated polyculture along with abalone Haliotis Squamata, polyculture cultivation net bags each containing 50 abalone. The description of variations in the treatment of Eucheuma cottonii and abalone Haliotis squamata is as follows:
A = Seaweed as control (100 g)
B = Seaweed (100 g) + abalone (50 animals)
Materials
The materials used in this study consisting tools for measuring water quality, measurement of weight gain of seaweed and abalone and tools for the construction of planting media, namely DO meters, pH meters, thermometers, refractometers, digital scales, paralon pipes, pipe connections and stakes.
Planting Media Construction
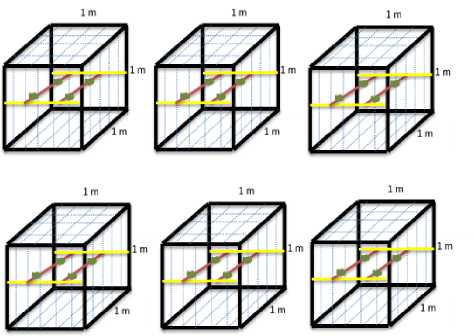
The cultivation of monoculture and polyculture seaweeds was carried out using the off-bottom method using a net bag which was then modified to become a net box.

Figure 1. Cultivation Design of Monoculture and Polyculture system
The monoculture construction contains controlled seaweed seeds without being integrated with abalone, while the polyculture cultivation construction was designed so that the seaweed was on top and the abalone
was at the bottom so that the seaweed can integrate with the abalone in one net bag [5]. The box used was 1x1x1 m and the rope used was 1 meter. Planting was done with the distance between the seaweed seedlings on the ris rope of about 20 cm and the distance between the ropes of one ris with the other ris rope of about 50 cm. However, in the polyculture cultivation box, at the bottom of the seaweed there was abalone with a stocking density of 50 individuals. The distance between cultivated seaweed and abalone was 50 cm.
Data Analysis
The data that has been taken during the research period includes data on the weight of seaweed and the number of abalone at the beginning and end of the study, which will then be analyzed using the formula for the specific growth rate of seaweed and the survival rate of abalone. Observations of seaweed were carried out once a week and the amount of abalone was observed until the end of the study period. The condition of the waters was checked and data were taken 3 times during the research period. Observations of water conditions including parameters of temperature, salinity, pH were carried out in situ and nitrate, phosphate and dissolved oxygen (DO) ex situ at the Analytical Laboratory, Udayana University.
The specific growth rate of seaweed and abalone [6] was calculated using the formula:
(Lrι Wt - Ln Wo)
SGR =--------------
× 100%
t
SGR is the Specific Growth Rate / average specific growth rate (%), Wt is the weight at time t day/end (gr), Wo is the initial weight at 0 days/beginning (gr) and t is the length of planting (days)
Abalone survival [7] was calculated using the formula:
SR = ^x 100% No
SR is Survival Rate/ abalone survival rate (%), No is the number of abalone at the beginning of the study (tails) and Nt is the number of abalone mussels at the end of the study The. SGR data of seaweed and abalone SR were analyzed using statistical tests. The statistical test used in this study was the T-test. The data that has been collected during the research period will be tested to determine whether the data are normally distributed and affect growth by testing for normality, homogeneity, and additivity. If the data obtained are normal, it can be continued with hypothesis testing (T-test). T-test is a comparison of two groups of data samples. The assumptions used are data variables that are normally distributed and the homogeneity of variance between data groups. Data analysis was processed using SPSS with a significance level of 95% (α = 0.05) [8].
-
III. RESULT AND DISCUSSION
Growth and physical condition of seaweed
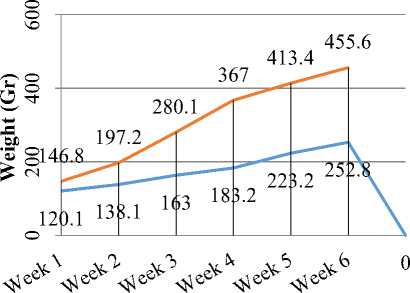
The final weight of seaweed in the polyculture treatment whichwasintegratedwith50abaloneswasgreaterthanthe seaweed in the monoculture treatment. The highest weight gain occurred in the 4th week of the study period, which was 86 g/week, while monoculture-cultivated seaweed experienced ups and downs in weight gain with the highest weight gain occurring in the 5th week, which was 39 g/week. However, in the last week of the research period, the weight gains of seaweed decreased.
^^^^^^^^M A treatment ^^^^^^^^M B treatment

Period
Figure 2. Seaweed Growth Rate
This occurs when the seaweed has reached its maximum growth phase and there is a disease infection ice-ice in the seaweed. According to Yusran et al., [9] seaweed continued to gain weight, although the percentage growth rate of Eucheuma cottonii decreased. The low growth rate on the 30th and 40th day observations was thought to be because the seaweed has reached harvest time or in other words, its growth rate will no longer increase. The results of Harapan's research [10] showed that the weight of seaweed in the 6th week decreased by about 13 g compared to the weight at the 5th week, this indicated a decrease in the growth rate of seaweed at the 6th week of the study period. The growth rate of seaweed is divided into 2, namely internal and external. Internal factors include type, part of thallus and age, while external factors include physical and chemical conditions in the environment. In the 6th week, namely the harvest period, the weight of the seaweed decreased, presumably due to the large number of seaweed parts that fell off due to infection which was thought to be from bacteria that often attack seaweed and cause ice-ice disease. Ice-ice disease attacks when the resistance of seaweed decreases, this condition occurs when there is an intolerable environmental change so that the seaweed becomes vulnerable.
This disease attack occurs when seaweed is infected in cuts (cuttings for seedlings), fish bite wounds or wounds due to bonding the seeds too tightly. According to Amiludin [11] seaweed will be infected more quickly if there are many scars because it will become an entrance for pathogenic bacteria. From the results of research by Arisandi [12], it was found that the bacteria isolated from E. cottonii were also found in seawater, indicating that the bacteria present in seawater infected injured E. cottonii.
The Specific growth rate (SGR) of seaweed
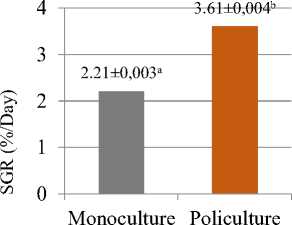
Specific growth rate (SGR) of monoculture cultured seaweed was lower than that of polyculture cultured treatment. SGR of monoculture cultured seaweed was 2.21%/day and polyculture cultivation was 3.61%/day. The difference in the observation of the growth rate of this seaweed, was obtained because of the difference in cultivation treatment between monoculture and polyculture with 50 abalones. Seaweed that was integrated with abalone has an advantage because abalone and seaweed can help each other in the utilization of nutrients and reduce the problem of accumulation of organic matter from cultivation activities. Based on the results of Setiawati's research [13], it was known that cultivation activities cause the organic matter content in the sediment to increase, this was because the cultivation process produces organic waste resulting from the accumulation of feed residues and metabolism. In this case, abalone organisms play a role in filtering particulate organic matter, while those that play a role in filtering dissolved inorganic nutrients are seaweed, and deposit feeders used to decompose organic matter in sediments are decomposer organisms available in nature.

■ Monoculture
■ Policulture
Treatment
Figure 3. Spesific Growth Rate of seaweed
The SGR value in this study was lower than the results of Breanita's research [15] on seaweed with SGR values ranging from 3.42-4%/day at abalone densities of 10 and 30 individuals. Ice-ice disease attack affects the low SGR value of cultured seaweed and was thought to be one of the causes of the difference between the results of this study and previous studies, as explained by Yulianto [16] the
infection of ice-ice was the cause of negative growth in E. cottonii due to a lot of loss. weight. The negative growth in seaweed was thought to be because the tissue in the thallus Eucheuma cottonii did not function properly in carrying out photosynthesis.
The results of the statistical analysis of seaweed weights in monoculture and polyculture, showed that the value of sig was 0.049 ≤ 0.05, which means that there was a significant difference between the treatments of monoculture and polyculture cultivation.
The Specific growth rate (SGR) of abalone
The highest specific growth rate of abalone was 0.91%/day with a final weight of 3,4 g then 0.85%/day with a final weight of 2,97 g and the lowest was 0.78%/day with final weight 3 g. The growth of abalone can be influenced by changes in environmental conditions and the stocking density of abalone. According to Hayati [17], the decreasing number of abalone shellfish in the rearing container caused the competition for feed to be reduced, so that the stocking density affected the feed requirements of abalone shellfish. The results of Gultom's research [18] on the coast of Geger Bali stated that the specific growth rate of E.cottonii seaweed in the IMTA system ranged from 0.72-0.60%/day. When compared with the SGR value in this study, which ranged from 0.78-0.91%/day, the abalone SGR value in this study was quite high. The difference in the number of stocking densities and environmental conditions is one of the causes of the difference between the results of the SGR value of this study and previous studies.
The abalone survival rate (SR) of abalone
The average of abalone survival rate was 72.7%. The survival value of abalone in this study was lower than that of Breanita [15] in Pandawa Beach with abalone densities of 10 and 30 individuals with an average abalone survival value of 96%. Followed by a decrease in weight gain in polyculture cultivated seaweed. According to Rusdi et al., [19] the maintenance of abalone seeds was strongly influenced by the environment so that it has an impact on differences in abalone growth. Abalone was also a susceptible and sensitive organism; this was in accordance with the statement of Hayati [17] where growth observations made every two weeks can cause stress to abalone shells. During sampling the weight growth of abalone shellfish, extra care was needed because abalone shells are very sensitive to friction.
Water Quality Measurement
From the measurement results, it can be seen that the water temperature at the beginning of the study was 29°C and then increased to 31°C at the end of the week. The pH values during the study ranged from 7-7.4, salinity values
ranged from 30.4-31.2 ppt and DO values ranged from 5.36.5 ppm. Measurements of nitrate and phosphate were carried out at the 1st, 4th and 6th week of the study period. Measurements of nitrate and phosphate have an average value of 1.25 and 0.44 mg/L, respectively (Table 1).
-
IV. CONCLUSION
Monoculture and polyculture cultivation systems have different effects on the growth rate of seaweed. The growth rate in polyculture treatment was higher at 3.61%/day compared to monoculture treatment at 2.21%/day and the average abalone survival rate was 72.7%, with an average weight of abalone 3 ± 0,03 gr. Seaweed is best planted at the beginning of the west season, where the condition of the water quality and the movement of the waves is quite good and avoids the season of pest attacks such as baronang fish which can reduce seaweed yields.
ACKNOWLEDGMENT
The author gratitude goes to the supervisors and parties who have helped complete this research, as well as to the management of Pandawa Beach for their contribution to this research.
REFERENCES
-
[1] Wong, K.H. and P.C. Cheung 2000. Nutritional evaluation of some subtropical red dan green seaweeds I. proximate composition, amino acid profiles and some physico-chemical properties. Food Chemistry., 71: 475- 482.
-
[2] Serdiati, N. dan I.M. Widiastuti. 2010. Pertumbuhan dan Produksi Rumput Laut Euchema cottonii pada Kedalaman yang Berbeda. Media Litbang Sulteng. 3(1) 21-26.
-
[3] Kementerian Pendidikan dan Kebudayaan, Direktorat Pembinaan Sekolah Menengah Kejuruan. 2013. Teknik Penanaman Rumput Laut. Buku Teks Bahan Ajar Siswa.
-
[4] Ranoemihardjo, B.S., A. Kahar, J.V.Lopez. 1979. Results of polyculture of milkfish and shrimp at the Karanganyar provincial demonstration ponds. Bulletin of Brackishwater Aquaculture Development Center, 5(1-2): 334-350.
-
[5] Dewi, A.P.W.K. dan N.M. Ernawati. 2019. Peningkatan Produktivitas Rumput Laut
Menggunakan Sistem Kantong di Perairan Pantai Kutuh, Badung, Bali. Laporan Penelitian. Universitas Udayana. Bali.
-
[6] Muchlisin, Z.A., M. Nazir, N. Fadli and M. Adlim. 2017. Growth performance, protein and lipid retentions on the carcass of Acehnese mahseer, Tor tambra (Pisces: Cyprinidae) fed commercial diet at
different levels of protein. Iranian Journal of Fisheries Science, 16(2): 557-566.
-
[7] Yustianti, Y., M. Ibrahim and N. Ruslaini. 2013. Pertumbuhan dan Sintasan Larva Udang Vaname (Litopenaeus vannamei) Melalui Substitusi Tepung Ikan dengan Tepung Usus Ayam. Jurnal Mina Laut Indonesia, 1(1), 93-103.
-
[8] Yamin, S. dan H. Kurniawan. 2011. Generasi Baru Mengolah Data Penelitian dengan Partial Least Square Path Modeling: Aplikasi dengan Software XLSTAT, SmartPLS, dan Visual PLS. Salemba Infotek. Jakarta.
-
[9] Yusran, H. Tribuana dan Marhayana. 2021. Laju Pertumbuhan Rumput Laut dengan Bobot Bibit Berbeda Menggunakan Jaring Trawl dan Long Line. Fisheries of Wallace Journal. 2(1):10-19.
-
[10] Harapan, S.B.S. 2019. Performansi Pertumbuhan Rumput Laut (Kappaphycus alvarezii) dengan
Menggunakan Bibit Hasil Kultur dan Non Kultur Jaringan di BBPBL, Lampung. Jurnal Kelautan dan Perikanan Terapan. 2(2): 93-99.
-
[11] Amiluddin, N. M. 2007. Kajian Pertumbuhan dan Kandungan Karaginan Rumput Laut Kappaphycus alvarezii yang Terkena Penyakit Ice-ice Di Perairan Pulau Pari Kepulauan Seribu. [Tesis]. Bogor: IPB.
-
[12] Arisandi, A., A. Farid dan E.A. Wahyuni. 2013. Dampak Infeksi Ice-ice dan Epifit Terdahap Pertumbuhan Eucheuma cottonii. Indonesian Journal of Marine Sciences 18(1): 1-6.
-
[13] Setiawati, I.A. 2019. Kandungan Bahan Organik di Sedimen Pada Budidaya Abalon Haliotis squamata dengan Sistem Co-culture di Pantai Geger. Journal of Marine Research and Technology 2(2): 1-6.
-
[14] Chopin,T. 2006. Integrated multi-trophic aquaculture. What it is, and why you should care and dont confuse it with polyculture. Northern Aquaculture 12(4): 542564.
-
[15] Breanita, Y., N.L. Watiniasih dan A.P.W.K. Dewi. 2020. Seaweed Growth Rate (Eucheuma cottonii) in Monoculture and Co-Culture Cultivation Systems in Coastal area of Pandawa Beach, Bali. Advances in Tropical Biodiversity and Environmental Sciences 4(2): 53-57.
-
[16] Yulianto, K. dan S. Mira. 2009. Budidaya Makroalga K. alvarezii (Doty) secara Vertikal dengan Gejala Penyakit IceIce di Perairan Pulau Pari. Loka Pengembangan Kompetensi SDM Oseanografi Pulau Pari-LIPI. 334 hal.
-
[17] Hayati, H. 2018. Laju Pertumbuhan Kerang Abalon Haliotis squamata Melalui Budidaya IMTA (Integrated Multi Trophic Aquaculture) di Pantai Geger, Nusa Dua, Kabupaten Badung, Provinsi Bali. Journal of Marine and Aquatic Sciences 4(2): 253262.
-
[18] Gultom, R.C. 2019. Perbandingan laju pertumbuhan rumput laut (Euchema cottoni) dengan menggunakan sistem budidaya co-culture dan Monoculture di Perairan pantai Geger, Nusa Dua, Bali. Journal of Marine Research and Technology 2(1): 8-12.
-
[19] Rusdi, I., B. Susanto, R. Rahmawati, and I.N.A Giri. 2011. Technical guide for seedling of Abalone (Haliotis squamata). Gondol Research Institute for Mariculture. Agency for Marine and Fisheries Research and Development. pp. 33.
TABEL 1
WATER QUALITY PARAMETER
|
Measurement Result Per Week |
Average |
Standard Deviation | |||||||
|
0 |
1 |
2 |
3 |
4 |
5 |
6 | |||
|
Temperature(oC) |
29 |
29 |
30 |
30 |
31 |
30 |
31 |
30 |
0,8 |
|
pH |
7 |
7 |
7.1 |
7.3 |
7.4 |
7.1 |
7.5 |
7.2 |
0,2 |
|
Salinity (ppt) |
31 |
31.6 |
30.4 |
31 |
30.8 |
31.2 |
31 |
30.8 |
0.4 |
|
DO (ppm) |
6.5 |
6 |
5.9 |
5.5 |
5.3 |
5.8 |
5.5 |
5.8 |
0,4 |
|
Nitrate (mg/L) |
0.9 |
1.4 |
1.3 |
1.25 |
0.25 | ||||
|
Phosphate (mg/L) |
0.24 |
0.72 |
0.38 |
0.44 |
0.2 | ||||
Discussion and feedback