Percentage of Mangrove Canopy Cover and Mollusks Abundance in Benoa Bay Mangrove Ecosystem
on
Advances in Tropical Biodiversity and Environmental Sciences 5(3): 97-102, October, 2021 e-ISSN:2622-0628
DOI: 10.24843/ATBES.v05.i03.p05 Available online at: https://ojs.unud.ac.id/index.php/ATBES/article/view/74422
97
Percentage of Mangrove Canopy Cover and Mollusks Abundance in Benoa Bay Mangrove Ecosystem
Shintani Asri Tinambunan1, Nyoman Dati Pertami 2, and Ni Made Ernawati3
Department of Aquatic Resources Management, Faculty of Marine and Fisheries, Udayana University Jl. Kampus Unud Bukit Jimbaran, Kuta Selatan, Badung, Bali
*Corresponding author: shintaniasri@gmail.com
Abstract. This research was conducted to determine the condition of the mangrove ecosystem based on its canopy cover and to determine the types of mollusks (Bivalves and Gastropods) associated with the Benoa Bay mangrove ecosystem. Research on the percentage of mangrove canopy cover is important because it can be used as an indicator in evaluating the growth or damage that exists in the mangrove ecosystem. Research on the abundance of mollusks is important because mollusks have an important role in the function and ecology of the mangrove ecosystem and play a role in the food chain cycle. Hemispherical photography is a method for observing mangrove canopy cover and line transect method for mollusks. The composition of mangrove species found in the research location were five species, namely Rhizophora stylosa, Rhizophora mucronata, Rhizophora apiculata, Bruguiera gymnorrhiza, and Avicennia marina. The percentage of mangrove canopy cover in the Benoa Bay mangrove ecosystem is in a good category (average = 76.59%). There are eight types of mollusks found in the research location consisted of two types of bivalves (Polymesoda bengalensis and Gafrarium pectinatum) and six types of gastropods (Nerita balteata, Nerita picea, Neritina turrita, Pila ampullacea, Cassidula aurisfelis, and Littoraria melanostoma). The relationship between the percentage of mangrove canopy cover and abundance of mollusks in the Benoa Bay mangrove ecosystem has a very low correlation with the correlation value (r = -0.348). The percentage value of mangrove canopy cover did not have a major influence on the abundance of mollusks in the mangrove of Benoa Bay.
Keywords: Benoa Bay; mangrove canopy cover; mollusks.
-
I. INTRODUCTION
Mangroves are plants that grow influenced by tides and are found along tropical beaches. According to Kusuma (2015). Good mangrove will support the growth and development of associated biota, so it is necessary to protect and supervise the mangrove area so that the mangrove ecosystem is maintained and runs well. One of the areas in Bali Province that has a fairly extensive mangrove is Benoa Bay. Benoa Bay is one of the centers of biodiversity at the ecosystem level in the coastal area of South Bali.
Research on the percentage of mangrove canopy cover is important because it can be used as an indicator in evaluating the growth or damage that exists in the mangrove ecosystem. In the mangrove ecosystem, there are several associated biotas, namely mollusks (gastropods and bivalves). Mollusks have many benefits, namely one of the sources of protein that can be consumed by the community, animal feed ingredients, industrial materials and for medicines (Dibyowati, 2009).
Several studies have been conducted to determine the abundance of mollusks (gastropods and bivalves) in the mangrove ecosystem of the Musi river estuary, Banyuasin
regency, South Sumatera province (Hartoni and Agussalim, 2013) and in the mangrove ecosystem of Gampong Ie Masen, Muara Tiga District,Pidie regency (Ikramullah et al., 2017). Knowing the abundance of mollusks and the relationship between the percentage of mangrove canopy cover is essential as information and is the first step for the Benoa Bay community to manage the abundance of mollusks which have many functions and ecological roles in the mangrove ecosystem.
-
II. RESEARCH METHOD
Time and Location of the Research
The research was conducted in February 2021 in the mangrove ecosystem of Benoa Bay, Bali. The location of the study was carried out in three stations (Figure1). Station 1 is in the mangrove area around the reservoir (Suwung DAM estuary), station 2 is in the MIC mangrove tourist attraction area and station 3 is between Tukad Mati downstream and Jalan By Pass Ngurah Rai Tuban. Each observation stasiun is expected to represent the mangrove ecosystem of Benoa Bay. The reason for choosing this stasiun is because the mangrove at the location are thick and access to the location is safe.
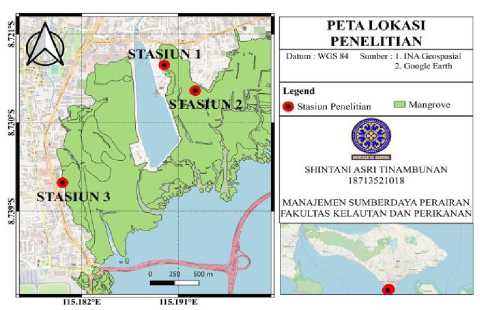
Figure 1. Map of Sampling Location
Tools and Materials
Tools and materials used in the study can be seen in
-
TABLE 1 below:
TABLE 1
TOOLS AND MATERIALS RESEARCH
|
No |
Tools and Materials |
Uses |
|
1 |
GPS (Global Positioning System) |
Determines the position of coordinates at the research location |
|
2 |
Raffia rope |
Makes station line transects |
|
3 |
Meter |
Measuring transect length |
|
4 |
Stationery |
Recording the data found |
|
5 |
Plastic bag |
Sampel container for biota |
|
6 |
Label paper |
Information for biota |
|
7 |
Alcohol 70 % |
Sample preservative |
|
8 |
Biota identification book |
Identifying biota |
|
9 |
Camera |
Research documentation media |
|
10 |
Filter |
Searching for biota |
|
11 |
Ms. Excel |
Processing data |
Determination of Sampling Points
The determination of sampling points (three stations) was carried out using the purposive sampling method. Purposive sampling is a sampling method used by conducting considerations or studies first. Each station consists of 3 plots with a size of 10 mx 10 m for mangrove data collection and 3 plots with a size of 1 mx 1 m were selected for mollusks data collection as representatives of mollusks data collection at each station. Observation stations are placed in areas that are not flooded or carried out at low tide.
Data Collection Methods
-
A. Collecting Mangrove Cover Percentage Data
The method used in collecting data on the percentage of mangrove cover was hemispherical photography and using a camera (Jenning et al., 1999; Korhonen et al., 2006). Furthermore, the method of taking pictures and determining the sampling location followed the guidelines in Dharmawan and Pramudji (2014). The technical implementation is:
-
1. Data collection was done using a camera and taking photos is done by being directed perpendicular to the sky. Avoid shooting right next to the trunk of a tree and position the camera at chest height.
-
2. Each 10 × 10 m plot is divided into four small plots of 5 × 5 m in size.
-
3. There are 4 shooting points on each 10m × 10m plot.
-
4. The photo number is recorded on the datasheet form to facilitate data analysis.
-
5. Photographs were taken once at each point to prevent confusion in data analysis.
-
B. Mollusks Data Collection
The collection was carried out using a plot of 1 m × 1m in an area of 10 m ×10 m. Mollusks samples taken were mollusks present in the roots and substrate of mangroves. Data retrieval was carried out at 3 points with the mollusks taking the position, namely the left corner, right corner, and center. Biota collection is carried out directly by hand (hand collecting), then the biota is inserted into a container and labeled with a marker for easy identification. The mollusks was preserved using 70% alcohol and then identified. The mollusks found were then recorded based on the number of individuals and species found at each station.
-
C. Substrate Sampling
Observation of the type of substrate was done visually (directly) by feeling the texture of the substrate at each station. Then the samples were grouped per station to facilitate data analysis. The types of substrates encountered were mud, sand, and sandy silt.
Data Analysis
-
A. Mangrove Cover Percentage
The Concept of this analysis is the separation of sky pixels (white color) and vegetation cover (black color) so that the percentage of mangrove vegetation cover pixels can be calculated in binary image analysis (Ishida 2004, Chianucci et al., 2014). Photo analysis using software ImageJ and Microsoft Excel to calculate the percentage of cover. Determination of the level of damage to mangroves is determined based on the regulation of the Ministry of Environment no. 201 of 2004. The standard criteria for mangrove damage can be seen in TABLE 2.
TABLE 2
composition of mangrove species in the Benoa Bay ecosystem can be seen in Figure 2.
CRITERIA FOR MANGROVE DAMAGE
|
Criteria |
Closure (%) |
|
Good Very Tight |
>75 |
|
Tight |
≥50 - <75 |
|
Damage Rarely |
<50 |
-
B. Mollusks Abundance
Mollusks Individual abundance refers to the abundance formula, namely:
KI (ind/m2) = ni
Information:
KI = Species abundance (ind/m2)
Ni = Number of species species I (ind)
A = Area of observation (m2)
-
C. Relationship between Percentage of Mangrove Canopy
Cover and Mollusks Abundance
Data analysis of the relationship between percentage of mangrove canopy cover and mollusk abundance can be determined using a simple regression model with the formula:
Y = a + bx
Description:
Y = Percentage of Mangrove Canopy Cover
X = Mollusc Abundance
a = Constant
b = Slope
TABLE 3
INTERVAL OF CORREALTION AND LEVEL OF
RELATION BETWEEN FACTORS
|
No |
Interval Coefficient |
Level of Relationship |
|
1 |
0,00 – 0,199 |
Very Low |
|
2 |
0,20 – 0,399 |
Low |
|
3 |
0,40 – 0,599 |
Moderate |
|
4 |
0,60 – 0,799 |
Strong |
|
5 |
0,80 – 1,000 |
Very Strong |
III RESULT AND DISCUSSION
-
3.1 Composition of Mangrove
Species the types of mangroves found during the study were Rhizophora stylosa, Rhizophora mucronata, Rhizophora apiculata, Bruguiera gymnorrhiza and Avicennia marina. The results of the calculation of the
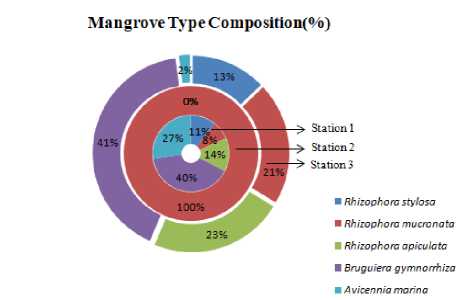
Figure 2. Composition of Mangrove Species
At station 1 and station 3, there were 5 similar types of mangrove, namely Rhizophora stylosa, Rhizophora Mucronata, Rhizophora Apiculata, Bruguiera gymnorrhiza and Avicennia marina. The dominant mangrove species at stations 1 and 3 were the same, namely Bruguiera gymnorrhiza, while at station 2 only Rhizophora mucronata was found. The most dominant type of mangrove found based on the results of the analysis in this study was Rhizophora mucronata. This can be related to the adaptation of habitat conditions that affect the carrying capacity of the community. According to Sani et al., (2019) that Rhizophora spp has fairly good adaptability so that this species easily lives in each area of different environmental types. Agustini et al., (2016) stated that there are four true or dominant plant families in the mangrove ecosystem, namely Rhizophoraceae (Bruguiera, Rhizophora, and Ceriops), Sonneratiaceae (Sonneratia), Avicenniaceae (Avicennia), and Meliaceae (Xylocarpus). Differences in environmental conditions can affect the growing mangrove species.
Percentage of Mangrove Canopy Cover
The percentage value of mangrove canopy cover at the three stations is in the good category according to KEPMEN LH No. 201 of 2004. The results of the percentage of mangrove canopy cover and the condition of the mangrove community in the mangrove ecosystem of Benoa Bay can be seen in TABLE 4.
Nurdiansah and Dharmawan (2018) say that a good percentage of mangrove canopy cover is supported by the value of tree density and suitable environmental conditions can be a factor in a high percentage value. This is supported by the statement of Baksir et al., (2018) that the high percentage value of mangroves is caused by environmental conditions that are suitable for mangrove growth, and low anthropogenic activity in the mangrove
ecosystem will cause the mangrove community to grow densely.
TABLE 4
|
PERCENTAGE OF MANGROVE COVER AND MANGROVE CONDITION | |||
|
Station |
Dominant Type |
Cover Mangrove (%) |
Status |
|
1 |
Bruguiera gymnorrhiza |
78,36 |
Good |
|
2 |
Rhizophora Mucronata |
74,14 |
Good |
|
3 |
Bruguiera gymnorrhiza |
77,28 |
Good |
|
Rata-Rata |
76,59 |
Good | |
Abundance of Mollusks
-
A. Abundance of Bivalves
The results of research and identification that have been carried out in the mangrove ecosystem of Benoa Bay, there are 2 species of bivalves, namely Polymesoda bengalensis and Gafrarium pectinatum. The highest species abundance was found at station 1, which was 0.19 ind/m 2. Then at station 2 is 0.08 ind / m2 and the station 3 is 0:03 ind / m2.
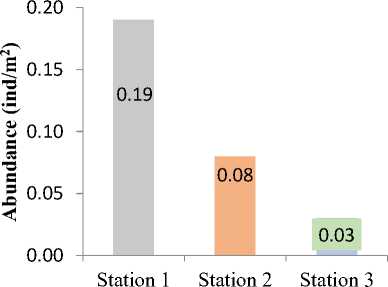
Figure 3. Abundance of Bivalves
The highest abundance of bivalves was found at station 1, this is supported by the higher percentage value of mangrove canopy cover at station 1, namely 78.36%. According to Putri (2021) that if the mangrove density is high, the presence of bivalves in the ecosystem is high, but the difference in the value of bivalves density at each station is also caused by the non-selective catching factor of bivalves by the surrounding community. Then Arbi (2012) states that the high and low value of the uniformity index of a species is caused by several factors, namely the number of species or species obtained, the number of individuals obtained exceeds the number of other
individuals, then the homogeneity of the substrate and habitat conditions in the ecosystem.
-
B. Abundance of Gastropod
There were six spesies of gatropods found, namely Nerita balteata, Nerita picea, Neritina turrita, Pila ampullacea, Cassidula aurisfelis and Littoraria melanostoma. The highest abundance of gastropods was found at station 1 which was 121 ind/m2, while the lowest abundance value was found at station 2 which was 0.50 ind/m2 and at station 3 which was 0.89 ind/m2.
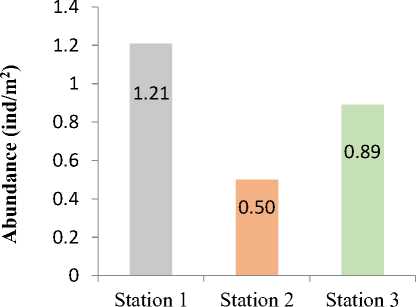
-
Figure 4. Abundance of Gastropods
According to Kusrini (2000), gastropod species are generally more commonly found in mangrove ecosystems with species Avicennia marina, Rhizophora mucronata, and Rhizophora stylosa. This can be related to the number of gastropods found in each station. At station 3, only 1 mangrove species was found, namely Rhizophora mucronata, so it is suspected that this affected the number of gastropods found to be less than at stations 1 and 3. Riniatsih and Wibowo (2009) stated that Neritidae is a biota that prefers a slightly muddy sand substrate in tidal areas, but at the time of the study, the type of substrate obtained was muddy.
Correlation of Percentage of Mangrove Canopy Cover with Mollusc Abundance in Benoa Bay Mangrove Ecosystem
The correlation value (r) of the relationship between the percentage of mangrove canopy cover and abundance of mollusks in the mangrove ecosystem of Benoa Bay is very low, which means that the percentage of mangrove canopy cover does not have a major influence on the abundance of mollusks in the Benoa Bay mangrove ecosystem.
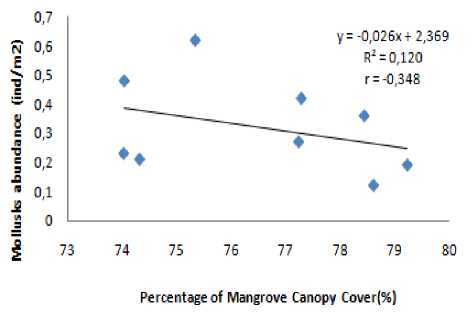
Figure 5. Relationship between Percentage of Mangrove Canopy Cover with Mollusks Abundance in the Mangrove Ecosystem of Benoa Bay
The abundance of mollusks in the mangrove ecosystem of Benoa Bay is thought to be influenced by several factors, namely food availability, predation and competition between species. In the study of mangrove density and gastropod abundance in the mangrove and proboscis monkey conservation are (KKMB) OF Tarakan city (Gazali et al., 2019) that the correlation value obtained was 0,4766 including a suffivient correlation. The abundance of gastropods at the study site was influenced by other variables such as sediment, organic matter and the abailability of sunlight.
-
IV. CONCLUSION
The percentage of mangrove canopy cover in the Benoa Bay mangrove ecosystem is in good category with an average value of 76.59%. Mollusks found in mangrove ecosystem of Benoa Bay consisted of eight species from two classes, namely the bivalves class consisting of two species, namely Polymesoda bengalensis and Gafrarium pectinatum, and the gastropod class consisting of six species, namely Nerita balteata, Nerita picea, Neritina turrita, Pila ampullacea, Cassidula aurisfelis, and Littoraria melanostoma. The relationship between the percentage of mangrove canopy cover and the abundance of mollusks in the Benoa Bay mangrove ecosystem has a very low correlation (r = -0.348). The percentage value of mangrove canopy cover did not have a major influence on the abundance of mollusks in the mangrove ecosystem of Benoa Bay.
REFERENCE
-
[1] Agustini, NT, Ta'alidin, Z., and Purnama, D. 2016. The structure of the mangrove community in the village of Kayapu, reluctanto island. Enggano Journal, 1(1):19-31.
-
[2] Arbi, UY 2012. Mollusk community in the seagrass meadow of Wori Beach, North Sulawesi. Sustainable Earth Journal of the Environment, 12 (1) : 55-65.
-
[3] Baksir, A., Mutmainnah, Akbar, N. and Ismael, F. 2018. Assessment of conditions using themethod hemispherical photography on the mangrove ecosystem on the coast of Minaluli Village, North Mangolu District. Sula Islands Regency. North Maluku Province. Journal of Aquatic ResourcesIndopacific, 2 (2): 69-80.
-
[4] Chianucci, F., Chiavetta, U., and Cutini, A. 2014. The estimation of canopy attributes from digital cover photography by two different image analysis methods. iForest-Biogeosciences and forestry, 7 (4): 255-259.
-
[5] Dharmawan, IW E and Pramudji. 2014. Guidelines for monitoring the status of mangrove ecosystems. Jakarta: CRITC COREMAP CTI LIPI.
-
[6] Dibyowati, L. 2009. Diversity of mollusks (bivalves and gastropods) along Carita beach, Pandeglang, Banten. [Thesis]. Bogor: Biology study program, faculty of Mathematics and natural sciences university of Bogor Agricultural University.
-
[7] Gazali, S., Rachmawani, D., and Agustianisa, R. 2019. The relationship between mangrove density and abundance of gastropods in the mangrove and proboscis monkey conservation area (KKMB) of Tarakan city. Borneo harpodon journal, 12(1):9-19.
-
[8] Hartoni, H., and Agussalim, A. 2013. The composition and abundance of mollusks (gastropods and bivalves) in the mangrove ecosystem of the Musi river estuary, Banyuasin regency, South Sumatera Province. Maspari Journak, 5 (1), 6-15.
-
[9] Ikramullah, I., Sarong, M. A., and Dewiyanti, I. 2017. Abundance and diversity of gastropods and bivalves in the Le Masen mangrove ecosystem, Muara Tiga District, Pidie regency. Scientific journal of marine and fisheries students Unisyiah, 2 (4).
-
[10] Ishida, M. 2004. Automatic thresholding for digital hemispherical photography. Canadian journal of forest research, 34 (11): 2208-2216.
-
[11] Jenning, SB, Brown, ND, and Sheil, D. 1999. Assessing forest canopies and understorey
illumination: canopy closure, canopy cover and other measures. Forestry: an international journal of forest research, 72 (1): 59-74.
-
[12] Korhonen, S., Amwar, C., Chaniago, A and Baba, S. 1997. Handbook of mangroves in Indonesia (Bali-Lombok). Denpasar: JICA-ISME.
-
[13] Kusrini, DM (2000). The Composition and Structure of the Potamidedae Conch Community in the
Mangrove Forest of Teluk Hurun, Padang Cermin District, Nupatan, South Lampung (Doctoral dissertation, Thesis. Department of Water resources. Bogor: Institute of Agriculture Bogor. [Indonesian].
-
[14] Kusuma, C. 2015. Integrated sustainable mangrove forest management Journal of natural resource and environmental management, 5 (1): 1-6.
-
[15] Nadaa, MS, Taufiq-Spj, N., and Redjeki, S. 2021. Conditions of macrozoobenthos (gastropods and bivalves) in mangrove ecosystems, Pari Island, Serubu Islands, Jakarta Oceanographic Bulletin Marina 10 (1): 33-41.
-
[16] Nurdiansah, D. and Dharmawan IWK community mangrove 2018. Alas Purwo National Park, Banyuwangi: National Parks Nature Center Purwo Banyuwangi. 32 pp.
-
[17] Riniatsih, I and Wibowo, E. 2009. The base substrate and oceanographic parameters as pen and the presence of gastropods and bivalves on Sluke Beach, Rembang Regency. Marine science: Indonesian Journal of Marine Sciences, 14 (1) : 50-59.
-
[18] Putri, N., Afriyansyah, B., and Marwoto, RM 2021. Density of bivalves in the mangrove area of the Perpat River and Bunting Belinyu River, Bangka. Journal of tropicaloceans, 24 (1): 123-132.
-
[19] Sani, LH, Candri, DA, Ahyadi, H., and Farista, B. 2019. The structure of natural mangrove vegetation and rehabilitation of the southern coast of Lombok Island. Journal of Tropical Biology 19 (2) : 268-276.
Discussion and feedback