Primary Productivity Levels and About Phythoplankton In Tamblingan Lake
on
Advances in Tropical Biodiversity and
Environmental Sciences
6(2): 39-44, June 2022
e-ISSN:2622-0628
DOI: 10.24843/ATBES.v06.i02.p02
Available online at: https://ojs.unud.ac.id/index.php/ATBES/article/view/72450
Primary Productivity Levels and About Phythoplankton in Tamblingan Lake, Buleleng District, Bali
Jordan Alexander Anggiat Simanjuntak*, I Wayan Restu, I Wayan Darya Kartika
Department of Aquatic Resources Management, Faculty of Marine and Fisheries, Udayana University Jl. Kampus Unud Bukit Jimbaran, Kuta Selatan, Badung, Bali
*Corresponding author: jordananggiats@gmail.com
Abstract. The role of lake waters in supporting people's lives in a broad sense is largely determined by the level of lake productivity, one of which is primary productivity. The primary productivity of the lake can be seen from the abundance and diversity of phytoplankton which are the basic components in the food chain system in waters. The purpose of this study was to determine the level of primary productivity and abundance of phytoplankton. The bottle-dark-bottle-light method was used to determine the photosynthetic rate and respiration of phytoplankton. Gross photosynthesis (GP = dirty photosynthesis) is obtained by subtracting the dissolved oxygen content in the dark bottle from the dissolved oxygen content in the light bottle, after being subjected to lighting (incubation) for several hours. Result the highest abundance is at station II. The uniformity index shows that for station 3 it is the lowest category. The results of the calculation of the phytoplankton dominance index have a value that is inversely proportional to diversity. Based on the category, the index value for the three stations is categorized as low dominance. Water quality parameters measured include dissolved oxygen (DO), degree of acidity (pH), temperature, brightness, and turbidity. Based on all measurements and several aspects of conditions that occur in the waters of Lake Tamblingan, it is still classified as normal and good enough for the continuation of aquatic life. The determinant of the primary productivity among them were pH, temperature, turbidity, and brightness.
Keywords: abundance; phytoplankton; productivity; tamblingan lake
I. INTRODUCTION
Tamblingan Lake is located on the northern slope of Mount Lesung, Munduk Village area, Banjar District, Buleleng Regency, Bali. This lake is one of three twin lakes formed from a large caldera. The role of lake waters in supporting community life in a broad sense is largely determined by the level of lake productivity, both primary, secondary and tertiary productivity. The primary productivity of the lake can be seen from the abundance and diversity of phytoplankton, which are the basic components in the food chain system in waters [1].
Aquatic productivity is the rate of anchoring or storing energy (sunlight) by autotrophic communities in an aquatic ecosystem. Productivity itself consists of primary productivity (producers) and secondary productivity (consumers: zooplankton, fish, benthos, etc.). Primary productivity of waters is an important factor in marine aquatic ecosystems, because it plays a role in the carbon cycle and food chain for heterotrophic organisms [2]. The
existence of phytoplankton in an area of water can provide information about the condition of the waters. Phytoplankton is a biological parameter, which can be used as an indicator to evaluate the quality and level of fertility of a waters [3].
Phytoplankton also functions as a bioindicator of water quality which has cosmopolitan properties, which can live in various types of waters or in other words, the distribution pattern is very wide, which means that the distribution of plankton varies from one place to another due to different water quality [4]. The ability of phytoplankton will decrease if there is damage to the surrounding environment, such as waste pollution and anthropogenic activities. Vice versa, the pros and cons of a waters can be seen through the level of primary productivity and the diversity of phytoplankton [5]. Based on the description above, this research was conducted to determine the condition of Tamblingan Lake as seen through the level of primary productivity and abundance of phytoplankton.
-
II. RESEARCH METHOD
The method used in this research is quantitative descriptive method. The quantitative descriptive method begins by collecting data, analyzing the data, and interpreting it. Data collection Primary productivity measurements were carried out using the dark and light bottle oxygen method. The working principle of this method is to measure changes in oxygen content in dark and light bottles containing water samples that have been incubated in water exposed to sunlight. The incubation time for dark bottles and light bottles is 3-4 hours, to obtain the NPP, GPP and R values per hour, it is calculated based on the following formula [6]. The plankton sampling technique is carried out passively, not moving where the water sample is taken by drawing and pouring 100 liters of sample water into the Plankton Net. Samples were collected using a Plankton Net and a 20 ml bottle to place the plankton sample at the ends. The filtered sample in a container is then stored in a sample bottle and 1 ml of 4% formalin is added [5]. Water samples for phytoplankton were taken by a filtering method by taking them horizontally at the sea surface at a depth of 0.5 m [7].
Data Analysis
-
a. Primary Productivity of Aquatic
The primary productivity value of waters is measured using the following formula:
NPP ~ (°2BT-O2BA)X 1000 x 0375
PQ(t)
-
d. Uniformity Index (E)
The species uniformity index is an index that shows the level of individual evenness of each species in a community [8]:
_ H'
E LnS
-
e. Dominance Index (C)
The dominance of phytoplankton can be determined by calculating the dominance index. The dominance index is calculated using the Simpson's "Evennes Shannon" formula [9] namely:
■ ∑-
III. RESULTS AND DISCUSSION
b. Abundance of Phytoplankton
Phytoplankton identification was done by taking a sample of 1 cc and placed in the Sedgwick-Rafter and observed under a microscope. The Sedgwick-Rafter observations are divided into 10 fields of view. The phytoplankton found are then counted and documented for further identification to the Genus level [5]. Kelimpahan Plankton dengan metode “Lackey Drop Microtransect Counting” [6] is as follows:
Primary Productivity of Aquatic
The productivity level ranges from 29.95 - 62.50 mg C/m3/hour. In the first observation on November 5, 2020, the highest water productivity value occurred at station II with a value of 55.99 mg C / m3 / hour with the value of each station, namely station I with a value of 29.95 mg C/m3/hour, at station II with a value of 55.99 mg C/m3/hour, and at station III with a value of 36.46 mg C/m3/hour.In the second observation on November 19, 2020, the highest water productivity value occurred at station II with a value of 62.50 mg C/m3/hour with the value of each station, namely station I with a value of 36.46 mg C/m3/hour, at station II with a value of 62.50 mg C/m3/hour, and at station III with a value of 40.36 mg C/m3/hour. In the third observation on December 3, 2020, the highest water productivity value occurred at station II with a value of 48.18 mg C/m3/hour with the value of each station, namely station I with a value of 36.46 mg C/m3/hour, at station II with a value of 48.18 mg C/m3/hour, and at station III with a value of 41.67 mg C/m3/hour.
N
A C 1
= n x-;r- x x
B
D E
c. Species Diversity Index (H')
Diversity index is an index that shows the level of diversity of the types of organisms that exist in a community. The calculation of the diversity index using the Shannon index equation is as follows [8]:
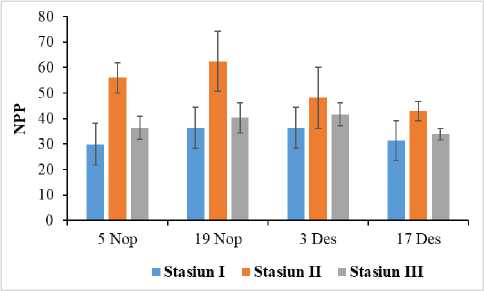
Figure 1. The primary productivity of aquatic
S
H' =
∑ pi lnpi
n=1
In the fourth observation on December 17, 2020, the highest water productivity value occurred at station II with
a value of 42.97 mg C / m3 / hour with the value of each station, namely station I with a value of 31.25 mg C/m3/hour, at station II with a value of 42.97 mg C/m3/hour, and at station III with a value of 33.85 mg C/m3/hour. At all stations the value of the highest productivity level is located at station II and the lowest is at station I. The productivity level has decreased in the third observation or in December.
Abundance phytoplankton
The results of phytoplankton identification found in Tamblingan Lake, there are 11 genera from various classes (Table 1). The 11 genera include Chrorella sp., Gyrosigma sp., Melosira sp., Navicula sp., Nitzchia sp., Oscillatoria sp., Pleurosigma sp., Rhizolenia sp., Skeletonema sp., Synedra sp., Tabellaria sp. At station I 9 species were found, 10 species were found at station II, and 8 species were found at station III. Abundance calculation resultsfrom three stations, respectively, get 362.3 ind / m2, 479.3 ind/m2, and 388.5 ind/m2. The highest abundance was at station II and the lowest was at station I. At all stations the highest abundance was found in Nitzchia sp (Figure 2).
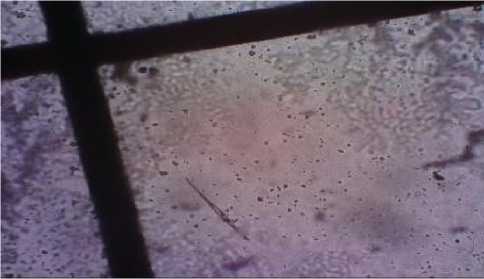
Figure 2. One of phytoplankton was found (Nitzchia sp)
Phytoplankton Diversity index
The results of the calculation of the phytoplankton diversity index found in the waters of Lake Tamblingan at station 1 were 1,954, at station 2 were 2,041, and at station 3 were 1,847. Based on the category value, the Shannon-Wienern index refers to all stations, namely the diversity in the medium category (Figure 3).
Phytoplankton Uniformity Index
The phytoplankton uniformity index found in Tamblingan Lake waters has the same pattern as the diversity index. The result of the calculation of the uniformity index at station 1 was 0.254, at station 2 it was 0.256, and at station 3 it was 0.238. Based on the category, the uniformity index value is aimed at station 1, namely the uniformity of the medium category, at station 2 it is in the medium category, and at station 3 it is in the low category (Figure 4).
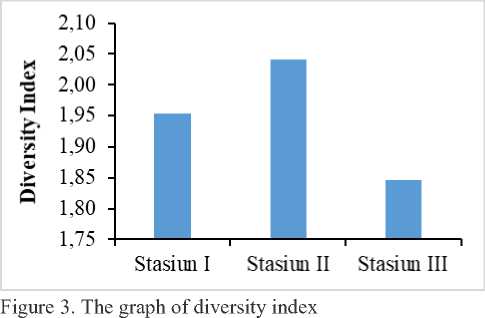
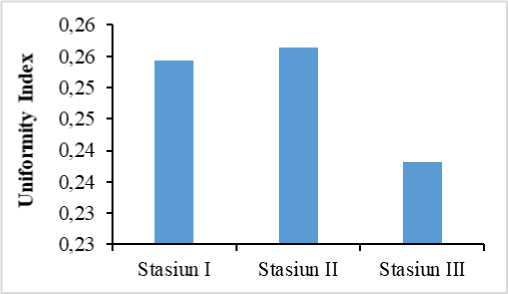
Figure 4. The graph of unformity index
Phytoplankton Dominance Index
The results of the calculation of the phytoplankton dominance index found in the waters of Lake Tamblingan have a value that is inversely proportional to the diversity with the value at station 1 is 0.175, at station 2 is 0.155, and at station 3 is 0.187. Based on the Simpson index value category, it is aimed at all stations, namely the dominance is low category (Figure 5).
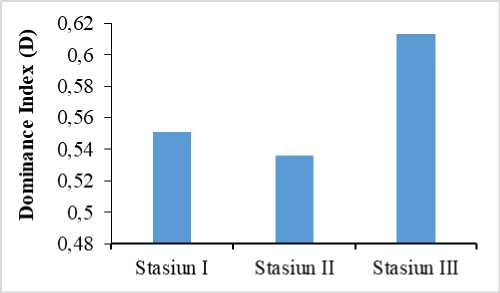
Figure 5. The graph of dominance index
Water Quality Parameters
The results of measuring the quality of water in Tamblingan Lake have varied values. Intake of water quality is carried out at three times, namely morning, afternoon and evening. The results of water quality at each station were slightly different, but for each station at different times did not experience large fluctuations.
Based on the results of observations and NPP calculations on Tamblingan Lake, there are differences between stations (Table II). This shows that there are differences in the activity of aquatic organisms such as the consumption of dissolved oxygen for respiration and the decomposition of organic matter by bacteria. NPP results are directly proportional to the abundance of phytoplankton at each station. The highest NPP value is at station II and followed by the highest NPP at station II. This shows that the existence of an abundance of phytoplankton greatly affects the productivity value of the waters in Tamblingan Lake. Phytoplankton as primary producers will produce dissolved oxygen through photosynthesis [9]. The higher the phytoplankton abundance, the more DO is produced, the higher the NPP.
Based on observations of phytoplankton found in Tamblingan Lake, there are 11 types. Most species found are Nitzchia sp. It is suspected that this type of plankton is very easy to breed compared to other types of plankton. Nitzchia is a phytoplankton that is able to adapt quickly when there is a change in water quality in aquatic ecosystems to keep reproducing properly [6]. The highest abundance of phytoplankton occurs at station II. It is suspected that at this station the intensity of the incoming light is very optimal so that the photosynthesis process by phytoplankton also runs optimally because at the time of sampling at this station the light intensity is quite good. Good light intensity will affect the productivity of the waters associated with the rate of photosynthesis by phytoplankton which is followed by a cultivation process that takes place in an aquatic ecosystem [10]. The abundance at station I and II has a lower value than at station II. It is suspected that this is influenced by the lack of light intensity that enters the photosynthetic process of phytoplankton. At stations I and II the conditions at the time of the sampling were quite dim because of the shady trees covering the waters of the Tamblingan lake.
Based on the phytoplankton diversity index found in the waters of Lake Tamblingan at station 1 is 1,954, at station 2 is 2,041, and at station 3 is 1,847. Based on the category value, the Shannon-Wienern index refers to all stations, namely the diversity in the medium category. The diversity value at all stations in the medium category is because the species found are quite heterogeneous, so that few species dominate at the station. if the diversity index value falls into the low category, it indicates that the waters are disturbed [11].
Based on the phytoplankton uniformity index in the waters of Lake Tamblingan, it has the same pattern as the diversity index. The result of the calculation of the uniformity index at station 1 was 0.254, at station 2 it was 0.256, and at station 3 it was 0.238. Based on the category, the uniformity index value refers to station 1, namely the
uniformity of the medium category, at station 2 it is in the medium category, and at station 3 it is in the low category.The highest uniformity was found at stations 1 and 2, because the species obtained were uniform and there were no dominant species. Whereas at station 3 the uniformity is low because there are species that dominate the area.The results of the calculation of the phytoplankton dominance index found in the waters of Lake Tamblingan have a value that is inversely proportional to the diversity with the value at station 1 is 0.175, at station 2 is 0.155, and at station 3 is 0.187. The absence of dominance in waters proves that the types of biota in these waters are very heterogeneous, so that no species controls an ecosystem [12]. Based on the results of temperature measurements in Lake Tamblingan, it is still classified as normal. Observations between stations at each point are still optimal for marine life.
In the measurement results of the degree of acidity (pH) of the Tamblingan Lake waters, all stations that have been studied have differences in the average pH value which are not much different. The pH range at the three stations is 5.5 - 6.7 where this range is still classified as normal for biota. The pH values across the stations are not much different. The lowest pH occurs at station 3. This condition is thought to be because at this station it has low water productivity which is thought to have a high respiration rate. The results of this respiration are generally in the form of ammonia and nitrite so that it greatly affects the pH of the waters.
The results of turbidity in the waters of Lake Tamblingan are still normal for aquatic biota. Turbidity levels at each station ranged from 3.64 - 12.92 NTU The turbidity of the waters at the three observation stations is still within the range of quality standards for aquatic biota [13]. High turbidity is due to the large amount of organic material suspended from the land into the waters [14]. Based on the brightness values at all stations, it ranges from 27.79 - 53.83 cm. The ecological effect of decreasing brightness will result in decreased light penetration in the waters. It also has an impact on decreasing the quality of photosynthetic processes and primary productivity by aquatic plants, resulting in disruption of the food chain in a waters [15].
-
IV. CONCLUSION
Based on the above discussion, the conclusion in this study is that the primary productivity conditions in Tamblingan Lake have a value range of 29.95 - 52.50 for two months of observation. Meanwhile, the abundance of phytoplankton from each station is directly proportional to the primary productivity of each station. There were 11 types of phytoplankton found at the time of sampling with the highest abundance of Nitzhchia sp. The determinant of
the primary productivity among them were pH, temperature, turbidity, and brightness.
REFERENCES
-
[1] Dutkiewicz, S., Cermeno, P., Jahn, O., Follows, M. J., Hickman, A. E., Taniguchi, D. A., & Ward, B. A. 2020. Dimensions of marine phytoplankton diversity. Biogeosciences, 17(3): 609-634.
-
[2] Jia, J., Gao, Y., Zhou, F., Shi, K., Johnes, P. J., Dungait, J. A., Lu, Y. 2020. Identifying the main drivers of change of phytoplankton community structure and gross primary productivity in a riverlake system. Journal of Hydrology, 583, 124633.
-
[3] Ujianti, R. M. D., Anggoro, S., Bambang, A. N., Purwanti, F., Androva, A. 2019. Environmental Study on Phytoplankton in Garang Watershed, Central Java, Indonesia and Its Water Quality. In IOP Conference Series: Earth and Environmental Science, 246 (1): 012070.
-
[4] Lestari, H. A., Samawi, M. F., Faizal, A., Moore, A. M., & Jompa, J. 2021. Diversity and abundance of phytoplankton in the Coastal Waters of South Sulawesi. HAYATI Journal of Biosciences, 28(3): 199-199.
-
[5] Lepori, F., Capelli, C. 2021. Effects of phosphorus control on primary productivity and deep-water oxygenation: insights from Lake Lugano (Switzerland and Italy). Hydrobiologia, 848(3): 613-629.
-
[6] Wetzel, R. G. 2020. Techniques and problems of primary productivity measurements in higher aquatic plants and periphyton. pp. 249-268. University of California Press.
-
[7] Ranjan, R. A. J. I. V., & Prakash, S. A. D. G. U. R. U. 2019. Seasonal Variation in Primary Productivity and Macrophytes of Baghel Taal. Iconic Research and Engineering Journal, 3(6): 210-215.
-
[8] Zhang, X., Wang, G., Tan, Z., Wang, Y., & Li, Q. 2021. Effects of ecological protection and restoration on phytoplankton diversity in impounded lakes along
the eastern route of China's South-to-North Water Diversion Project. Science of The Total Environment, 795, 148870.
-
[9] Song, L., Wu, J., Du, J., Li, N., Song, G., Wang, K., Wang, P. 2019. The Characteristics and Distribution of Eukaryotic Phytoplankton Community in Liaodong Bay, China. Ocean Science Journal, 54(2): 183-203.
-
[10] Balqis, N., El Rahimi, S. A., Damora, A. 2021. Keanekaragaman dan kelimpahan fitoplankton di perairan ekosistem mangrove Desa Rantau Panjang, Kecamatan Rantau Selamat, Kabupaten Aceh Timur. Jurnal Kelautan dan Perikanan Indonesia, 1(1): 35-43.
-
[11] Rahmawati, N. O., Hartoko, A., & Latifah, N. 2021. Analisis Kelimpahan Fitoplankton di Perairan Alang-Alang Taman Nasional Karimunjawa. Jurnal Kelautan Nasional, 16(2): 99-110.
-
[12] Agus, E. L., Pribadi, R., Subagiyo, S. 2019. Fluktuasi Fitoplankton pada Kawasan Konservasi Rajungan Perairan Betahwalang Demak. Jurnal Kelautan Tropis, 22(2): 191-196.
-
[13] Gurning, L. F. P., Nuraini, R. A. T., & Suryono, S. 2020. Kelimpahan Fitoplankton Penyebab Harmful Algal Bloom di Perairan Desa Bedono, Demak. Journal of Marine Research, 9(3): 251-260.
-
[14] Arianto, T., Qayim, I., Damar, A. 2020. Komposisi fitoplankton dan Produktivitas Primer di Danau Vulkanik Segara Anak Taman Nasional Gunung Rinjani. In Prosiding Seminar Nasional IPPeMas, 1(1): 470-480.
-
[15] Ananda, Y., Restu, I. W., & Ekawaty, R. 2019. Status Tropik dan Struktur Komunitas Fitoplankton di Danau Beratan, Desa Candikuning, Kecamatan Baturiti, Kabupaten Tabanan, Provinsi Bali Trophic Status and Community Structure of Phytoplankton in Lake Beratan, Candikuning Village, Baturiti Subdistrict, Tabanan District, Bali Province. Journal of Biological Sciences, 6(1), 58-66.
TABLE I
ABUDANNCE OF PHYTOPLANKTON
|
No |
Genus |
Station I |
Station II |
Station III |
|
1 |
Chrorella sp. |
- |
58.5 |
68 |
|
2 |
Gyrosigma sp. |
12 |
7.5 |
- |
|
3 |
Melosira sp. |
29 |
28 |
27 |
|
4 |
Navicula sp. |
40.5 |
68 |
66.7 |
|
5 |
Nitzchia sp. |
112.5 |
122.5 |
121.3 |
|
6 |
Oscillatoria sp. |
72 |
94.5 |
52 |
|
7 |
Pleurosigma sp. |
13.5 |
26 |
22 |
|
8 |
Rhizolenia sp. |
- |
14 |
13.5 |
|
9 |
Skeletonema sp. |
23.3 |
35 |
18 |
|
10 |
Synedra sp. |
28.5 |
- |
- |
|
11 |
Tabellaria sp. |
31 |
25.3 |
- |
|
Sub Total |
362.3 |
479.3 |
388.5 |
Total
1230.1
|
TABLE II WATER QUALITY PARAMETERS | |
|
Parameter |
Station I Station II Station III Quality Morning Noon Evening Morning Noon Evening Morning Noon Evening Standards |
|
Temperature (°C) |
26.75 24.60 24.95 25.00 25.00 23.30 24.35 25.85 27.35 24-28 |
|
pH |
6.41 6.50 6.19 6.69 6.56 6.53 5.52 5.61 6.71 5-9 |
|
Turbidity (NTU) |
7.52 12.92 8.05 4.52 3.64 5.24 5.53 8.19 3.89 25 |
|
Brightness (Cd) |
27.79 53.83 53.28 32.00 29.17 39.30 29.50 35.00 44.50 300-500 |
Discussion and feedback