The Composition, Size Distribution and Growth Patterns of Penaeus monodon and Penaeus merguiensis at the Estuary of Tukad Aya, Jembrana Bali
on
Advances in Tropical Biodiversity and Environmental Sciences 4(2): 15-20, February 2020 e-ISSN:2622-0628
DOI: 10.24843/ATBES.2020.v04.i01.p04 Available online at: https://ojs.unud.ac.id/index.php/ATBES/article/view/58270
15
The Composition, Size Distribution and Growth Patterns of Penaeus monodon and Penaeus merguiensis at the Estuary of Tukad Aya, Jembrana Bali
Josua Siagian*, I Wayan Arthana, Dewa Ayu Angga Pebriani, Suprabadevi Ayumayasari Saraswati
Aquatic Resources Management, Marine Science and Fisheries Faculty, Udayana University Jl. Kampus Unud Bukit Jimbaran, Badung-80361, Bali, Indonesia
*Corresponding author: joshausiagiand@gmail.com
Abstract. Estuary ecosystem has an important role in supporting the life of shrimp. High productivity and the availability of natural food in the estuary ecosystem, will indirectly affect the growth of shrimp. Penaeus monodon and Penaeus merguiensis were two species of shrimp that had economic value with high demand. The purpose of this study was to determine the biological aspects of Penaeus monodon and Penaeus merguiensis shrimp at estuary of Tukad Aya, Bali. Data collection was carried out in February-March 2019 using quantitative descriptive research methods. The determination of the research station was done by purposive sampling. The results showed the total number of shrimps were caught 1,756 individuals, which consist of Penaeus monodon 151 individuals, Penaeus merguiensis 224 individuals and 1,325 individuals of other shrimp. The composition of Penaeus monodon (8.6%) was less than Penaeus merguiensis (12.76%). Shrimp length measurements were divided into 9 groups with a range of values of 55.15-189.95 mm in Penaeus monodon and 31.3-140.1 mm in Penaeus merguiensis. The results of the length and the weight regression in both species of shrimp obtained the value of b <3 so that the growth pattern of shrimp was categorized as negative allometric where length growth was faster than weight gain.
Keywords: shrimp; composition; size distribution; growth patterns
-
I. INTRODUCTION
The estuary area is a region that is heavily influenced by the interaction between the land processes, rivers, and oceans [1]. The high productivity and the availability of natural feed on the estuary ecosystem will indirectly affect the growth of shrimp. Shrimp growth can be seen from the increase in length or weight at a time. Shrimp is an economical biota which is the main commercial, one of the shrimp from genus of the Penaedae consisting of tiger shrimp (Penaeus monodon) and white shrimp (Penaeus merguiensis) [2]. As one of the economical food that resulted in the capture of this species, in Ministry of Marine Affairs and Fisheries [3] showed the number of Penaeus merguiensis catches increased in the year 2008 by 73,870 tons to 87,405 tons in 2012. The increased arrest also occurred on the commodity Penaeus monodon, 2008 years of the arrest reached 26.492 tons and in 2012 reached 27.959 tons.
The capture activity affects the population's condition of shrimp in nature. The population condition of a species can be known through morphological measurements [4]. Morphometric is one way to determine the diversity of a species by testing the character of the morphology in general [5]. Morphometric studies can be used to describe the character of a population, evaluation of the population structure for stock identification, identification of
differences between populations [6], as well as for the exploitation and management of a Species [7].
Research on morphometric can also uncover the interrelated between body parts such as length and weight in shrimp [8]. Morphometric measurement is a better technique to distinguish the body shape in the population [9]. A morphometric study of the Penaeid shrimps were indentifying on Penaeus monodons [10] and Penaeus merguiensis [11]. Since information about shrimp resources at estuary of Tukad Aya, Bali is still lacking, research on basic information on fisheries biology such as composition, size distribution and shrimp growth patterns needs to be done.
-
II. RESEARCH METHODS
Time and Location of the Research
The research time was conducted on February and March 2019. The research was located at Muara Tukad Aya, Tuwed Village, Melaya Sub District, Jembrana Regency, Bali. Shrimp sampling was done three times on 01 February 2019, 24 February 2019, and 13 March 2019. Samples were collected from three research stations consisting of upstream of estuary (Station I), open area of estuary (station II), closed area of estuary (Station III). The location map of each research station was shown in Figure 1.
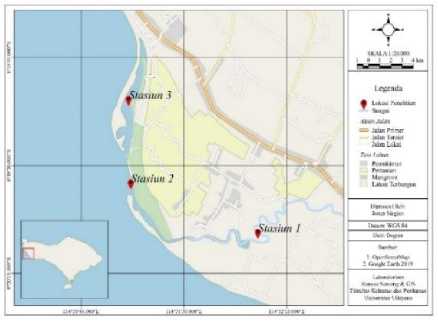
Figure 1. Location of research stasiun in Tukad Aya estuary
Tools and Materials
The tools used were shrimp catcher, Stationery, GPS (GARMIN, eTrex 10), Vernier Caliper, digital scales, cameras (SONY, A600), jars, and laptops. Material used was formalin 4%.
Shrimps Sampling Method
The sampling method used was simple random sampling [12]. The arrest of shrimp was done on the morning hours 05.30-08.00 WITA and afternoon at 16.0019.00 WITA. Shrimp sample was inserted into the jar, then preserved with a 4% formalin. Specimens measured in the fisheries Laboratory of the Faculty of Marine and Fisheries of Udayana University
Shrimps Measurement Method
Measurements were conducted using a 0.05 mm precision caliper-length whereas the shrimp weight measurement used a 1 gram precision digital scale. Length measurements were done on the character length of the carapace (the distance from the posterior boundary of the head to the anterior of the first segment and total length), the total length (the distance from the anterior end of the rostrum to the posterior tail). Measurement of weights was carried out by inserting all parts of the shrimp body into the scales.
Data Analyses
Shrimp composition
Shrimp species composition is calculated using the formula by Fachrul (2007) [13].
Ki= £) ×100%
Where Ki is the i-th species composition (%); this is the number of individuals of species I (ind); N is the total number of individuals
Shrimp Size Distribution
Determination of length frequency data is done by determining the number of class, range of date, and interval length [14].
K = 1+ 3,322 log N
R = Highest value – Lowest value
R
Ci= ∑K
Where K is the number of groups; N is the amount of data R is range of date; R is the data range; K is the number of groups; Ci is Interval length.
-
b. Growth patterns of Shrimps
To analyze the growth patterns of P. monodon and P. merguiensis the following formula was used [15].
W = a Lb
Where, W is the weight of shrimp (gram); L is the length of the carapace (mm); a is an intercept (the intersection of the length and weight relationship curve with the y axis); b is a predictor of long-weight growth patterns. The growth pattern is determined by testing the value of b against value 3 through the ttest with a level of α = 0.05. The tcount value is compared with the ttable (tα/2; n-2) value. If the value tcount < ttable, the H0 decision is obtained with an indication of isometric growth pattern, where the length increase is equal or proportional to the weight gain. In the decision of tcount > ttable, the decision to reject H0 received H1 is obtained where the growth pattern is allometric. If the value of b > 3, the growth pattern is called positive allometric, and if the value of b < 3, then the growth pattern is negative allometric. The ttest is carried out using the formula:
b-3 thit= Sb S2 Sb=
∑n=lX14( ∑n=1X1)2
Where tcount is the value of ttest; b is a slope; Sb is the standard error of value b
-
III. RESULTS AND DISCUSSION
Composition of Shrimp
During the study, the species of shrimp found in the estuary Tukad Aya consist of five species. Based on composition analysis, the number of shrimp P. monodon amounted to 8.6%, P. merguiensis was 12.76%, Litopenaeus vannamei was 4.21%, Metapenaeus sp was 71.92% and Macrobachium sp. with a percentage value of 2.51%. Data showed that Metapenaeus sp. was a species of shrimp that had the highest composition compared to other species. The lowest composition was found on the species Macrobachium sp. (Figure 3).
Shrimp Size Distribution
The results of the histogram analysis on the collected shrimp, presented in Figure 4. The distribution of both species of shrimp length was grouped into 9 groups. The highest number of individuals was at 69.25-84.25 mm class of P. monodon and at 79.7-91.7 mm class of P. merguiensis. The smallest P. monodon shrimp size was
55.15 mm while the largest was 189 mm. The smallest size of P. merguiensis was 31.3 mm, while the largest was 139 mm. It was found that the shrimp community at Tukad Aya were dominated by small shrimp or juvenile.
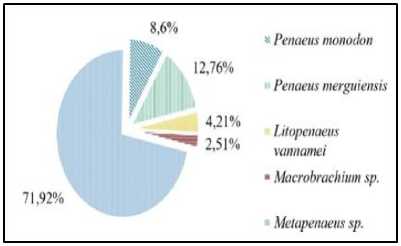
Figure 3. Shrimp compositions in estuary of Tukad Aya
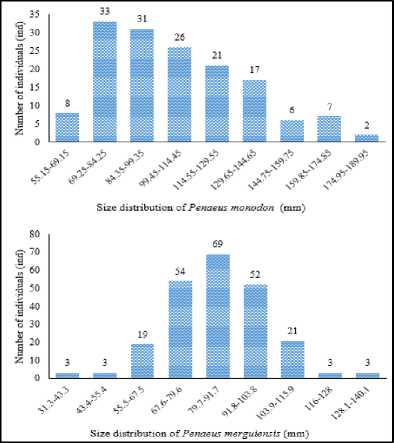
Figure 4. Shrimp size distribution in Tukad Aya Estuary
Growth Patterns of Shrimp
Samples of Penaeus monodon collected from the station I acquired the long-weight relationship of individuals with the equation W=0.0102 L2.1788 with the value of b=2.1788, at station II W=0.0022 L2.573 with the value of b=2.573 and station III obtained W=0.0007L2.9147 with the value of b=2.9147. The ttest, shown station I and II have tcount > ttable means reject the H0 and receive H1, where the growth pattern was alometrics and with the value of b<3 indicated that the growth pattern was negative alometrics. The ttest of station III showed that tcount < ttabel therefore receive H0 and reject H1, means that the growth patterns was isometric, where the increase of length followed with the increase of weight. Overall the length and weight relationship the tiger shrimps was shown in Figure 5.
The total samples collected from at the whole station was shown in Figure 6. Regression analysis obtained employing the equation W=0.0034L2.4945 with the value of b=2.4945. The ttest shown that the tcount > ttable indicating that the growth pattern of P. monodon at estuary of Tukad
Aya was alometrics, from a simple linear regression analysis showed that b<3, the growth was negative alometrics.
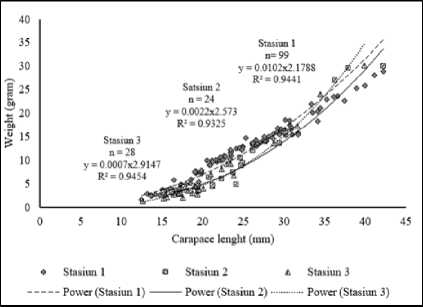
Figure 5. Relationships between the length and the weight of Tiger shrimps at the estuary Tukad Aya in each station.
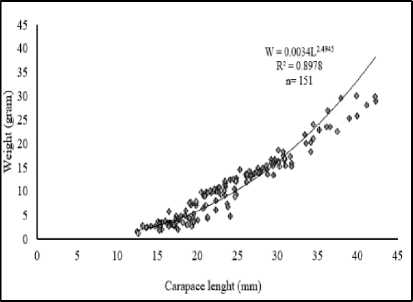
Figure 6. Relationships between the lenght and weight of white shrimps at all stations
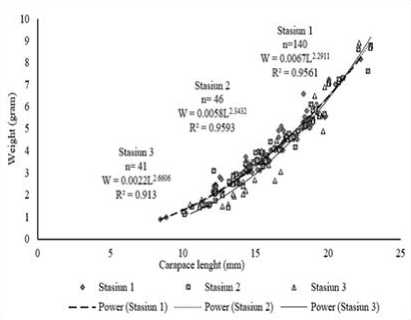
Figure 7. Relationship lenght and weight of Penaeus merguiensis at the estuary Tukad Aya in each station
Based on the analysis of the length and weight relationships of P. merguiensis was shown in Figure 7. Station I had the equation of W=0.0067L2.2911 with the value of b=2.2911, on station II obtained equation W=0.0058L2.3432 with the value of b=2.3432 while at station III indicates equation W=0.0022L2.6606 with the value of b=2.6606. The result of the entire station ttest showed that the tcount > ttable, reject H0 and accept H1, so that
the growth pattern of P. merguiensis was alometric with the value of b<3, the growth pattern was negative alometrics.
Overall the long and weight relationship of Penaeus merguiensis collected from the estuary of Tukad Aya shown in Figure 8. Equation obtained W=0.0056L2.3501 with the value of b=2.3501, based on T test showed that the tcount > ttable then reject H0 and accept H1, therefore the growth pattern was alometric, b < 3 so that the growth pattern of Penaeus merguiensis was negative alometric.
Discussion
The composition of P. monodon and P. merguiensis was smaller than other shrimp catches. According to Sari et al. (2017) the differences between shrimp catches can be caused by a side capture [16]. The result of shrimp caught at the estuary of Tukad Aya was dominated by Metapenaeus sp. as much as 71.92% of the overall catch (Fig. 3). The same results were also found by Harlisa (2017) [17] who conducted research in Barru, South Sulawesi, where the most shirmps caught was Metapenssaeus sp. Suprapto et al. (212) in his research also found that Crustacean composition across WPP (Fisheries Management Areas) in Indonesia spread over 25 species dominated by Parapenaeopsis spp., and Metapenaeus spp [18].
Based on 9 group size of P. monodon, the smallest shrimp size caught was 55.15 mm, while the largest was 189 mm. According to Slamet (1987), P. monodon can reach a length of 34 cm and weight 270 grams/ind. If they are allowed to grow in the wild can reach the length of 300 mm, but in a pond can only reach less than 200 mm [19]. It was explained that the entire P.s monodon that were caught in February-March 2019 had not reached the maximum size compared to earlier studies found that length of P. monodon at estuary of Tukad Aya was 189 mm. The most widely found group was range between 69.25-84.25 mm consist of 33 individuals, so that the dominant shrimp were caught in the category of juvenile and adult shrimp. Similar to P. monodon, P. merguiensis based on 9 groups, the most groups were fallen in the range between 79.7-91.7 mm intervals, consist of 69 individuals. The most shrimp size was 31.3 mm, while the largest was 139 mm. Slamet [19] said that P. merguiensis can reach a length of 250 mm with a weight of 30 grams/ind. From the overall catch of P. merguiensis in the estuary of Tukad Aya had not reached the maximum size in the period of February-March 2019. Based on the research of Saputra et al. [20] in the waters of Cilacap, the smallest size length P. merguiensis found was 31 mm and the largest 61 mm. Kendal water, the size was varied, the smallest size was 80 mm and the largest was 151 mm, meanwhile form the tributaries the smallest size of shrimp caught was 107 mm
and the largest was 120 mm, so the size of the shrimp caught in the estuary Tukad Aya had a larger size compared to the location the research except for the waters of Kendal [16].
The size of P. monodon and P. merguiensis caught in the estuary of Tukad Aya was varied, supposedly because the location of research was the estuary that was used as nursery and feeding ground for shrimp. The larva of shrimp migrates to the enlargement area in the coastal waters that were close to the estuary of the river and after growing up and reaching the mature size of the gonads will return to the sea to clusters [21][22]. Therefore, the size of the shrimp found in the estuary was dominated by young shrimps. Another thing that affects the size spread of shrimp in the estuary Tukad Aya are likely to be influenced by environmental factors, the size of the capture equipment net used and trip fishing shrimp. Similar finding was found in Tarakan, Kalimantan that the difference in the size of shrimps in the waters was likely influenced by environmental conditions, capture equipment and pressure catching [23]. In addition to the outside factors affecting the size of the captured shrimps, Rohim [24] in his research on the waters of the Estuarine Wildlife Sanctuary of Karang Gading found that the size difference of shrimp was also suspected because there were factors in the species of heredity, sexual and age.
Based on the analysis of the length and weight relationship of the P. monodon in each station showed that the growth pattern of P. monodon at the stations I and II was negative alometrics while station III was isometric. This, was due to difference in value b of length and weight regression result of shrimp. The value b=3 means the growth pattern was isometric, whereas when the value b was greater or smaller than 3, then the growth pattern was alometric [15].
Compared to other studies, the pattern of isometric growth on P. monodon was also found in the waters of Kakkaithevu Srilanka [25] and in the waters of Tarakan Kalimantan [23]. Differences in growth patterns were caused by environmental physical conditions at each station. Some factors that cause growth of positive alometrics or negative alometrics according to Mulfizar et al. among others were physiological and environmental conditions such as temperature, pH, salinity, geographical location and sampling technique [26].
In general, the length and weight relationship of P. monodon of the total samples collected from the entire station obtained a value b < 3 indicating that the growth pattern of P. monodon at the estuary of Tukad Aya was negative alometrics. Suspected growth patterns of P. monodon in the estuary of Tukad Aya was negative alometrics caused due to the age difference of each individuals, the results of a length frequency distribution
in the young category, Murni (2004) [27] stated that the longer the age of the shrimp, the increase in weight will be greater than the length while the young shrimp, the length was greater than the increase of weight. The variations in growth patterns can be caused by various factors, such as the number of shrimp samples measured, water and season conditions [23].
Analysis of the length and the weight relationships of P. merguiensis at each station showed that the value of the b<3, so that the estimation of the growth pattern was negative alometrics whereas the length growth pattern of the carapace was faster compared to weight. P. merguiensis at the research sites did not indicate any differences in growth patterns. This was my due to the environment condition that was still optimum to support the life of shrimp, so that the physical condition of the environment had no major effect on the pattern of shrimp growth. The length relationships of the carapace and the weight of P. merguiensis at all station gained a value of b<3, which indicated that the growth pattern of P. merguiensis in the estuary of Tukad Aya was negative alometrics. Research conducted in the waters of Meulaboh also showed the similar pattern, that the growth of P. merguiensis was negative alometrics [28], as well as at Cilacap [29] and Central Java [30]. According to Fourzan et al. [31] the pattern of growth was relatively similar in some waters, both different species were suspected to be influenced by the conditions of the aquatic environment especially the temperature, availability, and quality of the water resources were relatively the same.
-
V. CONCLUSION
Compositions of shrimps caught from Tukad Aya shows that the Penaeus monodon was caught less (8.6%) than Penaeus merguiensis (12.76%). The size distribution of shrimps were dominated by juveniles, while the growth pattern of shrimps were indicated negative alometrics.
REFERENCES
-
[1] Sugiarti S, SH Hariyadi, Nasution. 2016. Keterkaitan antara Kualitas air Dengan Hasil Tangkapan Ikan Dimuara Sungai Teluk Banten, Provinsi Banten. Lim. Per. Darat Tropis di Indonesia 1(23): 1-16.
-
[2] Pratiwi R. 2008. Aspek Biologi Udang Ekonomis Penting. Oseana, 2(32): 15-24.
-
[3] Kementerian Kelautan dan Perikanan. 2013. Buku Statistik 2012 Kelautan dan Perikanan. Jakarta, Indonesia: Badan Pusat Data, Statistik dan Informasi Menteri Kelautan dan Perikanan.
-
[4] Widiyati A, K Subandriyo, W Sumantadinata, Hadie, E Nugroho. 2004. Keragaman morfologi dan fluktuasi asimetri ikan nila (Oreochromis niloticus) dari Danau Tempe (Sulawesi Selatan) dan beberapa sentra
produksi di Jawa Barat. Jurnal Penenelitian Perikanan Indonesia, 5(10): 47-53.
-
[5] Baur H, C Leuenberger. 2011. Analysis of ratios in multivariate morphometry. Systematic Biology. 6(60): 813-825.
-
[6] Cheng Q, D Lu, L Ma. 2005. Morphological differences between close populations discernible by multivariate analysis: A case study of genus Coilia (Teleostei: Clupeiforms). Living Resources Aquatic. 18(187): 92.
-
[7] Mamuris AP, P Apostolidis, P Panagiotaki, AJ Theodorou, C Triantaphyllidis. 1998. Morphological variation between red mullet populations in Greece. Journals of Fish Biology. 52: 107-117.
-
[8] Carpenter KE, VH Niem. 1998. FAO Spesies Indentification Guide for Fishaery Purpose “The Living Marine Resources of The Western Central Pacific .Vol. 2. Rome: South Pacific FFA and NORAD.
-
[9] E. Kusrini. Menggali Sumberdaya Genetik Udang Jerbung (Fenneropenaeus Merguiensis De Man) Sebagai Kandidat Udang Budidaya Di Indonesia. Media Akuakultur, 1, 6, 49-53 (2013).
-
[10] Natarajan S, S Sambasivam, S Rajagopal, T Balasubramanian. 2012. Morphometric studies on wild caught and cultured shrimp Penaeus monodon (Fabricius, 1798) from Parangipettai, India. Pelagia Research Library. 5(2): 490-507.
-
[11] Mulya MD. 2012. Kajian Bioekologi Udang Putih (Penaeus merguiensis De Man) Di Ekosistem Mangrove Percut Sei Tuan Sumatera Utara. Disertasi. Bogor. Sekolah Pascasarjana Institut Pertanian Bogor.
-
[12] Sugiyono P. 2007. Memahami Penelitian Kualitatif. (8th ed.). Bandung, Indonesia: Alfabeta (2005).
-
[13] Fachrul MF. 2007. Metode sampling bioekologi.
Penerbit: Bumi Aksara. Jakarta.
-
[14] Walpole RE. 1992. Introduction to Statistic. 3rd
Edition. Diterjemahkan oleh Sumantri B. Jakarta, Indonesia: PT Gramedia Pustaka Utama.
-
[15] Effendie. 2002. Biologi Perikanan. Yayasan Pustaka Nusatama,Yogyakarta.
-
[16] Sari V, S Anhar, WS Suradi. 2017. Komposisi Dan Beberapa Aspek Biologi Spesies Udang Penaeid Di Perairan Batang Dan Kendal, Jawa Tengah. Journal of Maquares. 4(6): 423-432.
-
[17] Harlisa. 2017. Identifikasi Hasil Tangkapan Crustacea Pada Alat Tangkap Mini Trawl Di Perairan Kabupaten Barru, Sulawesi Selatan. Prosiding Simposium Nasional Krustasea 2017. Jakarta, Indonesia, 20 Juli 2017, 125-130.
-
[18] Suprapto, Nurulludin, P Lestari. 2012. Keanekaragaman Jenis Udang di Perairan Timur Kalimantan. Bunga rampai Status Pemanfaatan Sumberdaya Ikan di Teluk Bone, Laut Flores, Laut Banda. Balai Riset Perikanan Laut. IPB Press, 29-43
-
[19] Slamet S. 1987. Budidaya Udang dan Ikan dalam Tambak. Jakarta, Indonesia: Penebar Swadaya.
-
[20] Saputra W, S Djuwito, A Rutiyaningsih. 2013. Beberapa Aspek Biologi Udang Jerbung (Penaeus merguiensis) di Perairan Pantai Cilacap Jawa Tengah. Management Of Aquatic Resources J. 2(3): 47-55.
-
[21] Bauer RT. Amphidromy And Migrations of Freshwater Shrimps. I. Costs, Benefits, evolutionary origins, and an unusual case of amphidromy. In Proceedings of The Crustacean Society Summer Meeting. Tokyo, Japan, 20-24 Sept 2009, 145-156.
-
[22] Sheaves M, R Johnston, RM Connolly, R Baker. 2012. Importance of estuarine mangroves to juvenile banana prawns. Estuarine. Coast. Shelf Sci. 114: 208-219.
-
[23] Chodrijah U, R Faizah. 2018. Beberapa Aspek Biologi Udang Windu (Penaeus monodon) (Fabricus, 1789) Di Perairan Tarakan, Kalimantan Utara. Bawal, 10(1): 49-55.
-
[24] Rohim AA. 2018. Pertumbuhan Udang Putih
(Penaeus merguiensis De Man 1888) Di Perairan Estuari Suaka Margasatwa Karang Gading Kabupaten Deli Serdang. Skripsi. Medan, Indonesia: Program Studi Manajemen Sumberdaya Perairan, Fakultas Pertanian, Universitas Sumatera Utara.
-
[25] Piratheepa U, Edrisinghe, K Chitravadivelu. 2013. Relationship of Penaeus monodon (Fabricius, 1798) in Kakkaithevu Coastal Watersinthe Northern Partof Sri Lanka S. Tropical Agricultural Research. 25(1): 133–140.
-
[26] Mulfizar, ZA Muchlisin, I Dewiyanti. 2012.
Hubungan Panjang Berat dan Faktor Kondisi Tiga Jenis Ikan yang Tertangkap di Perairan Kuala Gigieng, Aceh Besar, Provinsi Aceh. Jurnal Depik. 1(1): 1-9.
-
[27] Murni I. 2004. Kajian Tingkat Kematangan Gonad Udang Galah (Macrobrachium rosenbergii de Man) di Muara Sungai Kapuas Pontianak Kalimantan Barat. Sekolah Pascasarjana. Tesis. Bogor, Indonesia: Sekolah Pascasarjana Institut Pertanian Bogor.
-
[28] Yusuf HN, S Ali, T Hidayat. 2017. Beberapa Parameter Populasi Udang Kelong (Penaeus indicus H. Milne Edward, 1837) Di Perairan Meulaboh. Prosiding Simposium Nasional Krustasea 2017.
Jakarta, Indonesia, 20 Juli 2017 (pp. 1-13) (2017).
-
[29] Saputra SW. 2008. Dinamika populasi udang dogol (Penaeus indicus H. Milne. Edwards 1837) di Laguna Segara Anakan Cilacap Jawa Tengah. Journal Perikanan. 10(2): 213-222.
-
[30] Tritadanu, T Ernawati. 2016. Kajian biologi udang jerbung (Penaeus merguiensis de Man, 1888) di perairan Utara Jawa Tengah. Bawal, Widya Riset Perikanan Tangkap. 8(2): 109-116.
-
[31] Fourzan PB, EL Alvarez. 2003. Factor affecting growth of the spiny lobsters Panulirus gracilis and Panulirus inflatus (Decapoda: Palinuridae) in
Guerrero, Mexico. Rev. Biol. Trop., 51(1): 165-174.
Discussion and feedback