The Effects of Shrimp Pond Waste on Water Quality of Patas Village as A Center Of Seaweed (Eucheuma spinosum) Cultivation
on
1
Journal of Advances in Tropical Biodiversity and Environmental Sciences Vol. 2 No. 1, February 2018 (p-ISSN: 2549-6980)
The Effects of Shrimp Pond Waste on Water Quality of Patas Village as A Center Of Seaweed (Eucheuma spinosum) Cultivation
I Ketut Wija Negara*, Suprabadevi Ayumayasari Saraswati, Ni Putu Putri Wijayanti
Study Program of Aquatic Resource Management, Faculty of Marine Science and Fisheries, Udayana University *Corresponding author: wijanegara@gmail.com
Abstract. The intensive farming of vannamei shrimp in Patas village release waste that affected the water quality for seaweed cultivation. The aims of this study were to investigate the effects of shrimp pond waste to water quality and growth of seaweed Eucheuma spinosum in Patas village. The research located in Patas village, Gerokgak district, Buleleng regency, Bali province, during the plantation cycle (45 days) from July to September 2017. The collected data consist of total N, total P, Nitrate (NO3-), Ammonium (NH4+), and Phosphat (PO43-). The results showed the average weight of seaweed near the shrimp ponds was 5.85% g with 0.15% g increment, while at the far location from shrimp ponds was 7.05% g with 0.41% g increment. Its indicated that the Eucheuma spinosum cultivated in far location has a better yield than the near location from shrimp ponds. The Chlorine content in shrimp pond waste affecting the seaweed growth and water quality, such as salinity, pH, DO, Nitrate, and Phosphat.
Keywords: Seaweed, Shrimp pond, Waste disposal, Water quality
-
I. INTRODUCTION
Seaweed belong to macro algae that classified to three classes based on pigment content, that is Chlorophyceae (green algae), Phaeophyceae (brown algae), and Rhodophyceae (red algae). Those three classes of algae were natural product of sea and highly potencial as a raw or processed materials (Aslan, 1998). Seaweed cultivation is one of cultivation in fisheries sector that suitable to develop in waters area of Indonesia. Some of the center of seaweed distribution were South-eastern Celebes, Central Celebes, Bali, Sumbawa, Sumba, and Moluccas (Anggadiredja et al., 2009). Eucheuma spinosum is a red algae (Rhodophyceae) that producing karagenan. Euchema includes some species such as Eucheuma edule, Eucheuma spinosum, Eucheuma cottoni, and Eucheuma cupressoideum. Two of them, E. spinosum and E. cottoni were the common cultivated species in Indonesia.
Seaweed cultivation is one of main livelihood activity in Patas village, district of Gerokgak, Buleleng regency. The cultivation areas were suitable for E. spinosum because of the sloping area with calm current. The substrates that composed by sand with coral-fragments also supporting the growth and development of the seaweed. In contrary, the massive development of shrimp ponds di Patas village threatening the water quality of seaweed cultivation by channeling waste disposal of those ponds directly to the sea. The shrimp pond waste contains nutrients that probably affecting the subsrate fertility and primary productivity. The pond waste contains materials from residual feed, metabolical excretion, and detritus. The
residual feed and metabolical excretion that could not have decomposed by microorganisms would following the stream to the coastal area, reaching the seaweed cultivation area. The existence of pond waste that entering the seaweed cultivation area probably affecting the growth of the seaweed. By that situation, the research that investigated the effect of shrimp pond waste to growth of seaweed E. spinosum is needed.
-
II. RESEARCH METHODS
Samples that used in this research was seaweed E. spinosum seedling in Patas village, district of Gerokgak, Bulelenng regency. Weight of a bunch seaweed seedling about 100 g, one ris line consist of 33 bunches seedling, so the weight of one ris line was 3 kg. Six ris lines (18 kg of seaweed seedling) were used in this research with 3 ris line for plantation area near from pond waste disposal and 3 ris line for the far from pond waste disposal.
The experimental research designed in pretest-postest control group design. This design using two subject groups, one group with experimental treatment (treatment group) and one group without treatment (control group). The equations described below:
RO1 X1O11
RO2 X2O12
O1 = Initial weight of seaweed near from the pond waste disposal
O11 = Final weight of seaweed near from the pond waste disposal
O2 = Initial weight of seaweed far from the pond waste disposal
O12 = Final weight of seaweed far from the pond waste disposal
X1 = Plantation near from the pond waste disposal
X2 = Plantation far from the pond waste disposal
Data collection for water quality collected once a week for ± 45 days observation or sampling. Salinity, temperature, DO, and pH parameters collected by observational method and direct measurement using water quality checking, while nitrate and phosphate contents measured by laboratory test.
Growth rate also measured one a week for ± 45 days observation. Growth rate measurement performed by collecting seaweed cluster in every bunch, then weighed to estimate the percentage of weight increment.
The relative growth rate is an increment of seaweed weight every unit in every time unit (James and Drenovsky, 2007). The relative growth also measured one a week for ± 45 days (about six weeks).
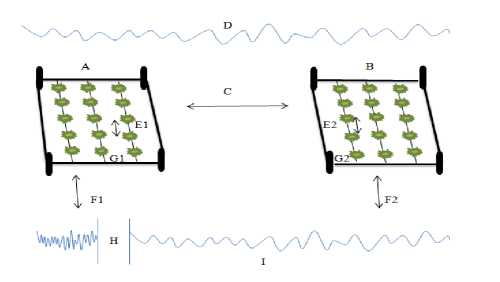
Figure 1. Plantation design using off bottom method in different location
A : Plantation area near from the pond waste disposal
B : Plantation area far from the pond waste disposal
C : Distance among plantation area (500 m)
D : Sea
E1, E2 : Distance of seaweed seedlings plantation (15 cm)
F1, F2 : Distance of coastal to the plantation area (15 m)
G1, G2 : Distance of sea floor to the seedlings (30 cm)
H : Pond waste disposal stream
I : Coastal
The data of seaweed E. spinosum growth analyzed by statistic (manual), while the T-test method used to reveal the differences of seaweed growth between the plantation area near from pond waste disposal and the plantation area that far from pond waste disposal.
-
III. RESULTS AND DISCUSSION
Water Quality Parameters
Seaweed growth was affected by physical and chemical factors of sea water. The water quality in seaweed E. spinosum plantation that near and far from the pond waste disposal showing some differences. The water quality range from each location showed at Table 1.
The salinity in water quality measurement in both locations was in optimal range for seaweed growth with average in 31 ppt. Water quality measurement have done to know the range of water quality tolerance for seaweed E. spinosum growth.
Every sea organism had a different range of salinity tolerance, including for E. spinosum, which mean if the water salinity playing an important role for organism growth and development. Luning (1990) states that salinity range that proper for E. spinosum is 28-34 ppt. The 45 days of salinity measurement di Patas village waters showing 31-32 ppt of salinity range. It implicates the water salinity in Patas village waters is in range of E. spinosum requirement.
The temperature measurement in both locations was quite high, which the highest temperature at the week IV in near from pond waste disposal plantation area and at the week II in far from pond waste disposal with 32°C. While the lowest temperature was at week III with 29 °C for near from the pond waste disposal location. The optimal temperature could increase the rate of nutrient absorption that impacted the increasing rate of seaweed growth by metabolism continuity (Effendi, 2003).
TABLE 1
OBSERVATION OF THE WATER QUALITY PARAMETERS
|
Location |
Weeks |
Salinity (ppt) |
Temp. (oC) |
DO (ppm) |
pH |
Nitrate (ppm) |
Phosphate (ppm) |
|
I |
32.44 |
30 |
0.80 |
8.40 |
0.50 |
0.2311 | |
|
Near from Pond |
II |
31.48 |
31 |
0.90 |
8.57 | ||
|
III |
31.56 |
29 |
0.95 |
8.17 |
1.40 |
0.0382 | |
|
IV |
31.80 |
31 |
1.37 |
8.30 | |||
|
V |
32.55 |
30 |
4.62 |
8.13 | |||
|
VI |
31.09 |
32 |
0.96 |
6.48 |
0.30 |
0.0089 | |
|
I |
32.44 |
30 |
0.90 |
8.23 |
0.80 |
0.0205 | |
|
II |
31.47 |
32 |
1.15 |
8.45 | |||
|
Far from |
III |
31.40 |
30 |
1.09 |
8.19 |
0.80 |
0.0561 |
|
Pond |
IV |
31.73 |
31 |
1.42 |
8.34 | ||
|
V |
32.84 |
30 |
5.12 |
8.13 | |||
|
VI |
32.17 |
31 |
1.09 |
6.33 |
0.10 |
0.0095 |
-
E. spinosum has an optimal temperature for growth at 20-28°C. The result showed if the temperature of both
location was higher, 29-31°C. This temperature measurement could be affected by sun light, deepness,
water current, and tidal. Temperature would affect the seaweed photosynthesis, directly or indirectly. The direct effect is controlling enzymatic reaction during photosynthesis, while indirectly is changing hydrology column structure that influencing the distribution of phytoplankton (Tomascik et al., 1997). High temperature also could inhibit growth rate and causing death by blocking photosynthesis.
The dissolved oxygen content (DO) at week I, II, III, IV, and VI in both location classified as low DO, with average 1.06, and out of range in seaweed growth requirement. But at week V in both location had DO that rapidly increasing, about 4.64-5.12 ppm, and in range of optimal DO for seaweed growth. DO is a limiting factor for all living organism, and a basic need for aquatic organism. The optimal DO for seaweed is 3.2-7.8 ppm (Ditjenkanbud, 2005). The low DO (week I, II, III, IV, VI) caused by waste disposal from shrimp ponds that have been scheduled. The waste disposal interfered seaweed photosynthesis and at the same time the other aquatic organism also needed oxygen. This event causing DO content dropped drastically.
When the temperature increasing, the DO content would decrease, and vice versa. At week V, the DO content at both location was in optimal range for seaweed growth, where at that week did not scheduled for pond waste disposal.
The lowest acidity (pH) level occurred at week VI, that is 6.33-6.48, while the highest was at week II for the near from pond waste disposal location (8.57). The acidity degree is the concentration of Hydrogen ion in that water (Wardoyo, 1981). The water pH in seaweed (E. spinosum) plantation also influencing the seaweed growth. The optimal range for pH is 7.77-8.4. At week I to V, both location had pH in optimal range, while at the week VI, the pH drecreasing. This is caused by the high amount of pond waste that entering the seaweed cultivation area at week VI. The chlorine waste that derived from pond waste also decreasing the pH. The pH decrement would inhibit the photosynthesis process in seaweed (Boyd, 1990).
The optimal nitrate range for seaweed growth is 0.93.5 ppm, while the lowest range is 0.3-0.9 ppm (Sulistijo,
-
1996). Boyd and Lichtkoppler (1982), states the lowest limit of nitrate tolerance for seaweed in 0.1 ppm and the highest is 3 ppm. If the nitrate content below 0.1 ppm or above 3 ppm, then nitrate would be limiting factor. Based on the result, the nitrate range in both locations are fit in range of seaweed nitrate tolerancy. The high nitrate consentration at week III caused by the high amount of pond waste (for the area that near from the pond waste disposal) that significantly increasing nitrate in cultivation area. The low nitrate consentration at week VI (the area that ar from pond waste disposal) caused by the distance of study area with pond waste disposal, and also the amount of waste that lower. Tambaru and Samawi (1996) indicate that high or low of nitrate consentration in water is highly depend on the input that come from river, soil drainage, bleaching, or erosion, and formation system that held in water body itself.
Phosphate is one of important parameter that needed by E. spinosum and generally in form of orthophosphate. The phosphate range at the location near from pond waste disposal was 0.0089-0.2311 ppm, while at the far from pond waste disposal was 0.0095-0.0561 ppm. The optimal phosphate range for seaweed is 0.051-1.00 ppm (Indriani and Sumiarsih, 1988). Patadjai (2007) states that phosphate requirement for optimizing algae growth affected by nitrogen. The highest limitation of phosphate concentration would be lower if the nitrogen in form of ammonium salt. In contrary, if the nitrogen in form of nitrate, the limitation of phosphate concentration would be higher. The lowest limitation of phosphate concentration for optimizing algae growth ranged 0.18-0.90 ppm and the highest between 8.90-17.8 ppm.
Seaweed Growth
-
E. spinosum cultivation placed at two different locations, one at near from the pond waste disposal and the other one far from the pond waste disposal. The result showed seaweed E. spinosum that cultivated far from the pond waste disposal had a better yield than the near from the pond waste disposal. The average seaweed growth during six weeks observation showed at the Table 2.
TABLE 2
OBSERVATION OF SEAWEED GROWTH RATE (%/G/WEEK)
|
No. |
Weeks Location 1 2 3 4 5 6 |
|
1. |
Near from pond 5.25 5.45 5.85 - - - waste disposal |
|
2. |
Far from pond 5.35 5.55 5.95 6.5 6.75 7.05 waste disposal |
The table compared seaweed growth in each location, which the location that far from the pond waste disposal indicated rapid growth of seaweed. At the location near from the pond waste disposal, its lowest growth rate was 5.25% g at week I and the highest was 5.8% g at week VI. Furthermore, the location that far from the pond waste disposal had the lowest growth rate at 5.35% g at week I and the highest growth rate 7.05% g at week VI.
The graph of seaweed growth rate (Fig. 1) showed the
R value for the location that far from pond waste disposal was higher (R2 = 0.9845; linear), than the near from pond waste disposal (R2 = 0.7316; not linear). This graph indicated the location that far from pond waste diposal had better growth rate. The y value at the graph showed trend of linear regression, which indicated the positive relationships for the location that far from pond waste disposal (y = 0.3614x + 4.9267) and negative relationships for the location that near from pond waste disposal (y= -
1.3843x + 7.6033). Therefore, the growth rate of seaweed at near from pond waste disposal was slower, and at week III the three of seaweed bunches were dead.
The relative growth of seaweed is the increasing
growth of seaweed at particular time. From the Table 3, the relative growth of the location near from pond waste disposal was ended at week III for 0.17 g, while for the far location ended at week VI for 0.41 g.
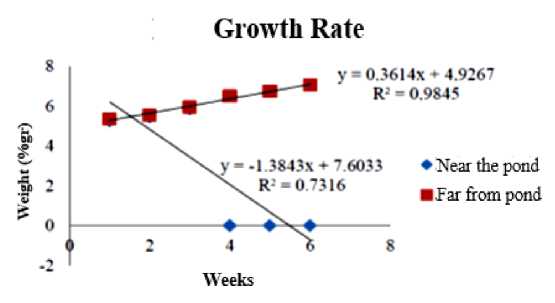
Figure 1. Curve of Seaweed Growth Rate
1 2 3 4 5 6
|
Near from |
|
1. pond waste 0.05 0.09 0.17 - - - |
|
disposal |
|
2. Far from pond 0.07 0.11 0.19 0.3 0.35 0.41 |
|
waste disposal |
TABLE 3
RELATIVE GROWTH (GRAM)
Weeks
Num. Location
This research showed the difference growth of seaweed between the two locations. The average of seaweed final weight for the location near from the pond waste disposal was 5.85% g with 0.17 g increment, while for the location far from pond waste disposal was higher at 7.05% g with 0.41 g increment.
Based on observation, seaweed growth at the location far from pond waste disposal was faster than the near. This could be caused by the clorine residu from the pond tub washing. Chlorine would inhibit the growth of seaweed and causing dead. Chlorine also known as a dangerous chemical for the aquatic ecosystem, particularly in form of hypochlorite acid (HClO) and chloramine (NH2Cl). Chloramine formed from the reaction between chlorine and ammonia or the other organic compounds that contain nitrogen such as protein and amino acid. This compound had a high toxicity level for aquatic organism (Keenan et al., 1990).
Turbidity defined as a measurement of light refraction in water that caused by particle and suspension of anorganic materials that slowly degradated, industrial waste, rubbish, and others that contained in water (Yusuf, 2005).
Sutika (1989) pointed if turbidity would induce respiratory complication and decreasing the dissolved oxygen content in water. This would be inhibited seaweed growth of the location near the pond waste disposal, because of the disturbance in photosynthesis and the mud that sticked at the algae thallus which damaging the thallus. Besides that, the location that near from the pond
waste disposal had high amount of rubbish and Ulva spp. which also sticked at the seaweed E. spinosum thallus. During the research from week I to IV, the weather was not supporting the growth of seaweed, like the high wave tide that wrecking and washing out seaweed’s thallus, even detaching the ris line.
-
IV. CONCLUSION
This research indicated the average weight of seaweed E. spinosum at the location near from pond waste disposal was 5.85% g with 0.15% g increment, while for the location far from pond waste disposal was 7.05% g with 0.41% g increment. The E. spinosum that cultivated at location far from pond waste disposal had a better growth. The chlorine that contained in pond waste affected the water quality, such as salinity, temperature, pH, DO, nitrate, and phosphate, and also affecting the seaweed growth rate.
Acknowledgment
Thanks to Rector of Udayana University and Head of Institute for Reasearch and Community Service Universitas Udayana for the reasearch funding. We also thanks to the people of Patas village, district of Gerokgak, Buleleng regency and research team for the assistance and support during the running of this research.
References
-
[1] Aslan, M. 1998. Budidaya Rumput Laut. Kanisius: Yogyakarta.
-
[2] Anggadiredja, Jana T, Achmad Zatnika, Heri Purwoto dan Sri Istini. 2009. Rumput Laut. Penebar Swadaya: Jakarta.
-
[3] James J. J. and R. E. Drenovsky. 2007. A basis for relative growth rate differences between native and invasive forb seedlings. Rangeland Ecology and Management 60: 395–400.
-
[4] Luning, K. 1990. Seaweed, Their Environment, Biogeoraphy, and Ecophysiology. A Wiley Interscience Publication. USA. 527 p.
-
[5] Effendi. H. 2003. Telaah Kualitas Air bagi
Pengelolaan Sumberdaya dan Lingkungan Perairan. Penerbit Kanisius. Yogyakarta.
-
[6] Tomascik, T., A.J. Mah, A. Nonji; and M.K. Moosa. 1997. The Ecology of the Indonesian Seas. Part Two. The Ecology of Indonesian Series. Vol. VII. Periplus Editions (HK) Ltd; 421-486.
-
[7] Ditjenkan Budidaya, 2005. Profil Rumput Laut Indonesia. Direktorat Perikanan Budidaya,
Departemen Kelautan dan Perikanan. Jakarta.
-
[8] Boyd, C.E. 1990. Water Quality in Ponds for Aquaculture. Alabama Agriculture Experimental Station. Auburn University, Auburn.
-
[9] Sulistidjo, 1996. The Harvesr Quality of alvarezii Culture by Floating Method in Pari Island Nort
Jakarta. Jakarta: Researchand Development Center for Oceanology. Indonesia Institute of Science.
-
[10] Boyd, C. E. And F. Lichtkoppler. 1982. Water Quality Management in Pond Fish Culture. Auburn University, Auburn.
-
[11] Tambaru, R., dan F. Samawi. 1996. Beberapa
parameter kimia fisika air di muara Sungai Tallo Kota Makassar. TORANI Universitas Hasanuddin.
Makassar.
-
[12] Indriani, H dan Sumiarsih, E. 1988. Rumput Laut. Jakarta: Penebar Swadaya.
-
[13] Patanjai, R. S. 2007. Pertumbuhan, Produksi dan Kualitas Rumput Laut Kappaphycus alvarezii (Doty) pada Berbagai Habitat Budiodaya yang Berbeda. Program Pasca Sarjana. Universitas Hasanuddin. Ujung Pandang.
-
[14] Keenan, UK, Kleinfester DC, Demwood JA. 1990. Kimia untuk Universitas. Jakarta: Erlangga.
-
[15] Yusuf, M.I., 2005. Laju Pertumbuhan Harian,
Produksi dan Kualitas Rumput Laut Kappapycus alvarezii (Doty), 1988 yang dibudidayakan Dengan Sistem Aliran Air Media dan Tallus Benih Yang Berbeda. Disertasi. Universitas Hasanuddin.
Makassar.
-
[16] Sutika, N. 1989. Ilmu Air: Universitas Padjadjaran. BUNPAD Bandung. Bandung.
Discussion and feedback